

Abstract
Tandem DNA repeats vary by the size and sequence of each unit (motif). When expanded, they have been associated with >40 monogenic disorders1. Their involvement in complex disorders is largely unknown, as is the extent of their heterogeneity. Here, we interrogated genome-wide characteristics of tandem repeats with 2-20 bp motifs in 17,231 genomes of families with autism2,3 and population controls4. We found extensive polymorphism in motif size and sequence. Many correlated with cytogenetic fragile sites. At 2,588 loci, gene-associated tandem repeat expansions that were rare among population controls were significantly more prevalent among individuals with autism than their unaffected siblings, particularly in exons and near splice junctions and in genes related to nervous system development and cardiovascular system or muscle. Rare tandem repeat expansions had a prevalence of 23.3% in autism-affected children versus 20.7% in unaffected children, suggesting a collective contribution to autism risk of 2.6%. They included novel autism-linked tandem repeat expansions in DMPK and FXN, known for neuromuscular conditions, and in novel loci such as FGF14 and CACNB1. These were associated with lower IQ and adaptive ability. Our results revealed a strong contribution of tandem DNA repeat expansions to the genetic etiology and phenotypic complexity of autism.
Introduction
Technical advances in genome analysis have improved clinical diagnosis and gene discovery for human diseases that have a significant genetic component5. However, for many complex disorders, including autism spectrum disorder (ASD), the causal genetic variants thus far identified generally confer less risk than expected from empirical estimates of heritability6.
ASD is a group of neurodevelopmental disorders characterized by atypical social function, communication deficits, restricted interests, and repetitive behaviors7. Genetic factors contribute to the etiology of ASD; twin studies estimate heritability in the 50–90% range, and recurrence in families is ~20%8,9. Individuals with ASD can have additional medical complications such as intellectual disability or epilepsy, and ASD itself features in many medical genetic conditions, the prototypical example being fragile X syndrome10.
Genomic analyses have shown that individuals with ASD have a two- to three-fold increase in the number of rare copy number variations (CNVs) and de novo loss-of-function (nonsense, frameshift, and splice site) variants compared to their unaffected siblings11–14. More complex structural DNA variations are also involved in ASD15,16. With all of these studies combined, more than 100 genes and loci are known to be associated with increased likelihood of ASD2,13. However, collectively, these genetic factors are involved in the etiology of only ~20% of ASD cases17,18. Genome sequencing is the current state-of-the-art technology for variant detection, but even its application leaves the majority of ASD cases “genetically unsolved”2,19–21. While common variants may account for a substantial genetic liability of ASD22,23, the “missing heritability” could, in part, be attributed to the difficulty of resolving complex variants such as variations in repetitive regions of DNA from short-read next-generation sequence data24,25.
Tandem repetitive DNA makes up ~6% of the human genome. Alternative repeat motifs are found in some disorders associated with tandem repeat expansions26,27, which complicates identification, but a novel algorithm can now detect them from genome sequence28. A given tandem repeat-related gene can contribute to a variety of clinically distinct conditions. For example, the unstable CGG tract of FMR1 has been linked to intellectual delay in fragile X syndrome, fragile X premature ovarian insufficiency, fragile X associated ataxia, endocrine, autoimmune, metabolic disease, and ASD29.
Results
Tandem repeat detection
To assess the characteristics of tandem repeat expansions in the human genome, we collected data from 20,048 genomic samples sequenced on Illumina platforms with >30x mean depth from the Autism Speaks MSSNG project2, the Simons Simplex Collection (SSC)3, and the 1000 Genomes Project4 (Extended Data Fig. 1). We estimated the length of tandem repeats using the ExpansionHunter Denovo (EHdn) algorithm30. EHdn detects tandem repeats involving motifs of 2–20 bp whose total length is greater than the sequencing read length (Extended Data Fig. 1). It functions irrespective of prior knowledge of the presence or expected sequence of the tandem repeats at any given region. We could validate 77% of the tandem repeats detected by EHdn in the HuRef genome31 by comparing to tandem repeats detected by an orthogonal strategy involving long-read sequencing data (Methods). After extensive sample curation (Extended Data Figs. 2 and 3; Supplementary Notes), our final set contained 17,231 genomic samples, including 3,636 ASD families, 1,558 ASD singletons (N=1,534 from MSSNG and N=24 from SSC), and 2,504 population controls. For further verification of population frequency, we used 1,612 genomic samples from GTEx32 and the Mayo Clinic33 (Extended Data Fig. 1).
Wide variability of tandem repeats
We identified 37,865 tandem repeat motifs in 31,793 distinct regions of the human genome, revealing that a given tract could have more than one motif, with ~1.2 different motifs per region (Supplementary Table 1). We defined a tandem repeat-containing region as a genomic location where tandem repeats detected with one or more different motifs overlapped with each other by at least 1 bp (Extended Data Fig. 1). The number of motifs per region varied across chromosomes in an apparently non-random manner (Fig. 1a and Extended Data Fig. 4). There were 2,529 regions (8%) with more than one motif, and as many as 92 different motifs in a single region (chr2:32915989–32916586; Extended Data Fig. 4). Consistent with a previous report34, the motifs were predominantly (>40%) AC- (GT- on the opposite strand) or AG- (CT- on the opposite strand) rich (Fig. 1b; Supplementary Fig. 1). Of the motifs, 5.6% were composed only of A or T nucleotides, and only 0.4% were composed of C or G only (Fig. 1b). The majority (72.2%) of repeat tracts had motifs <7 bp, even though EHdn can detect motifs up to 20 bp (Fig. 1c). The most common motif size was 2 bp, found in 27.7% of repeat tracts. In the smallest size range, even-numbered motif sizes (2, 4 and 6 bp) notably outnumbered the odd-numbered sizes (3 and 5 bp), whereas no such trend was evident among the larger motifs (Fig. 1c).
Fig. 1 |. Genome analysis of tandem repeats.
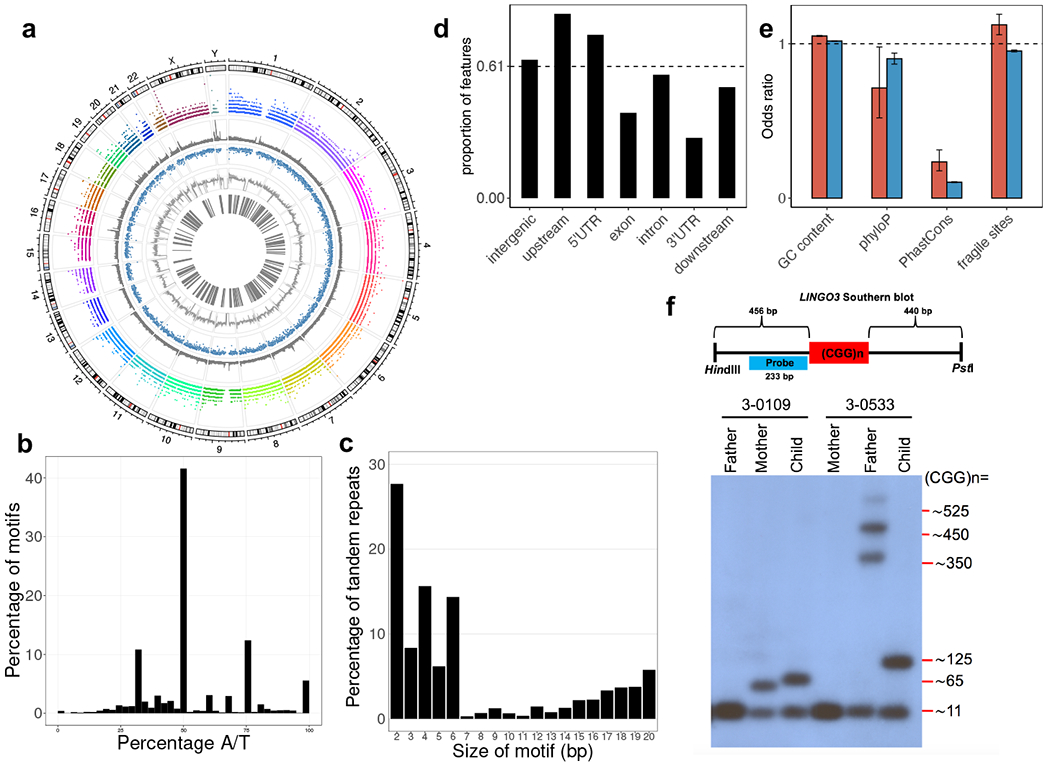
a, Circos plot showing the genomic distributions (1st layer) of 31,793 regions with tandem repeats (2nd layer), known simple sequence repeat regions (3rd layer), sequence conservation (4th layer), GC content (5th layer), and known fragile sites (6th layer). b, Nucleotide composition of the tandem repeats detected. c, Distribution of repeat unit (motif) sizes for the tandem repeats detected. d, Proportion of genic features overlapped by the tandem repeats detected. The proportion is derived from the size of tandem repeats over the total size of each genic feature. Dashed line indicates genome-average level. e, Correlation analysis between tandem repeats and different genomic features in a. By binning the genome into 1 kb windows, we tested the correlation/enrichment of different genomic features and the tandem repeats by regressing a genomic feature on the number of tandem repeats found per window. The odds ratios were derived from the logistic regression coefficients of the genomic features. Red bars represent tandem repeats detected (N=31,793 tandem repeat loci), while blue bars represent known simple sequence repeats (N=1,031,708 known short tandem repeats). Error bars indicate 95% confidence intervals. f, Validation of variable size in a tandem repeat detected. Schematic diagram (top) shows the design of a Southern blotting experiment in the targeted repeat in LINGO3, which overlaps with the location of fragile site FRA19B. Two families with different repeat sizes (3-0109 and 3-0533) are shown. In family 3-0533, the allele of size ~125 CGG repeats in the child appears to be a contraction of the father’s expanded allele, which displays multiple bands varying in repeat size (~350, ~450, and ~525 CGG repeats). Repeat length validation experiments for LINGO3 were consistently reproduced at least 3 to 5 times (see Supplementary Figure 8).
To understand the distribution of the tandem repeat-containing regions, we correlated their presence with different genomic features (Fig. 1d). As expected, they were prevalent in known polymorphic simple sequence repeat regions previously detected by Tandem Repeats Finder35 in 1,031,708 locations in the human reference genome (odds ratio (OR)=6.24; p<2.2×10⁻¹⁶)36. Of the tandem repeat-containing regions reported here, 14,003 (42.3%) have not been previously reported. For the tandem repeat-containing regions that overlapped known simple sequence repeat regions, 1,149 (6%) had at least one motif not found in the reference sequence. These tandem repeat-containing regions were more prevalent in GC-rich regions (OR=1.05; p<2.2×10⁻¹⁶) and all (common and rare) known fragile site regions (OR=1.12; p=1.2×10⁻⁴), but depleted within conserved DNA sequences (OR=0.24; p<2.2×10⁻¹⁶ for PhastCons and OR=0.71; p=0.04 for phyloP) (Fig. 1e). In genic regions, tandem repeat-containing regions were more common than the genomic average in upstream (OR=1.33; p<2.2×10⁻¹⁶) (1 kb from transcription start sites) and 5’ untranslated (OR=1.2; p<2.2×10⁻¹⁶) regions but less common in exonic (OR=0.61; p<2.2×10⁻¹⁶) and 3’ untranslated (OR=0.43; p<2.2×10⁻¹⁶) regions (each feature was normalized by its corresponding size spanning across the genome) (Fig. 1d).
The increased recognition of tandem repeats in cytogenetically known fragile site locations may allow refined mapping of those that are not yet characterized at molecular resolution and provide important information on susceptibility to genome instability. Indeed, tandem repeat-containing regions we identified co-localized to 9 of 11 (81.8%) of the molecularly mapped rare folate-sensitive fragile sites37, all at CG-containing tandem repeats, including the cytogenetically confirmed FRA12A/DIP2B, FRAXA/FMR1, and FRAXE/AFF2 sites. Intriguingly, 10 of 13 (76.9%) of the currently molecularly unmapped fragile sites overlapped with at least one GC-rich tandem repeat-containing region detected by EHdn (Extended Data Table 1). One of the potentially novel mapped fragile sites was FRA19B, which overlapped with a CGG tandem repeat detected at the 5’ untranslated region in LINGO3. An expansion of this tandem repeat in one sample was confirmed by repeat-primed PCR and Southern blotting (Fig. 1f). Other examples can be found in Supplementary Fig. 2.
Rare tandem repeat expansions in ASD
Tandem repeat expansions that are disease-causing and functionally impactful tend to be large and rare in the general population1,38. We applied a non-parametric approach to identify individual tandem repeats whose tract lengths were outliers compared to other members of the cohorts (Methods). We designated these outliers as tandem repeat expansions. We further categorized them as rare tandem repeat expansions when found in <0.1% of the population controls (1000 Genomes Project). This resulted in 2,588 tandem repeat-containing regions (3,339 motifs) being categorized as rare tandem repeat expansions (Extended Data Fig. 1).
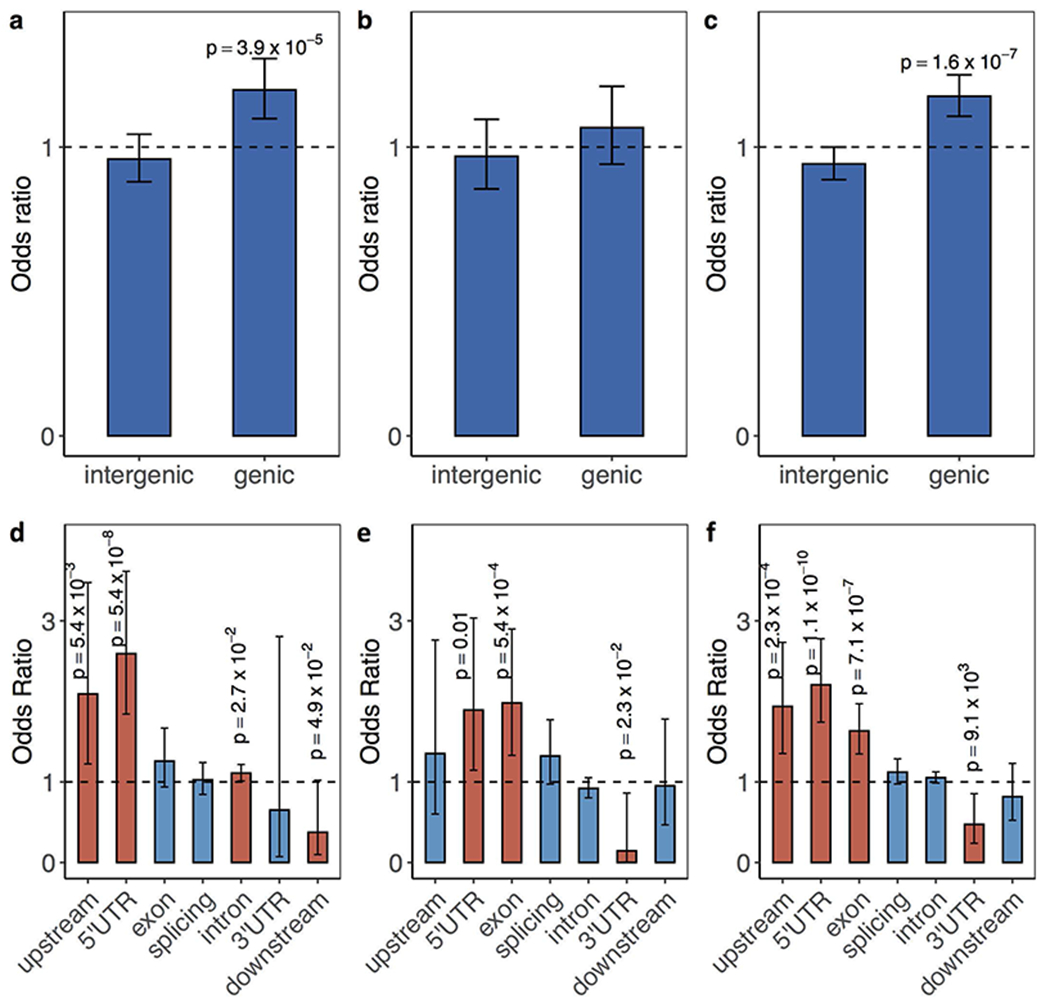
To delineate their possible functional roles, we assessed whether the rare tandem repeat expansions identified here contribute to ASD risk by performing burden analysis in individuals of European ancestry from SSC. To avoid sex bias on allele transmission, we compared their occurrence only in autosomal regions. We used sex and number of intergenic tandem repeat expansions as covariates in the statistical tests (Methods). Rare, genic (as defined above) tandem repeat expansions were more prevalent in children with ASD (N=1,812) than in their unaffected siblings (N=1,485) (OR=1.37; p=3×10⁻³) (Fig. 2a; Supplementary Table 2). No difference was detected for tandem repeat expansions in intergenic regions (without using intergenic expansions as a covariate) (Fig. 2a). X-linked tandem repeat loci were analyzed separately by sex, but there was no significant difference between ASD-affected children and their unaffected siblings (Supplementary Notes). The detection rate of rare tandem repeat expansions was 23.3% in ASD-affected children and 20.7% in unaffected children, suggesting that as much as 2.6% of ASD risk may be contributed by rare tandem repeat expansions (Wilcoxon test, p=0.03). These rare tandem repeat expansions generally represented further expansions from already-large tandem repeats from the previous generation (but not in the unaffected siblings), since the average repeat length of these parents was at the 99th percentile of the length distribution (Fig. 2b). This transmission expansion bias of longer tandem repeats is consistent with the instability trends for almost every disease-associated tandem repeat1,38.
Fig. 2 |. Functional analysis of rare (<0.1% frequency in 1000G) tandem repeat expansions.
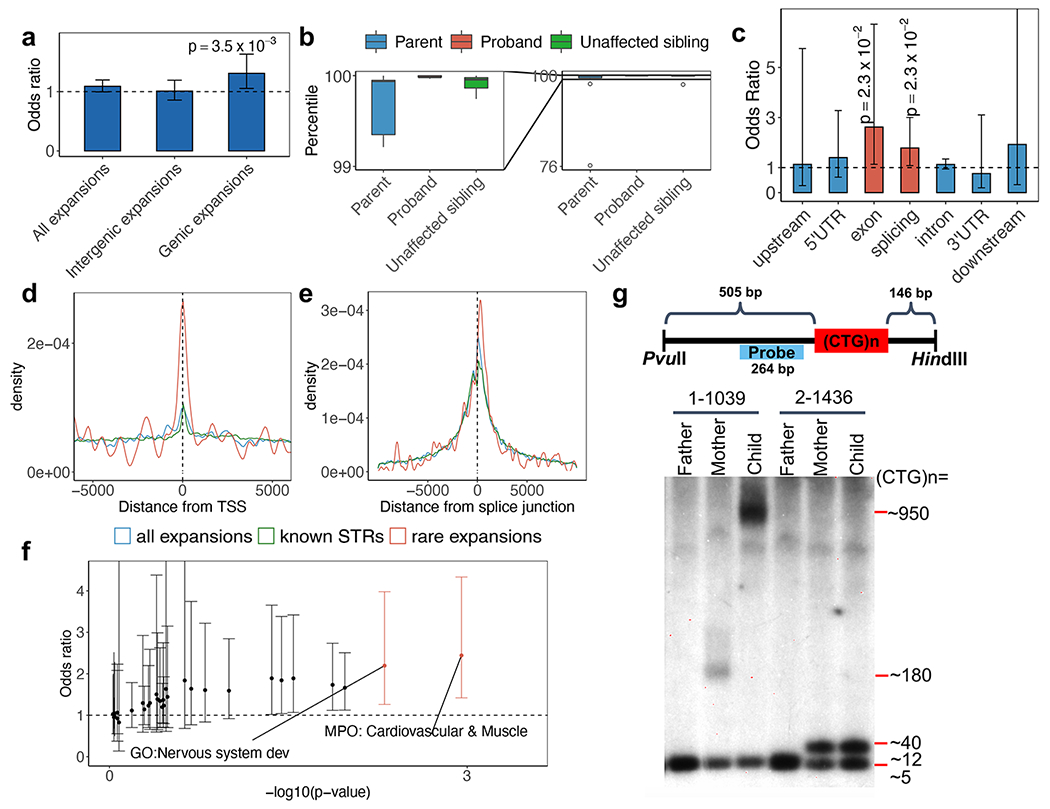
a, Burden comparison of all rare expansions, intergenic rare expansions, and genic rare expansions. Odds ratio is for ASD-affected individuals (N=1,812) compared with their unaffected siblings (N=1,485). The trend for genic expansions is preserved regardless of the frequency threshold used to define a tandem repeat expansion as rare in population controls (Supplementary Table 10). b, Repeat size distribution in probands, their parents, and their unaffected siblings, where the probands have rare tandem repeat expansions (N=10 families). The diagram on the left shows a zoomed-in view of the repeat-size distribution between the 99th and 100th percentile. The minima and maxima indicate 3×inter-quartile range-deviated tandem repeat size from the median, and the centre indicates the median of the tandem repeat size. c, Rare tandem repeat expansion burden in different genomic features. Red bars indicate significant enrichment in ASD-affected individuals (family-wise error rate; FWER < 20%). The horizontal dashed line represents odds ratio=1. An ANOVA test comparing two logistic regression models was used to obtain the results in b and c. d-e, Distance of rare tandem repeat expansions (all individuals), all tandem repeats detected, and known simple sequence repeats to the nearest transcription start site (TSS) (d) and the nearest splice junction (e). Rare tandem repeat expansions (N=258 loci close to TSS and N=297 loci close to splice junctions) are significantly closer to TSS (Wilcoxon test, p=0.01 and 0.003 for all tandem repeats detected (N=5,805 loci) and known simple sequence repeats (N=133,264 loci), respectively) and splice junctions (Wilcoxon test, p=0.03 and 0.002 for all tandem repeats detected (N=7,279 loci) and known simple sequence repeats (N=161,932 loci), respectively). f, Gene set burden analysis of number of rare tandem repeat expansions affecting genes in a gene set comparing ASD-affected individuals (N=1,812) with their unaffected siblings (N=1,485). Orange points indicate odds ratios of gene-sets with FWER < 20%. g, Schematic diagram (top) shows the design of a Southern blotting experiment in the targeted tandem repeat in DMPK. Two families with different repeat sizes (1-1039 with expansions and 2-1436 without expansions) are shown. Repeat length validation experiments for DMPK were consistently reproduced at least 3 to 5 times (see Supplementary Figure 8). Error bars in a, c and f indicate 95% confidence intervals.
Functional effects of rare expansions
Towards assessing possible functional effects of the rare tandem repeat expansions, we examined their proximity to different features within genes. We found the ASD-associated rare tandem repeat expansions to be increased in exonic (OR=2.62; p=0.02; family-wise error rate (FWER)=0.16) and splicing (OR=1.78; p=0.02; FWER=0.16) regions (Fig. 2c). The proximity to genes for the ASD-associated tandem repeat expansions may suggest their regulatory roles. For example, compared to known simple sequence repeats and EHdn-detected tandem repeats, rare tandem repeat expansions were located closer to the genes’ nearest transcriptional start sites (Wilcoxon test, p=0.003 and 0.01 for known simple sequence repeats and EHdn-detected tandem repeats, respectively) and splice junctions (p=0.002 and 0.03) (Fig. 2d–e). Further, genes harbouring rare tandem repeat expansions near transcription start sites or splice junctions were significantly more constrained (gnomAD o/e) than other genes (p=2×10⁻⁵ and 1.6×10⁻⁶, respectively) (Extended Data Fig. 5), suggesting that alteration of transcription or splicing may be important mechanisms for ASD-associated tandem repeat expansions.
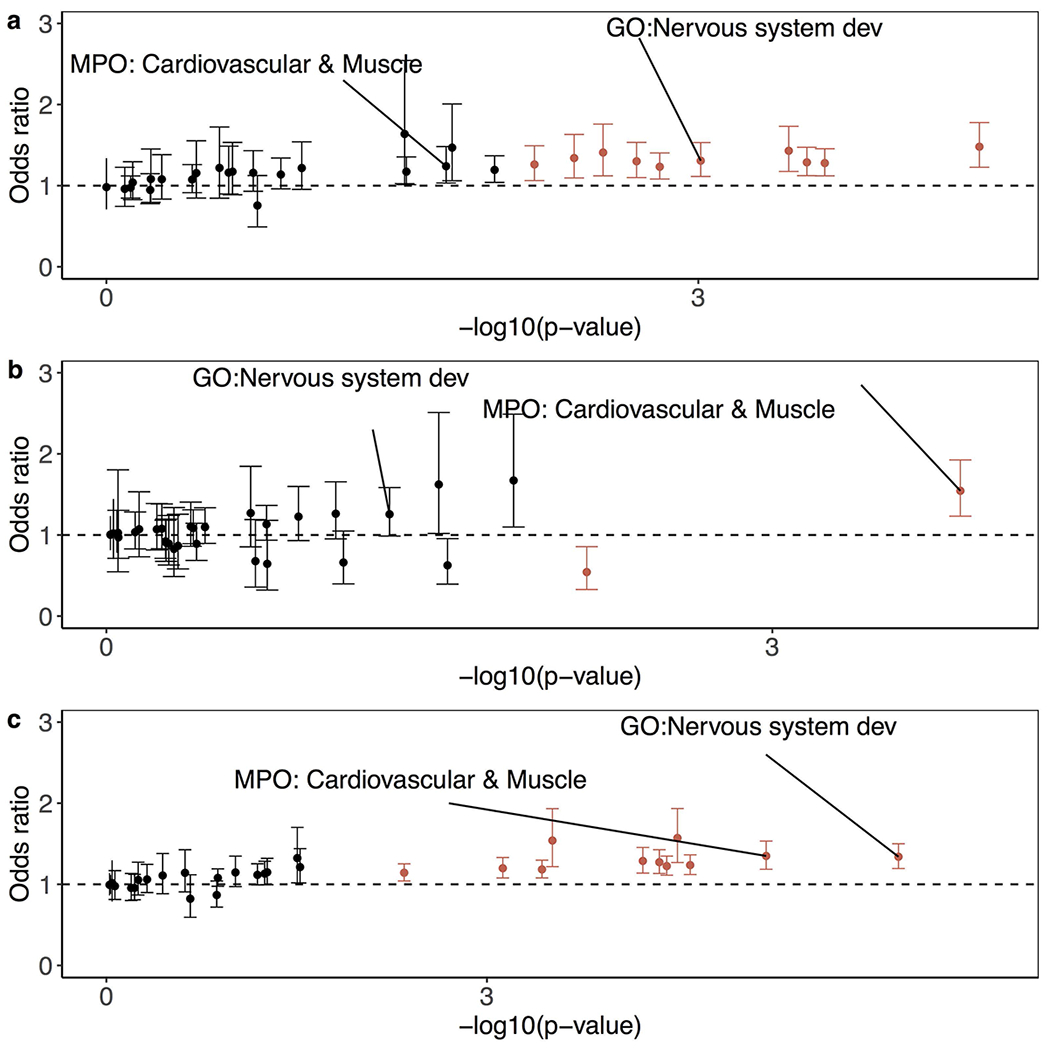
In terms of the biological pathways associated with the genes impacted by the identified rare tandem repeat expansions, we investigated their relevance to previously known ASD-related gene functions and pathways using the pathway enrichment test (Methods)39. Unlike rare single nucleotide variants (SNVs) and CNVs, which predominantly impact neural synaptic functions2,11, ASD-linked genes with rare tandem repeat expansions were predominantly involved in cardiovascular system or muscle (OR=2.44; p=0.001; FWER=0.04) and nervous system development (OR=2.2; p=0.005; FWER=0.16) (Fig. 2f). The genes involved were not associated with common variant risk based on previous genome-wide association studies (GWAS) for ASD and ASD-correlated traits (Supplementary Table 3), but burden of rare tandem repeat expansions was significantly more pronounced in known ASD-risk genes from SFARI40 (OR=2.51; p=0.03) (Supplementary Table 4). There was no correlation between the presence of de novo deleterious (deletion41 and loss of function) variants and rare tandem repeat expansions (Supplementary Fig. 3).
Given that rare tandem repeat expansions in children with ASD are expanded from large tandem repeats from the parents (Fig. 2b), we assessed the transmission rates of large tandem repeats (>99th percentile of length distribution) from parents of European ancestry in MSSNG (representing a form of replication of the SSC burden tests) and SSC (as an additional, though non-independent, corroboration of the SSC burden tests). Consistent with the burden analysis in SSC between individuals with ASD and their unaffected siblings, we found that in individuals with ASD, these large tandem repeats were more likely to be transmitted and were more prevalent in exons and splice sites (Extended Data Fig. 6); nervous system development and cardiovascular system or muscle were also among the top enriched gene sets (Extended Data Fig. 7). We also detected an enrichment for transmitted large tandem repeats in SSC unaffected siblings; however, these tandem repeats were more likely to be further expanded in ASD-affected individuals (Supplementary Notes). Preferential transmission of premutated or expanded repeats to unaffected, subclinical, and affected individuals has been observed in many different repeat-related diseases42–44.
ASD-relevant tandem repeat regions
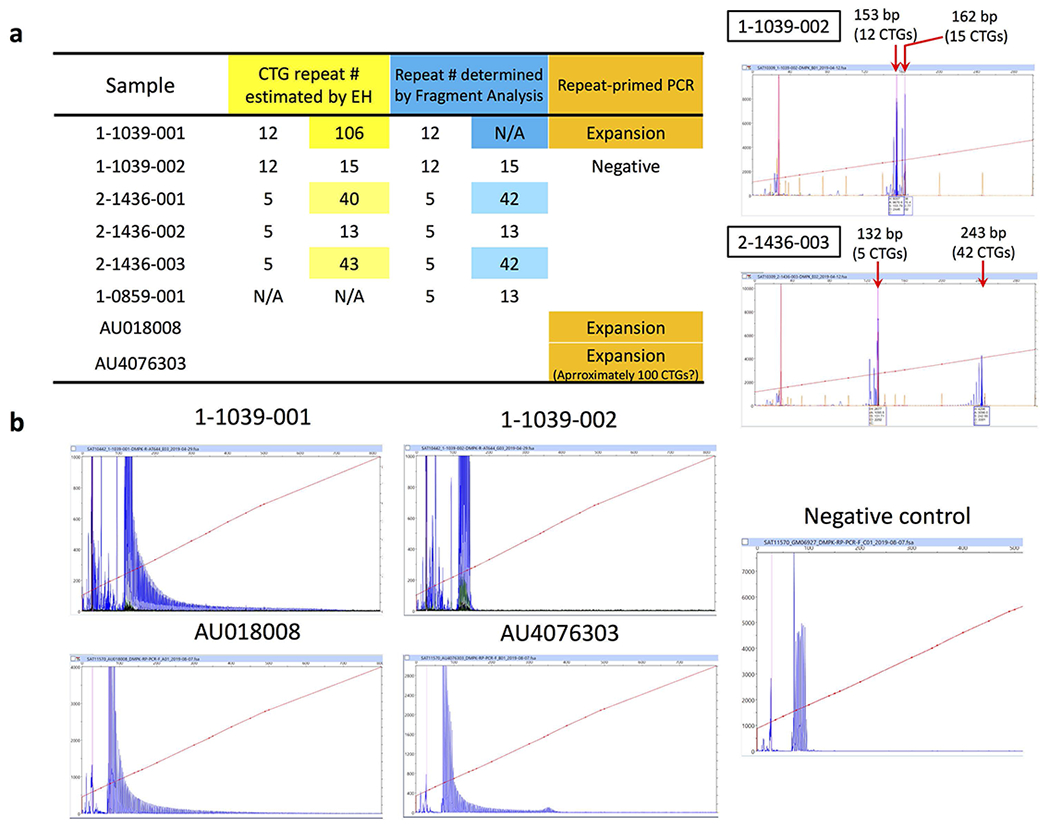
Since the findings from MSSNG and SSC were consistent and there was no significant difference in the detection rate of rare tandem repeat expansions between the two cohorts (Supplementary Fig. 4), we combined counts of rare tandem repeat expansions of all individuals with ASD (all ancestries) from the two cohorts to identify top tandem repeat loci (including X-linked) from the two gene sets that were nominally significant in the pathway enrichment test (nervous system development and cardiovascular system or muscle). One prominent example was the CTG repeat in DMPK, whose expansion to greater than 50 repeat units causes myotonic dystrophy type 1 (DM1) (OMIM ID: 160900) (Fig. 2g). Approximately 5% of individuals with DM1 also have ASD45,46. We identified 7 individuals with ASD from unrelated families and 1 unaffected sibling that carry rare CTG repeat expansions in DMPK (experimentally validated with repeat-primed PCR and Southern blotting; Fig. 2g and Extended Data Fig. 8). Thus, our independent, unbiased approach confirmed a previously indicated association between ASD and DMPK tandem repeat expansions45,46. We further selected 9 additional examples (tandem repeats in FGF14, CACNB1, FXN, CDON, MYOCD, MBOAT7, IL1RAPL1, FMR1, and IGF1) having more than 0.1% frequency in ASD-affected individuals and less than 0.1% frequency in unaffected siblings as top candidates to be ASD-relevant tandem repeat-containing regions when expanded (Table 1). We confirmed the tandem repeat expansions in these 10 genes using another tandem repeat detection algorithm, ExpansionHunter47,48, as well as by visualizing read pile-ups and by gel electrophoresis and Sanger sequencing (Extended Data Fig. 9). Due to their rarity, none of these regions considered individually were statistically increased in ASD subjects. Rare tandem repeat expansions in 57 loci (having a higher frequency in ASD-affected individuals than unaffected siblings) within these enriched gene sets collectively accounted for 2.2% (40 of 1,812) of the ASD cases in SSC (OR=4.76; p=2×10⁻⁵), and 2.5% in the entire cohorts (129 of 5,194) (Supplementary Table 5). We included 1,612 additional population controls to verify that the top tandem repeat expansions were rare (≤0.1% frequency) in population controls (Table 1; Methods). We used ExpansionHunter to genotype 49 known disease loci, 18 of which have disease-causing size thresholds smaller than detectable by EHdn (150 bp), and there was no statistically significant enrichment in ASD-affected individuals exceeding the disease-causing threshold for any locus (Supplementary Notes).
Table 1.
Top candidate ASD-relevant tandem repeat loci
| Coordinate and risk motifs1 | N (cases) | % (pop.2) | Gene (region) | Known ASD gene | Known disease-linked expansion | OMIM disorder |
|---|---|---|---|---|---|---|
| chr19:54187285-54188613 (AAAG;AAAGGAAG;AAGG) |
10 | 0.06 |
MBOAT7 (intronic) |
Known | Novel | Mental retardation, autosomal recessive |
| chr9:69036648-69037984 (AAG;AAGGAG) |
8 | 0.1 |
FXN (intronic) |
Novel | Known | Friedreich’s ataxia |
| chr19:45769551-45770697 (AGC) |
7 | 0.1 |
DMPK (3′UTR) |
Known | Known | Myotonic dystrophy type 1 |
| chr13:102160822-102162469 (AAGGAG;AAGAGG;AAAGAAGAAG) |
7 | 0 | FGF14 (intronic) |
Novel | Novel | Spinocerebellar ataxia type 27 |
| chr17:39182673-39183931 (AAGGAGGAG;AAGAAGGAG) |
7 | 0 |
CACNB1 (intronic) |
Novel | Novel | NA |
| chr11:126063945-126066092 (AAGAGGTGGCAGTATT) |
6 | 0 |
CDON (upstream) |
Novel | Novel | Holoprosencephaly |
| chr17:12693129-12694105 (AAAAT) |
6 | 0.1 |
MYOCD (intronic) |
Novel | Novel | NA |
| chr12:102440998-102442508 (AAG;AAGGAG;AAGAGG) |
6 | 0.1 |
IGF1 (intronic) |
Novel | Novel | Insulin-like growth factor I deficiency |
| chrX:147911368-147912629 (CCG) |
6 | 0 |
FMR1 (5′UTR) |
Known | Known | Fragile X syndrome |
| chrX:29802527-29803810 (ACACATATGTATACATGTAT;ACACATATGTATATATGTAT) |
6 | 0 |
IL1RAPL1 (intronic) |
Known | Novel | Mental retardation, X-linked |
Loci on the X chromosome were not included in the overall statistical comparisons for functional analysis. They were added here only for reference.
Frequency from 1,612 additional population controls from GTEx and the Mayo Clinic Biobank.
As with the carriers of de novo loss-of-function SNVs or CNVs, we found a trend of rare tandem repeat expansions in the enriched gene sets more often in females than in males (OR=1.3; p=0.11) (Fig. 3a), which may further support the differential genetic loading for males and females in ASD49. Consistent with our previous findings for rare pathogenic SNVs and CNVs, subjects with rare tandem repeat expansions had lower IQ (Wilcoxon test, p=0.001) and Vineland Adaptive Behavioral standard scores (Wilcoxon test, p=0.019) (Fig. 3b). This provides compelling evidence for the role of rare tandem repeat expansions in ASD-related phenotypes2,39,50.
Fig. 3 |. Clinical analysis of rare tandem repeat expansions in individuals with ASD.
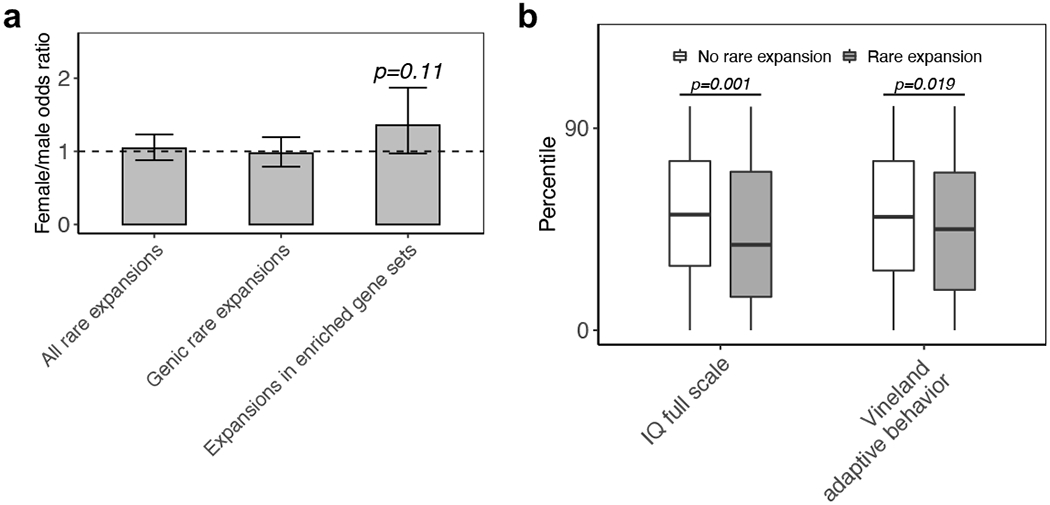
a, Comparison of the fraction of samples having rare tandem repeat expansions in females (N=857) versus males (N=4,377) (Fisher’s exact test). An odds ratio of more than 1 indicates a higher burden of rare tandem repeat expansions in females. Error bars indicate 95% confidence intervals. b, Comparison of IQ and Vineland Adaptive Behavior standard scores of individuals with (N=139 individuals with IQ score and N=310 individuals with Vineland score) and without (N=426 individuals with IQ score and N=803 individuals with Vineland score) rare tandem repeat expansions (one-sided Wilcoxon test). The minima and maxima indicate 3×inter-quartile range-deviated scores from the median, and the centre indicates the median of the score percentiles.
Discussion
Our findings represent a significant advancement in ASD genetics, as we discovered many genes involved in the tandem repeat expansions that had not been previously identified using conventional genomic analyses (Table 1). Beyond implications for ASD, we have revealed far more extensive variability among tandem repeat sequences than previously recognized in the human genome, with 8% of the tandem repeats interrogated having more than one motif detected. This suggests that some genes may be prone to expansions with different repeat motifs.
Coupling tandem repeat identification with an outlier detection method, we identified 2,588 tandem repeat-containing regions that, when expanded in ASD, predominantly occur in genes involved in biological functions and pathways, such as those involved in nervous system development, the cardiovascular system and muscle tissues. However, the substantial correlation between the tandem repeat expansions and clinical outcomes point to their involvement in shaping cognitive and behavioral phenotypes in ASD. For example, DMPK, in which rare SNVs and CNVs were found in individuals with ASD, had not been conclusively linked to ASD previously, because the majority of ASD-relevant alterations were not detected until the expanded tandem repeats were analyzed in our study. Notably, many of the ASD-relevant tandem repeat expansions we discovered are in the non-coding regions of genes, and their mechanisms of gene regulation and aberrant splicing have been well-established (e.g., FXN and DMPK).
While allowing sensitive and accurate detection of the expanded tandem repeat sequence, the method we developed here only provides an estimated relative aggregated length of the tandem repeat tracts and does not resolve zygosity or orientation. Similar to many other tandem repeat genotyping tools25, our independent experimental validation showed that our method usually underestimated the number of repeat units at the large expanded tandem repeats. Although we have demonstrated that expanded tandem repeats collectively contribute to ASD, their individual rarity prevents us from establishing their individual contributions to ASD or their influence on penetrance and other phenotypic parameters. Continued investigation of tandem repeat expansions with larger cohorts and improved algorithms, coupled to deeper mutation-guided phenotypic examination, promises to further explain the complex genetic etiology of ASD. In addition, due to limitations in existing algorithms, we were unable to perform a comprehensive genome-wide scan for tandem repeats <150 bp. If and when such algorithms become available, it would be of interest to repeat the current analysis to identify loci harbouring potentially-pathogenic expansions smaller than this size threshold. Further genotype and phenotype studies on the identified candidate loci are necessary for proper medical management and counselling in ASD7 (Supplementary Notes). Our strategy of genome-wide detection of expanded tandem repeats in ASD also provides a model to search for missing heritability in other complex disorders.
Methods
Samples
We used genome sequencing data derived from 8,448 samples from the MSSNG project2, 9,096 samples from the Simons Simplex Collection (SSC)3, and 2,504 samples from the 1000 Genomes Project (1000G)4. All SSC samples used PCR-free DNA library preparation and were sequenced on the Illumina HiSeq X platform (2 x 150 bp paired-end reads). All 1000G samples used PCR-free library preparation and were sequenced on the Illumina NovaSeq platform (2 × 150 bp paired-end reads). Each MSSNG sample fell into one of three categories: 1) PCR-based DNA library preparation and sequenced on either the Illumina HiSeq 2000 (2 × 90 bp paired-end reads) or HiSeq 2500 (2 × 126 bp paired-end reads) platforms; 2) PCR-based library preparation and sequenced on the Illumina HiSeq X platform, or 3) PCR-free library preparation and sequenced on the Illumina HiSeq X platform. All samples were aligned to the GRCh38/hg38 reference genome using BWA-mem51. Full details on the MSSNG, 1000G, and SSC alignment pipelines can be obtained from the websites of MSSNG, 1000G and SSC (via Globus; https://www.globus.org), respectively. The study protocol was approved by The Hospital for Sick Children’s Research Ethics Board (REB). Informed consent was obtained from all participants through the recruitment sites.
To verify that tandem repeat expansions of interest were rare in the general population, we used genome sequencing data from healthy, unrelated population controls from two additional cohorts: 646 samples from the Genotype-Tissue Expression (GTEx) dataset32 and 966 genomes from the Mayo Clinic Biobank33. All of these samples were sequenced on the Illumina HiSeq X platform, and the sequencing data were aligned to the GRCh38/hg38 reference genome.
Genome-wide tandem repeat identification
To perform reference genome-agnostic detection of tandem repeats, we used ExpansionHunter Denovo (EHdn) (https://github.com/Illumina/ExpansionHunterDenovo)30, which uses anchored in-repeat reads (paired reads in which the first read maps to a repetitive region and the second “anchor” read maps to an adjacent non-repetitive region) to estimate the size and location of genomic tandem repeats. EHdn v0.7.0 was run on each sample using default parameters. The per-sample output files were combined using the combine_counts.py script provided with EHdn. The final set of regions was generated using the compare_anchored_irrs.py script with the parameter minCount=2, thus retaining only regions for which at least one sample had C >= 2, where C = A * 40 / R, A is the raw count of anchored in-repeat reads for that region, and R is the average read depth of the sample calculated by EHdn.
Technical variability characterization
To determine whether the number of tandem repeats detected by EHdn in a given sample was affected by systematic biases in the sequencing data, we plotted the distributions of the raw number of EHdn calls (specifically, the number of regions in the RegionsWithIrrAnchors field of each per-sample JSON output file) for each combination of cohort (MSSNG, SSC, or 1000G), DNA library preparation method (PCR-based or PCR-free), and sequencing platform (HiSeq 2000/2500, HiSeq X, or NovaSeq).
Sample quality control
We determined the ancestry of the MSSNG, SSC, and 1000G samples using data from 1,752 unrelated samples from the 1000 Genomes Project as the reference. The reference samples were genotyped on Illumina HumanOmni2.5–4v1-B and Illumina HumanOmni25M-8v1–1_B chips (http://www.tcag.ca/tools/1000genomes.html). We extracted the genotypes for a set of 265,236 autosomal single nucleotide polymorphisms (SNPs) and 23,171 chromosome X SNPs for the three cohorts with bcftools v1.6 using the joint-genotyped variant call format (VCF) files as input. For each cohort, the data were sorted, decomposed, normalized and SNVs retained for further processing. We formatted the resulting VCFs using PLINK v1.9.b3.4252. We removed SNPs with genotyping rate <99% in the reference set for any of the three cohorts. We calculated PLINK identity-by-descent estimates for all pairs of individuals in the three cohorts using the autosomal SNPs to check for pedigree and Mendelian errors within each set and sample duplications between sets. We used SNPs on the X chromosome to determine sex and flagged samples where the reported sex and inferred sex were different. Linkage disequilibrium-based pruning of the autosomal SNPs yielded 41,720 SNPs, which we used to estimate model-based ancestry using the program ADMIXTURE53, and projected the three cohorts on the population structure learned from the reference panel.
ExpansionHunter Denovo validation
To assess the accuracy of EHdn, we used it to detect tandem repeats in the HuRef genome31 and then determined the proportion that could be corroborated by an orthogonal method. Specifically, we aligned Illumina HiSeq X reads derived from HuRef blood (NCBI sequence read archive accession number SRR9046649) to the GRCh38/hg38 reference assembly and ran EHdn as described above. The orthogonal comparison method involved two sources of data: 1) tandem repeats in the human reference genome, derived from Tandem Repeats Finder (TRF)35, and 2) insertions and deletions in the HuRef genome detected from Pacific Biosciences single molecule, real-time long-read sequencing data, derived by de novo assembly using Canu v1.654 and variant detection using AsmVar v0.0.0 (2013–10-18) (https://github.com/bioinformatics-centre/AsmVar). An EHdn region was considered validated if the sum of the size of the largest overlapping TRF region and the size of overlapping Canu/AsmVar insertions/deletions (positive for insertions and negative for deletions) was at least 150 bp (the minimum size detectable by EHdn). A Canu/AsmVar insertion/deletion was considered to overlap the TRF region if it overlapped the region itself or 100 bp on either side. For example, suppose that a hypothetical EHdn region overlapped a TRF region of size 100 bp, where Canu/AsmVar detected a 70 bp insertion inside the TRF region. The total tandem repeat size would be 170 bp, thereby validating the EHdn call. Conversely, if the TRF region was 160 bp along with a 20 bp Canu/AsmVar deletion, then the total size is 140 bp, and therefore the EHdn region was not be considered validated. If the EHdn region did not overlap a TRF region, but there was a Canu/AsmVar insertion ≥ 150 bp within the EHdn region, then the EHdn region was considered validated.
Confirmation of tandem repeats
To support the accuracy of EHdn-predicted tandem repeat sizes, we genotyped the loci listed in Table 1 using ExpansionHunter v3.0.247,48, which estimates allele-specific tandem repeat sizes for each genomic coordinate and motif supplied by the user with high accuracy (precision=0.91, recall=0.99)48. We identified all unique EHdn-detected tandem repeats (each having a different motif) overlapping each locus. To determine more precise coordinates for input to ExpansionHunter, we identified coordinates from TRF that overlapped the locus. For each combination of TRF coordinates and EHdn motif, we used ExpansionHunter to estimate motif-specific (as detected by EHdn) tandem repeat sizes for the samples involved. We then calculated the Spearman correlation coefficient and p value between the EHdn-predicted tandem repeat sizes and the size estimated by ExpansionHunter (defined as either the size of the longest allele or the sum of the two allele sizes), aggregated over all of the EHdn-detected motifs for that locus (Supplementary Table 6). We also performed a manual inspection for the presence of tandem repeat expansions and the corresponding motif by inspecting reads from the BAM file for tandem repeats in Table 1 found to be expanded by EHdn (Extended Data Fig. 9).
Detection of tandem repeat expansions
We defined a tandem repeat expansion as a tandem repeat that is much larger than what is observed in the population. Here, we applied density-based spatial clustering of applications with noise (DBSCAN) to identify tandem repeat expansions55. DBSCAN is a non-parametric clustering algorithm that defines a cluster based on the minimum number of data points (minPts) reachable to each other by a maximum distance (ε). Data points not reachable by the clusters are classified as noisy data or outliers if they have a value of a particular feature (e.g., tandem repeat size) higher than those of cluster members. The DBSCAN parameter minPts was chosen to be -log2(n) ≈ 15, where n is the number of samples. For the parameter ε, a value of 2 × Mo(Xi) was chosen, where Mo is the mode and Xi is a vector of tandem repeat sizes for repeat i. This value was selected because it resulted in both a reasonable number of outliers and good agreement between outliers detected from EHdn and outliers detected in corresponding loci from ExpansionHunter (Supplementary Fig. 5), although other values also gave OR > 1 for our main statistical comparison (Supplementary Table 7). While our definition of an expansion is a conservative measure, it should be noted that there are tandem repeat-associated diseases for which one or two additional repeat units leads to disease. Such changes will be missed by EHdn. For a tandem repeat to be detected by EHdn, it must be larger than the sequence read length (e.g., > 150 bp). As a result, samples that did not meet this size minimum for a given region were left without EHdn’s size estimation. Similarly, DBSCAN might fail to detect outliers when only a few samples have genotype data. We therefore simulated the read depth-normalized count of anchored in-repeat reads for such samples by assigning them a normal distribution with a mean of 1, a standard deviation of 0.25, and a maximum of 2. As a result, a minimum of 2 was required for a tandem repeat to be identified as an expansion. No individual had an extreme number of rare tandem repeat expansions (Supplementary Fig. 4).
Validation of tandem repeat expansions
The validation of the tandem repeat length estimated by ExpansionHunter or EHdn was done by fragment analysis with FAM-labelled primers and capillary electrophoresis. We performed PCR with Expand Long Template PCR System™ (Roche) and added dimethylsulfoxide to achieve a final concentration of 5-10%, depending on the GC content of the target region. We performed capillary electrophoresis with Applied Biosystems’ 3730xl™/3130™ capillary sequencers with GeneScan 500LIZ™ size markers. For the CGG repeat in LINGO3, we added betaine (final concentration: 2 M) in the PCR reaction mixtures and determined the tandem repeat size by Sanger sequencing of PCR products. For samples that appeared to be homozygous for the tandem repeat length, we validated the presence of expanded tandem repeats by repeat-primed PCR (RP-PCR) and/or Southern blot. For RP-PCR, we used the following repeat-priming primers with the tail sequence of 5’- TACGCATCCCAGTTTGAGACGC-3’: CTG-repeat-binding primer, 5’-TACGCATCCCAGTTTGAGACGC AGCAGCAGCAGCAGCA-3’; CAG-repeat-binding primer, 5’-TACGCATCCCAGTTTGAGACGC TGCTGCTGCTGCTGCT-3’; CAGG-repeat-binding primer, 5’-TACGCATCCGAGTTTGAGACGC CTGCCTGCCTGCCTG-3’; and CCG-repeat binding primer, 5’- TACGCATCCCAGTTTGAGACGC GGCGGCGGCGG -3’.
We performed Southern blots to determine the sizes of the CGG repeat in LINGO3 and the CTG repeat in DMPK with selected restriction endonucleases to digest genomic DNA as denoted in Fig. 1f and Fig. 2g. We resolved the DNA fragments on agarose gels, transferred them to membranes and detected them by hybridizing radioactive probes specific to DNA sequences adjacent to the tandem repeat tracts. We produced the probes by PCR amplification of the targeted genomic DNA with 32P-dCTP and hybridization which permits detection of repeat length heterogeneity. PCR primers for LINGO3 were 5’-GTGTCCGAGGACCTCCTGT-3’ and 5’-CTCTGAGGGCCACATAAGGA-3’ and for DMPK were 5’-CGAGTCCCAGGAGCCAATCA-3’and 5’-CGGGCACTCAGTCTTCCAAC-3’.
For tandem repeats that were detected with multiple different motifs at the same repeat-containing regions (e.g., CACNB1 and FXN) (Extended Data Fig. 9), we performed Sanger sequencing on the PCR-amplified alleles after gel extraction to confirm the presence of the reported motifs. PCR primers for CACNB1 were 5’-CTTCCTACCGATTTCCCCTC-3’ and 5’-CTGATTGACTTCCCACCCTT-3’ and for FXN were 5’-TATTTGTGTTGCTCTCCGGAG-3’ and 5’-ATAGTGCACAGAAGCCAAGT-3’.
Burden analysis
To compare the frequency of rare tandem repeat expansions (<0.1% population frequency) between individuals with and without ASD, we performed a logistic regression analysis by regressing the number of rare tandem repeat expansions on the affected status (unaffected=0, affected=1). We avoided sex bias by performing the test only on autosomal regions, as well as using sex as a covariate for correction of the regression model. We also performed a burden test for different functional elements (e.g., exons and introns), as well as a gene set burden test. We further accounted for the bias in number of rare tandem repeat expansions per subject in genic, functional, and gene set burden tests by covarying the number of rare tandem repeat expansions found in intergenic regions. For the functional burden test, we separated the genome (RefSeq hg38) into different functional elements, i.e., upstream (1 kb upstream of transcription start sites), 5’UTR, exon, core splice site, intron, 3’UTR, and downstream (1 kb downstream of transcription termination sites). We tested for the number of rare tandem repeat expansions impacting each functional element. If any rare tandem repeat expansion impacted more than one functional element, we prioritized the effects based on their impact on the corresponding genes predicted by ANNOVAR (October, 2019)56. We also tested these different functional elements all together as a genic burden signal. For the gene set burden test, we obtained 32 functional gene sets previously used to study CNV and SNV enrichment in ASD, including genes relevant to neuronal functions, synaptic components, or genes with homologues in mouse genes grouped by organ system (Supplementary Table 8). We estimated family-wise error rate (FWER) to adjust for multiple comparisons. Finally, we identified top associated expansions as those impacting genes in the top gene sets (FWER < 0.2) and that are more frequent in ASD-affected individuals than unaffected siblings. The burden of top associated expansions were again compared between affected and unaffected individuals for enrichment in ASD gene lists. We used three ASD gene lists: ASD10250, SFARI Gene40, and MSSNGASD2 (including recessive ASD risk genes and other ASD risk genes that are related to neurodevelopmental disorders).
Statistical comparisons of means
We performed non-parametric Wilcoxon signed-rank tests (one-sided) to compare means between two datasets. These included testing the hypotheses of (i) shorter distances to transcription start site (TSS) or splice junction for rare tandem repeat expansions than two other sets of repeats separately (known simple sequence repeats and all EHdn-detected tandem repeats), (ii) lower phenotype-related test scores for samples with than without rare tandem repeat expansions, and (iii) higher number of rare tandem repeat expansions found in affected versus unaffected children. For (i), we only included tandem repeats smaller than 10 kb in size, within 10 kb of TSS or splice junction. The distance was calculated from the midpoint of a tandem repeat region to the nearest TSS or splice junction. Only tandem repeats overlapping introns were included for the test of the distance from the splice junction. For (ii), we compared the test scores of the two phenotypes (Vineland Adaptive Behavior standard score to measure adaptive function, and IQ full scale standard score to measure cognitive ability) available in MSSNG samples with (N=833) and without (N=2,101) rare tandem repeat expansions. This is to test if individuals with rare tandem repeat expansions exhibit reduced adaptive function or cognitive ability, as we previously showed for carriers of rare pathogenic SNVs or CNVs2. Samples included were mutually exclusive to each other and there were no replicates (randomization not applicable).
Genotyping of known disease-causing loci
To identify differences between ASD-affected individuals and their unaffected siblings in terms of known disease-causing tandem repeat loci, we used ExpansionHunter to genotype a set of such loci compiled from the literature (Supplementary Table 9). For each locus, we identified individuals for which the larger allele exceeded the known disease-causing threshold, and then used Fisher’s exact test to determine whether ASD-affected individuals were overrepresented compared with unaffected siblings. For X-linked loci, this test was performed only in males.
Enrichment in common variant risk
For genes in which tandem repeat expansions were enriched in ASD-affected individuals, we used MAGMA v1.07b57 as described previously50 to determine whether they were enriched in common variant risk for ASD and correlated traits. Specifically, we compared our gene set against genome-wide association studies for ASD23, schizophrenia58, attention deficit hyperactivity disorder59, educational attainment60, and (as a negative control) height61.
Detection of de novo variants
MSSNG de novo variants were defined as described previously2. The variants were annotated using an ANNOVAR-based custom pipeline. Loss-of-function variants (stop-gain and frameshift variants) were retained. De novo variants for SSC were obtained from a previously-published dataset19. The variants were annotated using the ANNOVAR-based custom pipeline and loss-of-function variants retained. De novo CNVs were detected using a pipeline involving ERDS62 and CNVnator63 as previously described41. CNVs detected in the child but not in the parents by either ERDS or CNVnator were tagged as de novo. All the de novo deletions were retained for the analysis. We performed Fisher’s exact test to compare the odds that affected individuals having de novo variants (genic deletions or loss-of-function SNVs/indels) would also have a rare tandem repeat expansion within the top associated gene sets.
Transmission tests
We performed transmission tests in affected and unaffected individuals in SSC and in affected individuals in MSSNG, both separately and combined. We defined large repeat transmission events as when a repeat that was above the 99th percentile according to length in a parent was transmitted to the child, with the child’s repeat length also being at least in the 99th length percentile. Non-transmission events were defined as when a tandem repeat with a length above the 99th length percentile was found in the parent but not in the child. The transmission test was done by comparing the number of the two events involved with a particular set of tandem repeats (e.g., different genic regions or gene sets) against the numbers of such events of all other large tandem repeats. We applied Fisher’s exact test to test for imbalanced transmission of large tandem repeats in different genic regions, functional elements, and gene sets.
Mechanisms of rare expansions
We investigated the potential gene-regulating mechanisms of rare tandem repeat expansions by retrieving the target locations of expanded tandem repeats near TSSs and splice junctions - the location within 500 bp from TSS and 1,500 bp from donor splice junction where rare tandem repeat expansions were more frequently found than the known short sequence repeats (Fig. 2d–e). We compared the gnomAD64 o/e upper bound values (a measure of genetic constraint) between genes that were impacted by the rare tandem repeat expansions at target locations against all other genes. The Wilcoxon signed-rank test (one sided) was applied to test TSS and donor splice junction separately. Additional analyses and findings can be found in Supplementary Notes, Supplementary Figures 1–9 and Supplementary Tables 11–15.
Extended Data
Extended Data Figure 1 |. Study design.
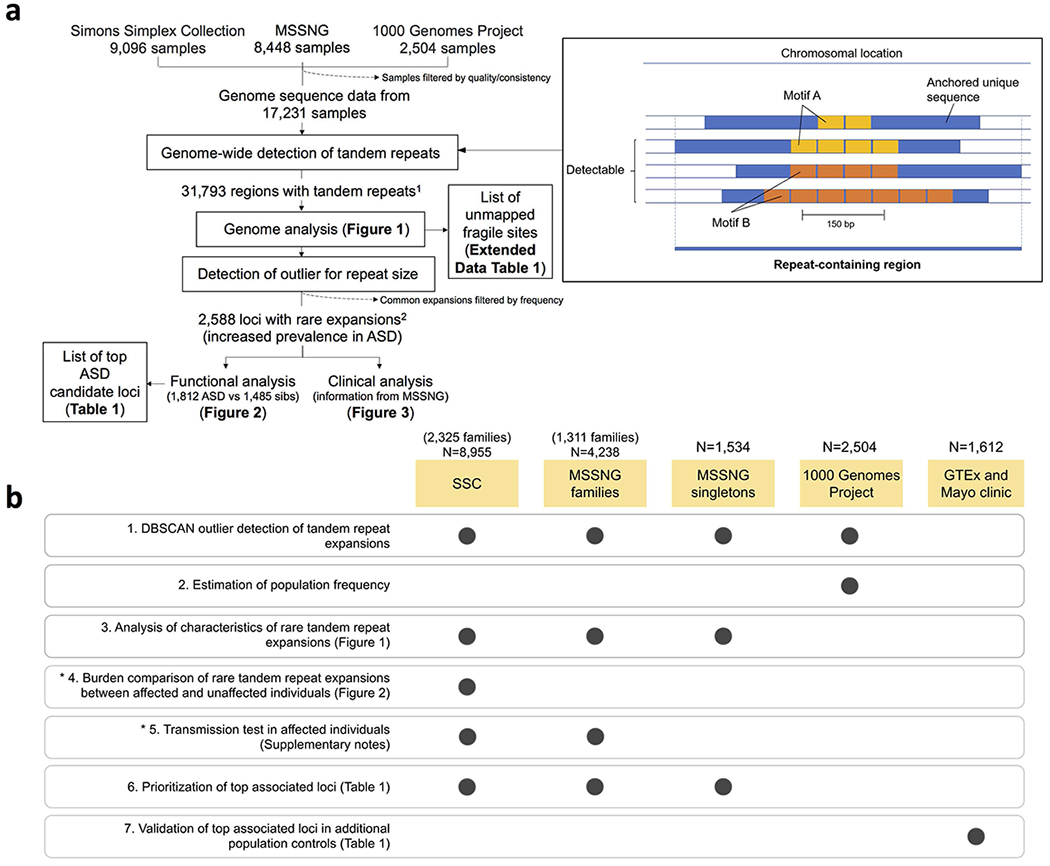
a, Schematic workflow of the tandem repeat detection and analyses. 1Tandem repeats here are defined as those with 2–20 bp repeat motifs that span at least 150 bp. 2Rare expansions here are defined as tandem repeat expansions that are outliers according to size and occur in <0.1% of population controls from the 1000 Genomes Project. Note that ExpansionHunter Denovo only approximates the size and location of a given tandem repeat; thus, we use the term “region” to refer to a genomic segment detected in this way, and reserve “location” or “locus” for sites that have been more precisely mapped. b, Genome sequencing cohorts used for each analysis performed in this study. Numbers above each cohort represent the number of samples remaining after curation (Supplementary Notes).
Extended Data Figure 2 |. Distribution of the number of tandem repeats detected by ExpansionHunter Denovo.
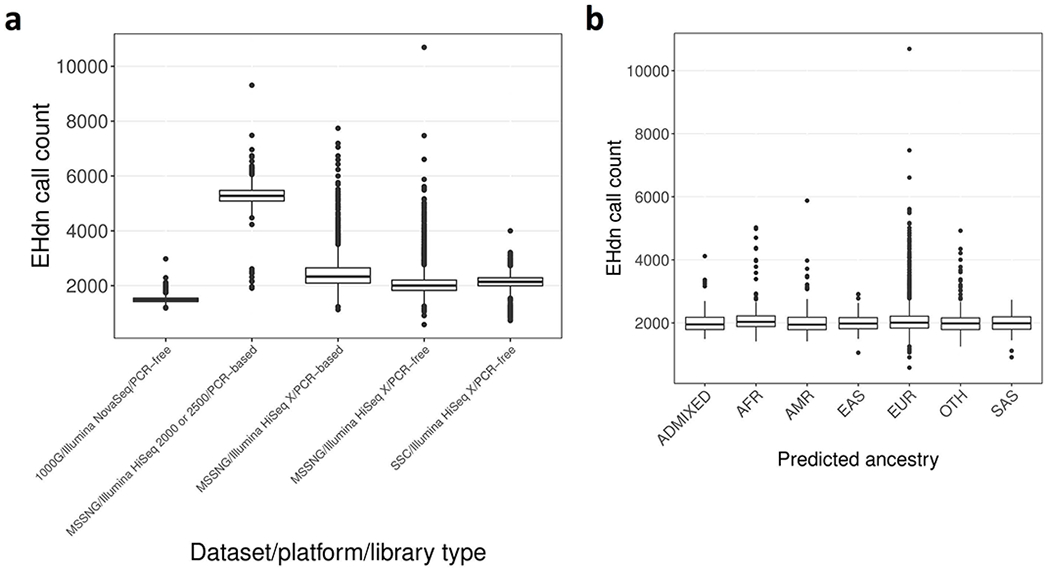
The number of tandem repeats detected by ExpansionHunter Denovo in a given sample is stratified by: a, cohort, sequencing platform, and DNA library preparation method (N=2,504, 594, 1,220, 6,634, and 9,096 for 1000G/Illumina NovaSeq/PCR-free, MSSNG/Illumina HiSeq 2000 or 2500/PCR-based, MSSNG/Illumina HiSeq X/PCR-based, MSSNG/Illumina HiSeq X/PCR-free, and SSC/Illumina HiSeq X/PCR-free, respectively), and b, predicted ancestry for samples in the “MSSNG/Illumina HiSeq X/PCR-free” category (N=157, 301, 247, 287, 4,841, 687, and 114 for ADMIXED, AFR, AMR, EAS, EUR, OTH, and SAS, respectively). Ancestry designations were derived from the 1000 Genomes “super populations” (https://www.internationalgenome.org/category/population): AFR, African; AMR, Admixed American; EAS, East Asian; EUR, European; OTH, other; SAS, South Asian. The centre of each boxplot indicates the median, the lower and upper hinges correspond to the first and third quartiles, and the minima and maxima are 1.5× the inter-quartile range below or above the median, respectively.
Extended Data Figure 3 |. Tandem repeat detection quality control.
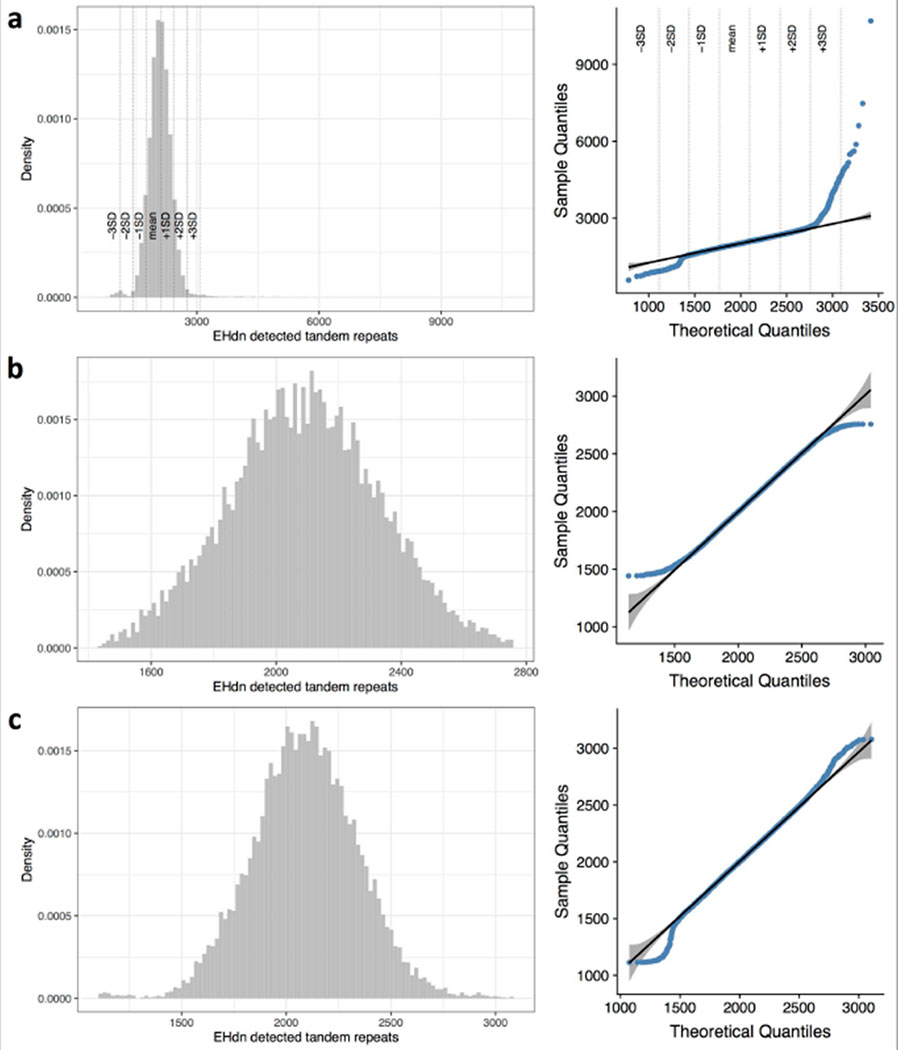
Histogram and normal QQ-plot of the number of tandem repeats detected by ExpansionHunter Denovo for a, all samples, b, samples for which the number of tandem repeats was within mean ± 2*SD, and c, samples for which the number of tandem repeats was within mean ± 3*SD. Of the 3 distributions, c is closest to the normal distribution.
Extended Data Figure 4 |.
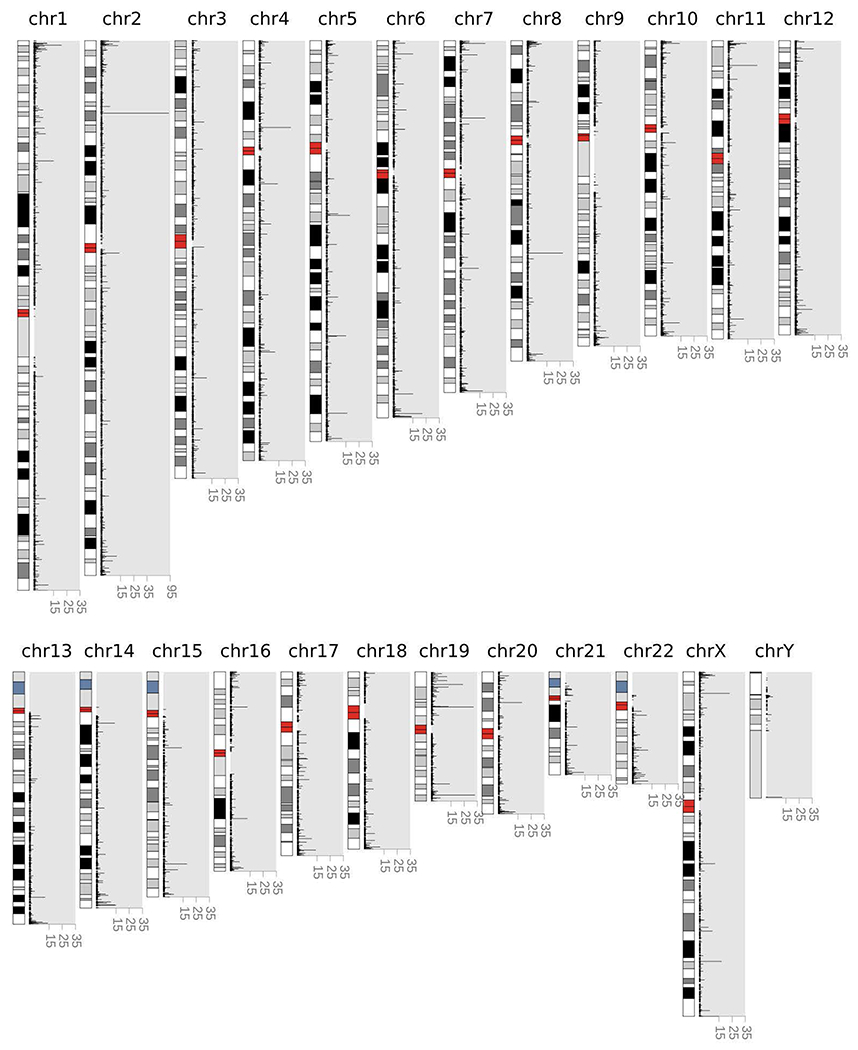
Number of unique motifs (y-axis) in each repeat-containing region (x-axis).
Extended Data Figure 5 |. Distributions of GnomAD gene constraints.
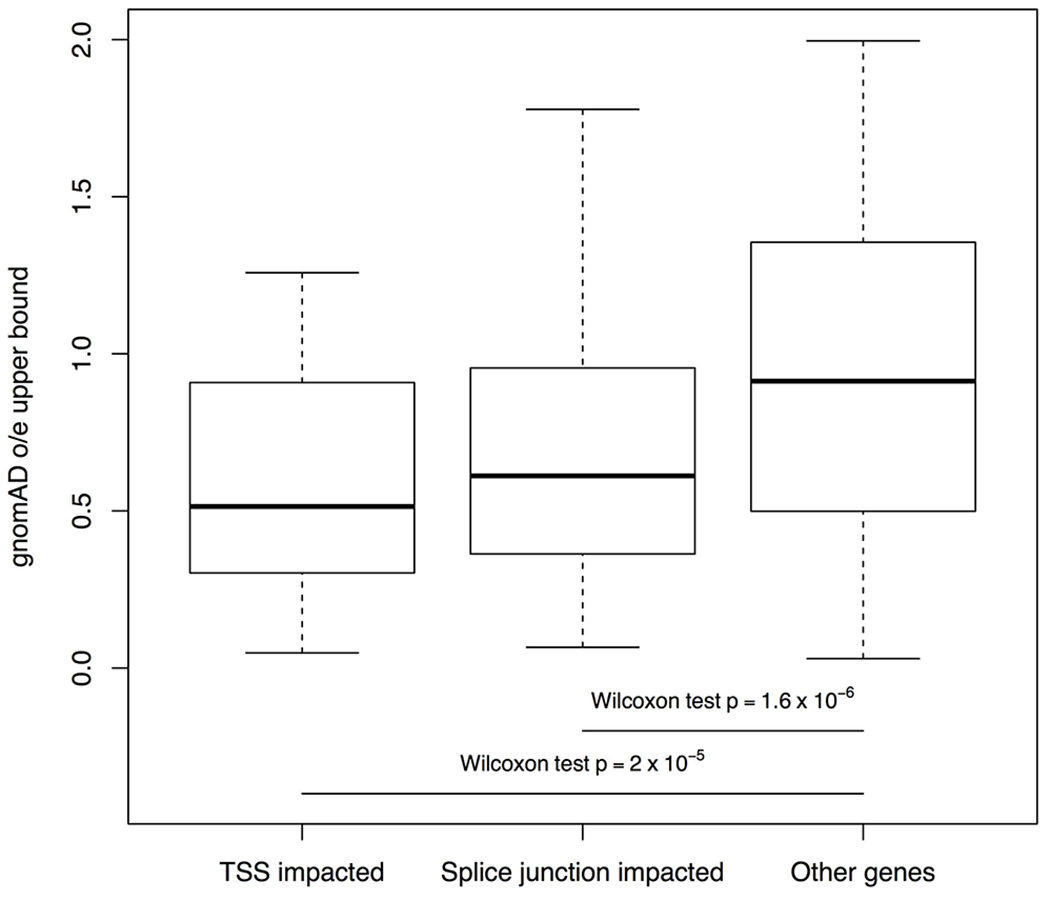
The distributions of GnomAD observed/expected (o/e) upper bounds are shown for genes with rare tandem repeat expansions near transcription start sites (TSS, N=32 genes) and splice junctions (N=80 genes), compared to other genes (N=19,567 genes) (one-sided Wilcoxon rank sum test). The minima and maxima indicate 3×inter-quartile range-deviated o/e upper bounds from the median, and the centre indicates the median of the o/e upper bounds.
Extended Data Figure 6 |. Transmission tests.
a-c, Odds ratios calculated as ratios of the transmission events of genic large tandem repeats and those in intergenic regions. Only affected individuals with European ancestry in a, SSC (N=1,808), b, MSSNG (N=2,010) and c, both SSC and MSSNG (N=3,818) were considered. d-f, Odds ratios calculated as ratios of the transmission events of large tandem repeats (99th percentile of length distribution) in a particular functional element to those in intergenic regions. Only affected individuals of European ancestry in d, SSC, e, MSSNG and f, both SSC and MSSNG were considered. Fisher’s exact test was applied to estimate the odds ratios and 95% confidence intervals indicated by error bars.
Extended Data Figure 7 |. Transmission gene set enrichment.
Odds ratios calculated as ratios of the transmission events of large tandem repeats (99th percentile of length distribution) in particular gene sets to those in intergenic regions. Only affected individuals of European ancestry in a, SSC (N=1,808), b, MSSNG (N=2,010), and c, both SSC and MSSNG (N=3,818) were considered. Gene sets that were enriched from burden analysis of rare tandem repeat expansions between ASD-affected children and unaffected siblings in SSC are labelled. Red bars indicate significant enrichment in ASD-affected individuals (family-wise error rate < 25%). Fisher’s exact test was applied to estimate the odds ratios and 95% confidence intervals indicated by error bars.
Extended Data Figure 8 |. Methods for sizing of the CTG repeat in DMPK.
a, While short CTG repeats were correctly sized by ExpansionHunter (the results were perfectly matched with fragment analysis), slight discrepancies were observed in the estimates for premutation alleles between ExpansionHunter and PCR-based fragment analysis. Note that the length of the premutation CTG repeats (42 CTGs) was close to the read length of the HiSeq X platform (150 bp). b, Predictions of the presence of longer CTG repeats were validated by repeat-primed PCR, although the estimated size by ExpansionHunter was shown to be an underestimate (the saw-tooth pattern of repeat-primed PCR extended longer than the predicted size). Repeat-primed PCR experiments were consistently reproduced at least three times for the large expansions. Repeat sizing experiments of PCR-amplifiable samples were consistently reproduced at least twice.
Extended Data Figure 9 |. Validation of tandem repeats detected by EHdn.

a and e, Integrative Genomics Viewer read pile-up showing the reads aligning to the loci in CACNB1 and FXN in two families where tandem repeat expansions were detected in the child (bottom panels). In both families, the expansion is transmitted from the mother to the child (samples highlighted in red). b and f, Image of the gel-electrophoresis showing two bands corresponding to the expanded and unexpanded allele in the mother and child. The father has only the unexpanded allele. Results from PCR and gel electrophoresis were consistently reproduced at least twice for CACNB1 and FXN loci (see Supplementary Figures). c and g, Chromatogram of the Sanger sequencing of the expanded non-reference tandem repeat in the mother. d and h, Chromatogram of the Sanger sequencing of the expanded non-reference tandem repeat in the child. Sanger sequencing was performed using the DNA of the expanded alleles extracted from the gels.
Extended Data Table 1 |.
Molecularly unmapped rare folate-sensitive fragile sites overlapped with GC-rich tandem repeats.
| Site | Location | Motif | Coordinate | Gene(s) |
|---|---|---|---|---|
| FRA1M | 1p21.3 | CCG | chr1:94418144-94418774 | ABCD3 |
|
| ||||
| FRA2L | 2p11.2 | CCG | chr2:86914283-86915185 | RGPD1 |
|
| ||||
| FRA2B | 2q13 | CCG | chr2:111120478-111121517 | BCL2L11 |
|
| ||||
| FRA2K | 2q22.3 | CCG | chr2:147844114-147844677 | ACVR2A |
|
| ||||
| FRA5G | 5q35 | CCG | chr5:177553859-177554905 | FAM193B |
|
| ||||
| FRA8A | 8q22.3 | CCCGCCGCCGCCGCGCG | chr8:101205417-101205854 | ZNF706 |
| CCG | chr8:103298253-103299692 | BAALC-AS1/FZD6 | ||
| CCG | chr8:104588661-104589187 | LRP12 | ||
|
| ||||
| FRA12D | 12q24.13 | CCG | chr12:112381861-112382745 | HECTD4 |
|
| ||||
| FRA19B | 19p13 | CCCCGCG | chr19:892485-893322 | MED16 |
| CCG | chr19:2307584-2308627 | LINGO3 | ||
| CCG | chr19:2311527-2311819 | |||
| CCCCCCCCCCCCCCCCCCCG | chr19:2436121-2437305 | LMNB2 | ||
| CCG | chr19:10870902-10872011 | CHARM1 | ||
| CCG | chr19:15332062-15332900 | BRD4 | ||
| CCG | chr19:14495496-14496620 | GIPC1 | ||
|
| ||||
| FRA20A | 20p11.23 | CCG | chr20:20678904-20679127 | RALGAPA2 |
| CCG | chr20:20712192-20712984 | |||
| CCG | chr20:20714199-20714410 | |||
|
| ||||
| FRA22A | 22q13 | CCG | chr22:38316846-38317855 | CSNK1E |
Supplementary Material
Acknowledgements
We thank The Centre for Applied Genomics, especially Barbara Kellam, Sylvia Lamoureux, Thomas Nalpathamkalam, Rohan Patel, Wilson Sung, and Dr. Zhuozhi Wang for their analytical and technical support. We thank Dr. Grace K.W. Wong, Dr. Susan Walker, and Dr. Andrew Paterson for useful discussions, and Dr. Janet Buchanan for manuscript editing. The authors wish to acknowledge the resources of MSSNG (www.mss.ng), Autism Speaks, and The Centre for Applied Genomics at The Hospital for Sick Children, Toronto, Canada. We also thank the participating families for their time and contributions to this database, as well as the generosity of the donors who supported this program. We thank Morgan Quirbach and Victoria Seifer who manage MSSNG and AGRE programs. We are grateful to all of the families at the participating Simons Simplex Collection (SSC) sites, as well as the principal investigators (A. Beaudet, R. Bernier, J. Constantino, E. Cook, E. Fombonne, D. Geschwind, R. Goin-Kochel, E. Hanson, D. Grice, A. Klin, D. Ledbetter, C. Lord, C. Martin, D. Martin, R. Maxim, J. Miles, O. Ousley, K. Pelphrey, B. Peterson, J. Piggot, C. Saulnier, M. State, W. Stone, J. Sutcliffe, C. Walsh, Z. Warren, E. Wijsman). We appreciate obtaining access to genome sequencing data on SFARI Base. Approved researchers can obtain the SSC population dataset described in this study (https://www.sfari.org/resource/simons-simplex-collection/) by applying at https://base.sfari.org. This work was supported (to R.K.C.Y.) by The Hospital for Sick Children’s Research Institute, SickKids Catalyst Scholar in Genetics, NARSAD Young Investigator award, Dataset Analysis Grant from Autism Speaks, Accelerator Grant from the University of Toronto McLaughlin Centre, and the Nancy E.T. Fahrner Award. B. Trost was funded by the Canadian Institutes for Health Research Banting Postdoctoral Fellowship and the Canadian Open Neuroscience Platform Research Scholar Award. C.M.N. and B.A.M. were supported by the Restracomp Award from The Hospital for Sick Children. M.E.S.L. is funded by an Investigator Grant Award Program (IGAP) salary award from BC Children’s Hospital Research Institute and a Genome British Columbia Strategic Initiative Grant (B22ITG). D.G.A. is funded by a National Institute of Mental Health Grant (1R01MH103371). Work from E.A. is funded by the Ontario Brain Institute (OBI)/Province of Ontario Neurodevelopmental Disorders (POND) Network and the Dr. Stuart D. Sims Chair in Autism. L.Z. is funded by the Stollery Children’s Hospital Foundation Chair in Autism Research. P.S. is funded by the Patsy and Jamie Anderson Chair in Child and Youth Mental Health. C.E.P. holds the Canada Research Chair in Disease-Associated Genome Instability. S.W.S. is funded by the GlaxoSmithKline Chair in Genome Sciences at the University of Toronto and The Hospital for Sick Children, The Hospital for Sick Children Foundation, and the Canada Foundation for Innovation (CFI).
Competing interests
E.D. and M.A.E. are or were employees of Illumina, Inc., a public company that develops and markets systems for genetic analysis. D.G.A is on the Scientific Advisory Boards of Stemina Biomarkers Discovery, Inc. and Axial Therapeutics. E.A. has served as a consultant to Roche and Quadrant, has received grant funding from Roche, has received royalties from APPI and Springer, has received in-kind support from AMO Pharmaceuticals, and has received editorial honoraria from Wiley. D.G. is employed by Verily. A.K.S. has a consulting role for Amgen, Bristol-Myers Squibb, Celgene, Ionis, Janssen, Oncopeptides, Ono, Roche, Seattle Genetics, and Takeda and has received research funding from Amgen, Celgene, and Janssen. S.W.S. serves on the Scientific Advisory Committees of Population Bio and Deep Genomics; intellectual property originating from his research and held at The Hospital for Sick Children is licensed to Lineagen, and separately Athena Diagnostics. The strategies for genome-wide analysis and interpretation of tandem DNA repeats from genome sequence have been filed under reference H8313086USP (US provisional application number 62/951671) with the US Patent and Trademark Office.
Footnotes
Data availability
Access to the MSSNG and SSC genome sequencing data can be obtained by completing data access agreements (https://research.mss.ng and https://www.sfari.org/resource/sfari-base, respectively). The 1000G genome sequencing data are publicly available via Amazon Web Services (s3://1000genomes/1000G_2504_high_coverage/data).
Code availability
Code used in this manuscript is available at https://github.com/bjtrost/tandem-repeat-expansions-in-ASD.
References
- 1.López Castel A, Cleary JD & Pearson CE Repeat instability as the basis for human diseases and as a potential target for therapy. Nat Rev Mol Cell Biol 11, 165–70 (2010). [DOI] [PubMed] [Google Scholar]
- 2.Yuen RKC et al. Whole genome sequencing resource identifies 18 new candidate genes for autism spectrum disorder. Nat Neurosci 20, 602–11 (2017). [DOI] [PMC free article] [PubMed] [Google Scholar]
- 3.Fischbach GD & Lord C The Simons Simplex Collection: a resource for identification of autism genetic risk factors. Neuron 68, 192–5 (2010). [DOI] [PubMed] [Google Scholar]
- 4.1000 Genomes Project Consortium. A global reference for human genetic variation. Nature 526, 68–74 (2015). [DOI] [PMC free article] [PubMed] [Google Scholar]
- 5.Bamshad MJ, Nickerson DA & Chong JX Mendelian gene discovery: fast and furious with no end in sight. Am J Hum Genet 105, 448–455 (2019). [DOI] [PMC free article] [PubMed] [Google Scholar]
- 6.Manolio TA et al. Finding the missing heritability of complex diseases. Nature 461, 747–53 (2009). [DOI] [PMC free article] [PubMed] [Google Scholar]
- 7.Vorstman JAS et al. Autism genetics: opportunities and challenges for clinical translation. Nat Rev Genet 18, 362–376 (2017). [DOI] [PubMed] [Google Scholar]
- 8.Ozonoff S et al. Recurrence risk for autism spectrum disorders: a Baby Siblings Research Consortium study. Pediatrics 128, e488–95 (2011). [DOI] [PMC free article] [PubMed] [Google Scholar]
- 9.Risch N et al. Familial recurrence of autism spectrum disorder: evaluating genetic and environmental contributions. Am J Psychiatry 171, 1206–13 (2014). [DOI] [PubMed] [Google Scholar]
- 10.Fernandez BA & Scherer SW Syndromic autism spectrum disorders: moving from a clinically defined to a molecularly defined approach. Dialogues Clin Neurosci 19, 353–371 (2017). [DOI] [PMC free article] [PubMed] [Google Scholar]
- 11.De Rubeis S et al. Synaptic, transcriptional and chromatin genes disrupted in autism. Nature 515, 209–15 (2014). [DOI] [PMC free article] [PubMed] [Google Scholar]
- 12.Iossifov I et al. The contribution of de novo coding mutations to autism spectrum disorder. Nature 515, 216–21 (2014). [DOI] [PMC free article] [PubMed] [Google Scholar]
- 13.Sanders SJ et al. Insights into autism spectrum disorder genomic architecture and biology from 71 risk loci. Neuron 87, 1215–33 (2015). [DOI] [PMC free article] [PubMed] [Google Scholar]
- 14.Yuen RKC et al. Genome-wide characteristics of de novo mutations in autism. NPJ Genom Med 1, 160271–1602710 (2016). [DOI] [PMC free article] [PubMed] [Google Scholar]
- 15.Marshall CR et al. Structural variation of chromosomes in autism spectrum disorder. Am J Hum Genet 82, 477–488 (2008). [DOI] [PMC free article] [PubMed] [Google Scholar]
- 16.Brandler WM et al. Paternally inherited cis-regulatory structural variants are associated with autism. Science 360, 327–331 (2018). [DOI] [PMC free article] [PubMed] [Google Scholar]
- 17.Bourgeron T From the genetic architecture to synaptic plasticity in autism spectrum disorder. Nat Rev Neurosci 16, 551–63 (2015). [DOI] [PubMed] [Google Scholar]
- 18.Tammimies K et al. Molecular diagnostic yield of chromosomal microarray analysis and whole-exome sequencing in children with autism spectrum disorder. JAMA 314, 895–903 (2015). [DOI] [PubMed] [Google Scholar]
- 19.An J-Y et al. Genome-wide de novo risk score implicates promoter variation in autism spectrum disorder. Science 362, eaat6576 (2018). [DOI] [PMC free article] [PubMed] [Google Scholar]
- 20.Jiang Y et al. Detection of clinically relevant genetic variants in autism spectrum disorder by whole-genome sequencing. Am J Hum Genet 93, 249–63 (2013). [DOI] [PMC free article] [PubMed] [Google Scholar]
- 21.Werling DM et al. An analytical framework for whole-genome sequence association studies and its implications for autism spectrum disorder. Nat Genet 50, 727–736 (2018). [DOI] [PMC free article] [PubMed] [Google Scholar]
- 22.Gaugler T et al. Most genetic risk for autism resides with common variation. Nat Genet 46, 881–5 (2014). [DOI] [PMC free article] [PubMed] [Google Scholar]
- 23.Grove J et al. Identification of common genetic risk variants for autism spectrum disorder. Nat Genet 51, 431–444 (2019). [DOI] [PMC free article] [PubMed] [Google Scholar]
- 24.Hannan AJ Tandem repeat polymorphisms: modulators of disease susceptibility and candidates for ‘missing heritability’. Trends Genet 26, 59–65 (2010). [DOI] [PubMed] [Google Scholar]
- 25.Bahlo M et al. Recent advances in the detection of repeat expansions with short-read next-generation sequencing. F1000Res 7, 736 (2018). [DOI] [PMC free article] [PubMed] [Google Scholar]
- 26.Cortese A et al. Biallelic expansion of an intronic repeat in RFC1 is a common cause of late-onset ataxia. Nat Genet 51, 649–658 (2019). [DOI] [PMC free article] [PubMed] [Google Scholar]
- 27.Sato N et al. Spinocerebellar ataxia type 31 is associated with ‘inserted’ penta-nucleotide repeats containing (TGGAA)n. Am J Hum Genet 85, 544–57 (2009). [DOI] [PMC free article] [PubMed] [Google Scholar]
- 28.Rafehi H et al. Bioinformatics-based identification of expanded repeats: a non-reference intronic pentamer expansion in RFC1 causes CANVAS. Am J Hum Genet 105, 151–165 (2019). [DOI] [PMC free article] [PubMed] [Google Scholar]
- 29.Hagerman RJ et al. Fragile X-associated neuropsychiatric disorders (FXAND). Front Psychiatry 9, 564 (2018). [DOI] [PMC free article] [PubMed] [Google Scholar]
- 30.Dolzhenko E et al. ExpansionHunter Denovo: a computational method for locating known and novel repeat expansions in short-read sequencing data. Genome Biol 21, 102 (2020). [DOI] [PMC free article] [PubMed] [Google Scholar]
- 31.Levy S et al. The diploid genome sequence of an individual human. PLoS Biology 5, e254 (2007). [DOI] [PMC free article] [PubMed] [Google Scholar]
- 32.Consortium GTEx. Genetic effects on gene expression across human tissues. Nature 550, 204–213 (2017). [DOI] [PMC free article] [PubMed] [Google Scholar]
- 33.Olson JE et al. Characteristics and utilisation of the Mayo Clinic Biobank, a clinic-based prospective collection in the USA: cohort profile. BMJ Open 9, e032707 (2019). [DOI] [PMC free article] [PubMed] [Google Scholar]
- 34.Subramanian S, Mishra RK & Singh L Genome-wide analysis of microsatellite repeats in humans: their abundance and density in specific genomic regions. Genome Biol 4, R13 (2003). [DOI] [PMC free article] [PubMed] [Google Scholar]
- 35.Benson G Tandem repeats finder: a program to analyze DNA sequences. Nucleic Acids Res 27, 573–80 (1999). [DOI] [PMC free article] [PubMed] [Google Scholar]
- 36.Willems T et al. The landscape of human STR variation. Genome Res 24, 1894–904 (2014). [DOI] [PMC free article] [PubMed] [Google Scholar]
- 37.Bignell GR et al. Signatures of mutation and selection in the cancer genome. Nature 463, 893–8 (2010). [DOI] [PMC free article] [PubMed] [Google Scholar]
- 38.Hannan AJ Tandem repeats mediating genetic plasticity in health and disease. Nat Rev Genet 19, 286–298 (2018). [DOI] [PubMed] [Google Scholar]
- 39.Yuen RKC et al. Whole-genome sequencing of quartet families with autism spectrum disorder. Nat Med 21, 185–91 (2015). [DOI] [PubMed] [Google Scholar]
- 40.Banerjee-Basu S & Packer A SFARI Gene: an evolving database for the autism research community. Dis Model Mech 3, 133–5 (2010). [DOI] [PubMed] [Google Scholar]
- 41.Trost B et al. A comprehensive workflow for read depth-based identification of copy-number variation from whole-genome sequence data. Am J Hum Genet 102, 142–155 (2018). [DOI] [PMC free article] [PubMed] [Google Scholar]
- 42.Takiyama Y et al. Single sperm analysis of the CAG repeats in the gene for Machado-Joseph disease (MJD1): evidence for non-Mendelian transmission of the MJD1 gene and for the effect of the intragenic CGG/GGG polymorphism on the intergenerational instability. Hum Mol Genet 6, 1063–8 (1997). [DOI] [PubMed] [Google Scholar]
- 43.Dean NL et al. Transmission ratio distortion in the myotonic dystrophy locus in human preimplantation embryos. Eur J Hum Genet 14, 299–306 (2006). [DOI] [PubMed] [Google Scholar]
- 44.Shoubridge C et al. Is there a Mendelian transmission ratio distortion of the c.429_452dup(24bp) polyalanine tract ARX mutation? Eur J Hum Genet 20, 1311–4 (2012). [DOI] [PMC free article] [PubMed] [Google Scholar]
- 45.Ekström A-B, Hakenäs-Plate L, Samuelsson L, Tulinius M & Wentz E Autism spectrum conditions in myotonic dystrophy type 1: a study on 57 individuals with congenital and childhood forms. Am J Med Genet B Neuropsychiatr Genet 147B, 918–26 (2008). [DOI] [PubMed] [Google Scholar]
- 46.Lagrue E et al. A large multicenter study of pediatric myotonic dystrophy type 1 for evidence-based management. Neurology 92, e852–e865 (2019). [DOI] [PubMed] [Google Scholar]
- 47.Dolzhenko E et al. Detection of long repeat expansions from PCR-free whole-genome sequence data. Genome Res 27, 1895–1903 (2017). [DOI] [PMC free article] [PubMed] [Google Scholar]
- 48.Dolzhenko E et al. ExpansionHunter: a sequence-graph-based tool to analyze variation in short tandem repeat regions. Bioinformatics 35, 4754–4756 (2019). [DOI] [PMC free article] [PubMed] [Google Scholar]
- 49.Tsai LY & Beisler JM The development of sex differences in infantile autism. Br J Psychiatry 142, 373–8 (1983). [DOI] [PubMed] [Google Scholar]
- 50.Satterstrom FK et al. Large-scale exome sequencing study implicates both developmental and functional changes in the neurobiology of autism. Cell 180, 568–584.e23 (2020). [DOI] [PMC free article] [PubMed] [Google Scholar]
References for Methods
- 51.Li H & Durbin R Fast and accurate short read alignment with Burrows-Wheeler transform. Bioinformatics 25, 1754–60 (2009). [DOI] [PMC free article] [PubMed] [Google Scholar]
- 52.Purcell S et al. PLINK: a tool set for whole-genome association and population-based linkage analyses. Am J Hum Genet 81, 559–75 (2007). [DOI] [PMC free article] [PubMed] [Google Scholar]
- 53.Alexander DH, Novembre J & Lange K Fast model-based estimation of ancestry in unrelated individuals. Genome Res 19, 1655–64 (2009). [DOI] [PMC free article] [PubMed] [Google Scholar]
- 54.Koren S et al. Canu: scalable and accurate long-read assembly via adaptive k-mer weighting and repeat separation. Genome Res 27, 722–736 (2017). [DOI] [PMC free article] [PubMed] [Google Scholar]
- 55.Ester M, Kriegel H, Sander J & Xu X A density-based algorithm for discovering clusters a density-based algorithm for discovering clusters in large spatial databases with noise. in Proceedings of the Second International Conference on Knowledge Discovery and Data Mining (AAAI Press, 1996). [Google Scholar]
- 56.Wang K, Li M & Hakonarson H ANNOVAR: functional annotation of genetic variants from high-throughput sequencing data. Nucleic Acids Res 38, e164 (2010). [DOI] [PMC free article] [PubMed] [Google Scholar]
- 57.de Leeuw CA, Mooij JM, Heskes T & Posthuma D MAGMA: generalized gene-set analysis of GWAS data. PLoS Comput Biol 11, e1004219 (2015). [DOI] [PMC free article] [PubMed] [Google Scholar]
- 58.Schizophrenia Working Group of the Psychiatric Genomics Consortium. Biological insights from 108 schizophrenia-associated genetic loci. Nature 511, 421–7 (2014). [DOI] [PMC free article] [PubMed] [Google Scholar]
- 59.Demontis D et al. Discovery of the first genome-wide significant risk loci for attention deficit/hyperactivity disorder. Nat Genet 51, 63–75 (2019). [DOI] [PMC free article] [PubMed] [Google Scholar]
- 60.Lee JJ et al. Gene discovery and polygenic prediction from a genome-wide association study of educational attainment in 1.1 million individuals. Nat Genet 50, 1112–1121 (2018). [DOI] [PMC free article] [PubMed] [Google Scholar]
- 61.Wood AR et al. Defining the role of common variation in the genomic and biological architecture of adult human height. Nat Genet 46, 1173–86 (2014). [DOI] [PMC free article] [PubMed] [Google Scholar]
- 62.Zhu M et al. Using ERDS to infer copy-number variants in high-coverage genomes. Am J Hum Genet 91, 408–21 (2012). [DOI] [PMC free article] [PubMed] [Google Scholar]
- 63.Abyzov A, Urban AE, Snyder M & Gerstein M CNVnator: an approach to discover, genotype, and characterize typical and atypical CNVs from family and population genome sequencing. Genome Res 21, 974–84 (2011). [DOI] [PMC free article] [PubMed] [Google Scholar]
- 64.Lek M et al. Analysis of protein-coding genetic variation in 60,706 humans. Nature 536, 285–91 (2016). [DOI] [PMC free article] [PubMed] [Google Scholar]
Associated Data
This section collects any data citations, data availability statements, or supplementary materials included in this article.