

Abstract
Purpose:
To identify how person, crash, environment, and population characteristics differ between bicycle-motor vehicle crashes that occur at intersections and non-intersections.
Methods:
The Iowa Department of Transportation crash database for the years 2001 through 2011 was used to identify bicycle-motor vehicle (BMV) crashes and associated person, crash, and environment characteristics. Population-level data were drawn from the 2010 U.S. Census and the 2010 American Community Survey. Descriptive statistics, GIS mapping, and multivariable logistic regression were used to examine factors associated with crash risk and crash location.
Results:
Compared to intersections, non-intersection BMV crashes had higher odds of involving young bicyclists (<10 years old; OR: 1.8, 95%CI: 1.2-2.6), location outside city limits (OR: 5.7, 95%CI: 3.9-8.3), with driver vision obscured (OR: 1.5, 95% CI: 1.2-1.8), reduced lighting on roadway (OR: 1.9, 95% CI: 1.5-2.4), and lower odds when the bicyclist (OR: 0.4, 95% CI: 0.3-0.6) or motorist (OR: 0.6, 95% CI: 0.4-0.8) failed to yield right of way.
Conclusions:
Environmental factors, as well as developmental (age) and behavioral factors of bicycle-motor vehicle crashes vary by location (intersection/non-intersection). Results from this study can be used to tailor and target multiple intervention approaches, such as making infrastructure changes, increasing safety behavior among both motorists and bicyclists, and identifying which age groups and locations would most benefit from intervention.
Keywords: traffic accidents, public health, bicycling, environment, epidemiology
1. INTRODUCTION
Bicycling has become increasingly popular worldwide in the past decade and continues to grow. More people are riding bicycles for both transportation and recreation purposes, attributed in part, to health and environmental benefits, avoidance of traffic congestion, rising gas prices, and changes in infrastructure to better accommodate bicyclists (Alliance for Biking & Walking 2012,National Highway Traffic Safety Administration 2008,Reynolds et al. 2009,Pucher et al. 2011). However, in the United States the number of bicycle crashes remain high and the fatality rates are 10.9 times higher per billion kilometers traveled and 2.3 times higher per 100 million person-trips for bicycles in comparison to passenger vehicles (Pucher et al. 2000,Beck et al. 2007).
Research examining causes and prevention of bicycle crashes has lagged behind the growth of bicycling in the United States. Bicycle safety research is increasing, but the focus is often on large metropolitan areas, overlooking rural areas, small towns, and small metropolitan areas (Pucher et al. 2011). These overlooked areas have not been immune to the surge in bicycling and positive changes in bicycling infrastructure (Rails-to-Trails Conservancy 2012,Pucher et al. 2011). As of 2009 commuting mode share via bicycle in small rural core areas was almost double that of urban cores (1.61% vs 0.83%) and rural areas received almost twice the amount of federal funding per capita for improvements in cycling and walking infrastructure through the Transportation Enhancements program (Rails-to-Trails Conservancy 2012).
Existing evidence on bicycle-motor vehicle (BMV) crashes within the U.S. has found that non-intersection crashes are less prevalent than intersection crashes and have more severe injuries with over half (59%) of all bicyclist fatalities occurring at non-intersections (e.g.,National Highway Traffic Safety Administration 2013,Moore et al. 2011). However, the characteristics that account for these differences between intersection and non-intersection crashes have not been fully evaluated, which is especially true for sparsely populated areas, like the mostly rural state of Iowa.
The objective of this study is to examine the characteristics and factors associated with BMV crash occurrence, overall, and to determine which factors are attributable to where crashes happen: intersections versus non-intersections. We examine bicycle crashes in Iowa from 2001 to 2011 across four categories of factors related to those crashes: person, crash, environment, and population. We hypothesized that intersection and non-intersection crashes will have different attributes across all four categories of variables.
2. METHODS
2.1. Design and Data
This cross-sectional study uses person, crash, and environment data from the State of Iowa Department of Transportation (DOT) crash database for years 2001 to 2011. This database contains all motor vehicle crashes (MVCs) that were reported via a police report or driver’s report. The dataset was reduced to bicycle crashes only by selecting non-motorist or seating type as “pedalcyclist” or “pedalcyclist passenger”. The crash database is organized hierarchically with multiple subsets of data starting at the crash-level and ending at the person-level. These subsets were linked by crash key and person (bicyclist) identifiers, resulting in a bicyclist-level dataset. Less than two percent (N=76) of the bicyclists in this dataset were in crashes that involved more than one bicyclist. All identified bicycle-related crashes included in this dataset involved at least one motor vehicle. There were 185 (4.2%) crashes that involved more than one vehicle/driver. In these scenarios we included only one driver and corresponding vehicle that was indicated in the crash data to have been the one to collide with the bicyclist. Other driver and vehicle information was removed. We examined all bicycle crashes (injury and non-injury) in order to determine predictors of crash location (intersection or non-intersection).
Education (high school and bachelor’s degree) and household income by census tract were obtained from the American Community Survey, 2010. Population density by zip code tabulation area (ZCTA) was obtained from the 2010 U.S. Census. These population-level data were obtained via the American Fact Finder web site (U.S. Census Bureau 2012).
X and Y coordinates of crash locations from the DOT dataset were used to map crash locations using ArcGIS software (ESRI 2011). These were captured via GPS readings, recorded by the reporting law enforcement officers. ArcGIS was also used to spatially identify the zip code tabulation area (ZCTA) and census tract of each crash. A ZCTA is a U.S. Census entity that approximates a zip code area. Census tracts are larger than ZCTAs. ZCTAs were used for population density in this study because they are small enough to approximate variations in population density as one would travel through a town. Census tracts were used for education and household income because they were the smallest division available for which reliable data could be assigned. Crash locations were spatially joined to population density by ZCTA and education and income by census tract, and appended to the crash dataset to be included in analyses.
2.2. Intersection vs. Non-Intersection Crashes
The main outcome used for this analysis was crash location: intersection or non-intersection. This location was determined using the geo-mapped crashes and the road type variable in the Iowa DOT dataset. For this study, intersections are defined as locations where two roadways meet, including the following: four-way, T, Y, five-leg or more, offset four-way, intersection with ramp, on-ramp merge area, off-ramp diverge area, on-ramp, off-ramp, with bike/pedestrian path, or other intersection. Non-intersections are those reported as one of the following: non-intersection no special feature, bridge/overpass/underpass, railroad crossing, business drive, farm/residential drive, alley intersection, crossover in median, or other non-intersection.
2.3. Person, Crash, and Environment Variables
Person variables included age and gender of bicyclist and motorist and safety devices of bicyclist (helmet, reflective clothing, lighting). Crash characteristics included motor vehicle type and action, day of week, time of day, season, location (urban/rural), motorist and bicyclist contributing circumstances (e.g. failure to yield right of way), and major cause (both motorist & bicyclist, motorist only, bicyclist only, neither). Environmental characteristics included posted speed limit, vision obscurement (yes/no), surface conditions (dry, wet, other), and reduced lighting (yes/no). Person, crash, and environmental characteristics were all obtained from the Iowa DOT crash database. Actual or estimated speed were not available in our dataset and only a small number of crashes (N=12) were attributed to the driver exceeding authorized speed, therefore the examination of speed in this study is limited to posted speed limit.
2.4. Population Variables
Population-level characteristics included population density by ZCTA, education by census tract (high school degree or higher, bachelor’s degree or higher), and annual household income by census tract. Population density was categorized into quartiles, based on Iowa’s population distribution in the 2010 census and then each ZCTA was assigned to one of the resulting four categories. Education and annual household income were categorized into above or below state median for each census tract. In addition to being locally informative, these variables also allow for comparison across the entire United States, as they are nationwide US Census measures.
2.5. Analysis
Descriptive statistics including frequencies and proportions were examined. Pearson chi-square tests were performed to examine the relationship between exposure and outcome variables. ArcGIS was used to map the crashes, creating a visual representation of crash patterns, and to calculate crash rates per capita within ZCTAs. Distributions of crashes by intersection or non-intersection within selected counties were also mapped.
Five sequential multivariable logistic regression models were used to identify the characteristics most strongly associated with non-intersection crashes. These were built in succession and cumulatively incorporated four categories of variables (person, crash, environment, population). The first model examined person-level variables, and successive models added a new category of variables, while retaining significant variables from the previous model. Significance to retain variables was set at p=0.05. Thus, the first model included person-level variables and those that were significant were retained in model two while adding crash variables. Variables significant in model two were retained in model three (person, crash, environment), and this continued through model five. The final model contained all of the person, crash, environmental, and population variables that were significant. Likelihood ratio tests were used to compare the nested models to each other and adjusted R2 values were examined to determine how much variance was accounted for by each new category of variables.
We examined interactions between the predictor variables and rural/urban status and although there were some empirical differences in the stratified data, they were not statistically relevant. This is perhaps due to the small rural sample, which is inadequate for a robust examination of interaction. We also examined regression models with and without zip code as a cluster variable and the parameter and error estimates did not differ to any measurable extent. This is likely due to the large number of zip codes that had none, one, or two crashes. Too few had clusters of crashes to be relevant. In addition, since the clustering variables were assigned at the individual level, they are controlled because they would not have a second-level hierarchical effect with such sparse data.
3. RESULTS
3.1. Bicycle Crashes in Iowa
From 2001 to 2011 there were 4510 bicyclist crashes in the Iowa DOT database; 73 were excluded due to missing data. The resulting 4437 bicycle crashes were included in this analysis. There was an increased number of crashes in 2003 and 2004 and again from 2006 to 2008 when the number of crashes exceeded 400 each year (χ2 p <0.01). Overall, the annual average number of crashes during the study period was 403. Although intersection crashes were more frequent, there was not a significant difference in the proportion of crashes occurring at intersections versus non-intersections by year (p=0.69).
Figure 1 shows annual average crash rates per 10,000 population by ZCTA, which were 0.60 overall and ranged from 0.0 to 28.1. There was a high correlation between population density and number of crashes (r=0.86, p<0.01), but there were places with high crash rates and low population density (Figure 1).
Fig. 1.
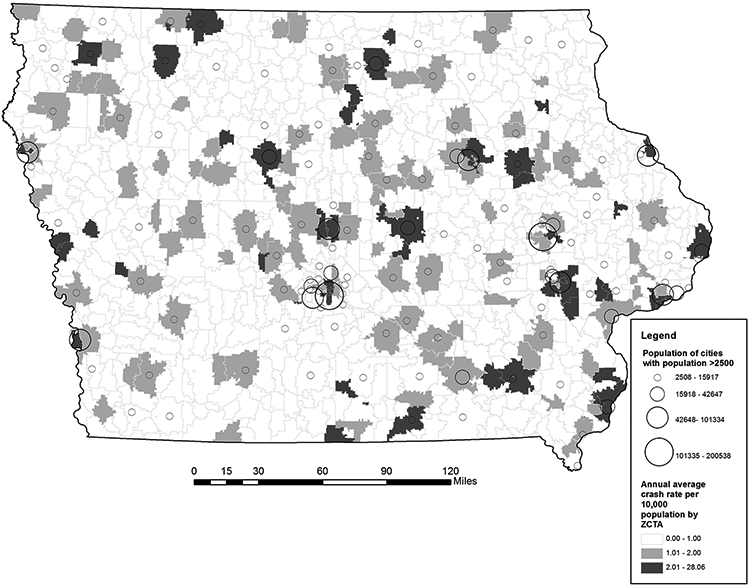
Annual average crash rate by zip code tabulation area, per 10,000 population, Iowa, 2001-2011
3.2. Population-Level Crash Characteristics (Table 1)
Table 1.
Population characteristics of zip code where bicycle-motor vehicle crashes occurred, based on 2010 census, Iowa, 2001-2011
| Bicyclist Location | |||||||
|---|---|---|---|---|---|---|---|
| Total (N=4437) | Intersection (N=2538) |
Non-intersection (N=1899) |
|||||
| Variable | N | % | N | % | N | % | p-value |
| Population density per square mile a,b | <0.01 | ||||||
| 0-466 | 27 | 0.6 | 13 | 0.5 | 14 | 0.8 | |
| 467-1013 | 78 | 1.8 | 31 | 1.2 | 47 | 2.6 | |
| 1014-2456 | 324 | 7.5 | 178 | 7.1 | 146 | 7.9 | |
| 2457+ | 3922 | 90.1 | 2283 | 91.1 | 1639 | 88.8 | |
| Median Household Income ($USD) a | |||||||
| Above state median | 1143 | 26.4 | 630 | 25.3 | 513 | 27.9 | 0.05 |
| Below state median | 3187 | 73.6 | 1862 | 74.7 | 1325 | 72.1 | |
| % High School Degree or Higher a | |||||||
| Above state median | 1877 | 43.4 | 1113 | 44.7 | 764 | 41.6 | 0.04 |
| Below state median | 2453 | 56.7 | 1379 | 55.3 | 1074 | 58.4 | |
| % Bachelor's Degree or Higher a | |||||||
| Above state median | 1492 | 34.5 | 935 | 37.5 | 557 | 30.3 | <0.01 |
| Below state median | 2838 | 65.5 | 1557 | 62.5 | 1281 | 69.7 | |
$USD = United States dollars
State median household income=$48872, State median high school degree=89.9%, State median bachelor's degree=24.5%
Population density per square mile of the zip code where the crash occurred, divided into four categories, according to state quartiles of population density
Numbers do not sum to total because of missing data.
Nearly three-quarters (74%) of crashes occurred in census tracts that were below the state median annual household income (state median=$48,872). Two-thirds (66%) of crashes occurred in census tracts that had below state median proportions of persons with bachelor’s degrees or higher (state median=24.5%). Additionally, over half (57%) occurred in census tracts with below state median proportions of persons with high school degrees or higher (state median=89.9%). Over 90% of all the BMV crashes occurred in the top 25% most densely populated ZCTAs of Iowa, while the remaining 75% of ZCTAs in Iowa that have population densities of 2456 or less, accounted for only 9.9% of the crashes.
3.3. Distribution of Crashes by Intersection and Non-Intersection (Tables 2 & 3)
Table 2.
Person characteristics of bicycle-motor vehicle crashes in Iowa, 2001-2011
| Bicyclist Location | |||||||
|---|---|---|---|---|---|---|---|
| Total (N=4437) | Intersection (N=2538) |
Non-intersection (N=1899) |
|||||
| Age, bicyclist | N | % | N | % | N | % | p-value |
| <10 | 668 | 15.1 | 293 | 11.5 | 375 | 19.8 | <0.01 |
| 10-14 | 1086 | 24.5 | 625 | 24.6 | 461 | 24.3 | |
| 15-19 | 544 | 12.3 | 345 | 13.6 | 199 | 10.5 | |
| 20-29 | 650 | 14.7 | 392 | 15.5 | 258 | 13.6 | |
| 30-59 | 1069 | 24.1 | 620 | 24.4 | 449 | 23.6 | |
| 60+ | 197 | 4.4 | 118 | 4.7 | 79 | 4.2 | |
| Unknown | 223 | 5.0 | 145 | 5.7 | 78 | 4.1 | |
| Age, motorist | 0.27 | ||||||
| 14-19 | 519 | 11.7 | 291 | 11.5 | 228 | 12.0 | |
| 20-29 | 816 | 18.4 | 488 | 19.2 | 328 | 17.3 | |
| 30-59 | 1943 | 43.8 | 1108 | 43.7 | 835 | 44.0 | |
| 60+ | 716 | 16.1 | 414 | 16.3 | 302 | 15.9 | |
| Unknown | 443 | 10.0 | 237 | 9.3 | 206 | 10.9 | |
| Gender, bicyclist | |||||||
| Female | 1098 | 24.8 | 651 | 25.7 | 447 | 23.5 | 0.23 |
| Male | 3279 | 73.9 | 1851 | 72.9 | 1428 | 75.2 | |
| Unknown | 60 | 1.4 | 36 | 1.4 | 24 | 1.3 | |
| Gender, motorist | |||||||
| Female | 1865 | 42.0 | 1125 | 44.3 | 740 | 39.0 | <0.01 |
| Male | 2136 | 48.1 | 1181 | 46.5 | 955 | 50.3 | |
| Unknown | 436 | 9.8 | 232 | 9.1 | 204 | 10.7 | |
| Safety Devices, bicyclist | |||||||
| Helmet | 475 | 10.7 | 280 | 11.0 | 195 | 10.3 | 0.10 |
| Reflective clothing | 19 | 0.4 | 8 | 0.3 | 11 | 0.6 | |
| Lighting | 34 | 0.8 | 15 | 0.6 | 19 | 1.0 | |
| None | 3190 | 71.9 | 1845 | 72.7 | 1345 | 70.8 | |
| Other/Unknown | 719 | 16.2 | 390 | 15.4 | 329 | 17.3 | |
Table 3.
Crash and environmental characteristics of bicycle-motor vehicle crashes in Iowa, 2001-2011
| Bicyclist Location | |||||||
|---|---|---|---|---|---|---|---|
| Total (N=4437) | Intersection (N=2538) | Non-intersection (N=1899) | |||||
| Characteristic | N | % | N | % | N | % | p-value |
| Crash Characteristics | |||||||
| Motor vehicle type | 0.10 | ||||||
| Passenger car | 2631 | 59.3 | 1518 | 59.8 | 1113 | 58.6 | |
| Pick-up truck | 676 | 15.2 | 377 | 14.9 | 299 | 15.7 | |
| Van or mini-van | 406 | 9.2 | 229 | 9.0 | 177 | 9.3 | |
| SUV | 500 | 11.3 | 302 | 11.9 | 198 | 10.4 | |
| Other/Unknown | 224 | 5.1 | 112 | 4.4 | 112 | 5.9 | |
| Motor vehicle action | <0.01 | ||||||
| Moving essentially straight | 2563 | 57.8 | 1300 | 51.2 | 1263 | 66.5 | |
| Turning (L, R, or U-turn) | 1358 | 30.6 | 1025 | 40.4 | 333 | 17.5 | |
| Other/Unknown | 516 | 11.6 | 213 | 8.4 | 303 | 16.0 | |
| Day | 0.19 | ||||||
| Weekend | 908 | 20.5 | 502 | 19.8 | 406 | 21.4 | |
| Weekday | 3529 | 79.5 | 2036 | 80.2 | 1493 | 78.6 | |
| Time of day a | 0.30 | ||||||
| 10:00pm to 5:59 am | 229 | 5.2 | 123 | 4.9 | 106 | 5.6 | |
| 6:00 am to 9:59 am | 499 | 11.3 | 302 | 11.9 | 197 | 10.4 | |
| 10:00 am to 2:59 pm | 1106 | 25.0 | 637 | 25.1 | 469 | 24.8 | |
| 3:00 pm to 9:59 pm | 2596 | 58.6 | 1474 | 58.1 | 1122 | 59.2 | |
| Season | 0.39 | ||||||
| Winter (Dec-Feb) | 214 | 4.8 | 126 | 5.0 | 88 | 4.6 | |
| Spring (Mar-May) | 1022 | 23.0 | 588 | 23.2 | 434 | 22.9 | |
| Summer (Jun-Aug) | 1978 | 44.6 | 1105 | 43.5 | 873 | 46.0 | |
| Fall (Sep-Nov) | 1223 | 27.6 | 719 | 28.3 | 504 | 26.5 | |
| Location | <0.01 | ||||||
| Rural (outside city limits) | 228 | 5.1 | 41 | 1.6 | 187 | 9.9 | |
| Urban (within city limits) | 4132 | 93.1 | 2468 | 97.2 | 1664 | 87.6 | |
| Unknown | 77 | 1.7 | 29 | 1.1 | 48 | 2.5 | |
| Contributing circumstances, bicyclist | <0.01 | ||||||
| Improper crossing | 624 | 14.1 | 317 | 12.5 | 307 | 16.2 | |
| Darting | 267 | 6.0 | 108 | 4.3 | 159 | 8.4 | |
| Failure to yield right of way | 365 | 8.2 | 213 | 8.4 | 152 | 8.0 | |
| Failure to obey traffic signs/signals/officer | 444 | 10.0 | 367 | 14.5 | 77 | 4.1 | |
| Wrong side of road | 117 | 2.6 | 52 | 2.1 | 65 | 3.4 | |
| None reported | 419 | 9.4 | 247 | 9.7 | 172 | 9.1 | |
| Other/Unknown | 2201 | 49.6 | 1234 | 48.6 | 967 | 50.9 | |
| Contributing circumstances, motorist | <0.01 | ||||||
| Failure to yield right of way | 1067 | 24.1 | 730 | 28.8 | 337 | 17.8 | |
| Swerving/evasive action | 195 | 4.4 | 89 | 3.5 | 106 | 5.6 | |
| Vision obstructed | 141 | 3.2 | 53 | 2.1 | 88 | 4.6 | |
| No improper action | 1871 | 42.2 | 1053 | 41.5 | 818 | 43.1 | |
| Other/Unknown | 1163 | 26.2 | 613 | 24.2 | 550 | 29.0 | |
| Major cause | <0.01 | ||||||
| Both Motor Vehicle and Bicycle | 266 | 6.0 | 157 | 6.2 | 109 | 5.7 | |
| Motor vehicle | 1137 | 25.6 | 715 | 28.2 | 422 | 22.2 | |
| Bicycle | 1551 | 35.0 | 900 | 35.5 | 651 | 34.3 | |
| Neither | 1483 | 33.4 | 766 | 30.2 | 717 | 37.8 | |
| Environmental Characteristics | |||||||
| Posted Speed Limit (mph) | <0.01 | ||||||
| 25 & Under | 2622 | 59.1 | 1520 | 59.9 | 1102 | 58.0 | |
| 30-35 | 1276 | 28.8 | 814 | 32.1 | 462 | 24.3 | |
| 40-50 | 140 | 3.2 | 74 | 2.9 | 66 | 3.5 | |
| 55+ | 399 | 9.0 | 130 | 5.1 | 269 | 14.2 | |
| Vision obscurement | <0.01 | ||||||
| No | 3270 | 73.7 | 1942 | 76.5 | 1328 | 69.9 | |
| Yes | 510 | 11.5 | 234 | 9.2 | 276 | 14.5 | |
| Unknown | 657 | 14.8 | 362 | 14.3 | 295 | 15.5 | |
| Surface conditions | 0.56 | ||||||
| Dry | 4034 | 90.9 | 2315 | 91.2 | 1719 | 90.5 | |
| Wet | 263 | 5.9 | 149 | 5.9 | 114 | 6.0 | |
| Other/Unknown | 140 | 3.2 | 74 | 2.9 | 66 | 3.5 | |
| Reduced Lighting a | <0.01 | ||||||
| No (daylight or lighted roadway) | 4046 | 91.9 | 2375 | 94.4 | 1671 | 88.5 | |
| Yes (dusk, dawn, unlighted roadway) | 333 | 7.6 | 128 | 5.1 | 205 | 10.9 | |
| Unknown | 26 | 0.6 | 13 | 0.5 | 13 | 0.7 | |
mph = miles per hour
Numbers do not sum to total because of missing data.
A majority of the BMV crashes in our dataset occurred at an intersection (N=2538, 57%) and in an urban area (N=4132, 93.1%). Non-intersection crashes occurred more frequently in rural areas (outside city limits), compared to intersection crashes (9.9% vs. 1.6%, respectively). Figure 2 displays the distribution of intersection and non-intersection crashes in two counties, revealing this pattern of most crashes occurring in more densely populated areas and non-intersection crashes being more prevalent in the less densely populated areas. The two counties displayed were chosen because they were among the most densely populated counties in the state. However, the pattern shown is similar throughout the state.
Fig 2.
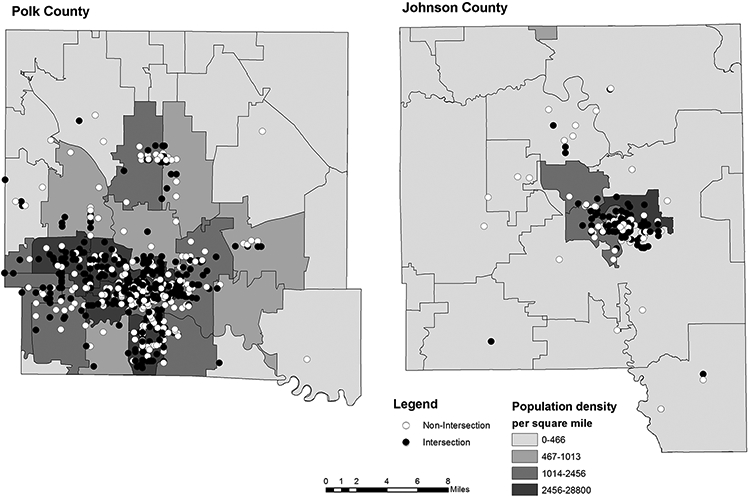
Distribution of bicycle-motor vehicle crashes by population density, stratified by intersection and non-intersection, selected counties, Iowa, 2001-2011
Age of the motorist and gender of the bicyclist did not vary significantly by intersection/non-intersection. However, it should be noted that approximately 10 percent of bicyclists and motorists had unknown values for those variables. Upon investigation into the data in regard to these missing cases we found that many were also missing driver’s license information, which is the most common method used by law enforcement to determine age and gender. It is possible that police officers choose to leave those entries blank if they cannot be confirmed by a valid government issued identification card. We also investigated the possibility that these cases may be linked to crashes that involved hit and run scenarios, but found that was the case in only three instances.
3.4. Risk Factors for Intersection and Non-Intersection Crashes
Day of week, time of day, season, surface conditions, safety devices, and age of motorist did not vary by location (intersection/non-intersection), and therefore were not considered in the regression analyses. Bicyclist gender was included in Model 1, despite lack of significance at the p=0.05 level, due to the evidence in the existing literature showing that gender is a strong predictor of crash risk(Thompson et al. 2001).
Table 4 shows the results of the five sequential models that differentiate intersection and non-intersection crashes, with the goal of examining how different groups of variables contribute, not strictly to find out how much variance is explained overall. The first model contained bicyclist age and gender and motorist gender. All three of these variables were significant (p<0.05), with male (bicyclists and motorists) and the <10 age of bicyclist having higher odds of non-intersection crashes.
Table 4.
Predictors of bicycle-motor vehicle crashes occurring at non-intersections compared to intersections, Iowa, 2001-2011.
| Multivariable Logistic Regression | ||||||||||
|---|---|---|---|---|---|---|---|---|---|---|
| Model 1 Person |
Model 2 Person & Crash |
Model 3 Person, Crash, & Environment |
Model 4 Person, Crash, Environment, & Population |
Model 5- Final Model |
||||||
| Variable | N=4437 | N=4437 | N=4405 | N=4291 | N=4405 | |||||
| Person Characteristics | OR | 95% CI | OR | 95% CI | OR | 95% CI | OR | 95% CI | OR | 95% CI |
| Age, bicyclist | ||||||||||
| <10 | 1.9 | 1.4-2.6 | 1.9 | 1.3-2.8 | 1.8 | 1.2-2.5 | 1.8 | 1.2-2.6 | 1.8 | 1.2-2.6 |
| 10-14 | 1.1 | 0.8-1.5 | 1.2 | 0.8-1.7 | 1.1 | 0.8-1.6 | 1.2 | 0.8-1.6 | 1.1 | 0.8-1.6 |
| 15-19 | 0.8 | 0.6-1.2 | 1.0 | 0.7-1.5 | 1.0 | 0.7-1.5 | 1.0 | 0.7-1.5 | 1.0 | 0.7-1.5 |
| 20-29 | 1.0 | 0.7-1.3 | 1.3 | 0.9-1.8 | 1.2 | 0.8-1.7 | 1.3 | 0.9-1.9 | 1.2 | 0.8-1.8 |
| 30-59 | 1.0 | 0.8-1.4 | 1.1 | 0.8-1.6 | 1.1 | 0.8-1.5 | 1.1 | 0.8-1.6 | 1.1 | 0.8-1.5 |
| 60+ | 1.0 | Ref | 1.0 | Ref | 1.0 | Ref | 1.0 | Ref | 1.0 | Ref |
| Unknown | 0.8 | 0.5-1.2 | 0.8 | 0.5-1.3 | 0.8 | 0.5-1.2 | 0.8 | 0.5-1.2 | 0.8 | 0.5-1.2 |
| Gender, bicyclist | ||||||||||
| Female | 1.0 | Ref | 1.0 | Ref | ||||||
| Male | 1.2 | 1.0-1.3 | 1.1 | 1.0-1.3 | ||||||
| Unknown | 1.2 | 0.7-2.2 | 1.2 | 0.6-2.1 | ||||||
| Gender, motorist | ||||||||||
| Female | 1.0 | Ref | 1.0 | Ref | ||||||
| Male | 1.2 | 1.1-1.4 | 1.1 | 1.0-1.3 | ||||||
| Unknown/Not-reported | 1.4 | 1.1-1.7 | 1.1 | 0.9-1.4 | ||||||
| Crash Characteristics | ||||||||||
| Location | ||||||||||
| Rural (outside city limits) | 5.9 | 4.1-8.6 | 5.0 | 3.3-7.5 | 5.9 | 4.0-8.7 | 5.7 | 3.9-8.3 | ||
| Urban (within city limits) | 1.0 | Ref | 1.0 | Ref | 1.0 | Ref | 1.0 | Ref | ||
| Unknown | 1.9 | 1.2-3.2 | 2.0 | 1.2-3.3 | n/a | n/a | ||||
| Contributing circumstances, bicyclist | ||||||||||
| Improper crossing (Ref=no) | 0.5 | 0.3-0.8 | 0.7 | 0.5-1.0 | 0.7 | 0.6-1.0 | 0.7 | 0.5-0.9 | ||
| Darting (Ref=no) | 0.7 | 0.4-1.1 | ||||||||
| Failure to yield right of way (Ref=no) | 0.3 | 0.2-0.5 | 0.4 | 0.3-0.6 | 0.4 | 0.3-0.6 | 0.4 | 0.3-0.6 | ||
| Failure to obey traffic signs/signals/officer (Ref=no) | 0.1 | 0.1-0.2 | 0.1 | 0.1-0.2 | 0.1 | 0.1-1.2 | 0.1 | 0.1-0.2 | ||
| Contributing circumstances, motorist | ||||||||||
| Failure to yield right of way (Ref=no) | 0.4 | 0.3-0.6 | 0.6 | 0.4-0.8 | 0.6 | 0.4-0.8 | 0.6 | 0.4-0.8 | ||
| Swerving/evasive action (Ref=no) | 0.6 | 0.4-1.0 | ||||||||
| Major Cause (from police report) | ||||||||||
| Both bicyclist and motorist | 3.0 | 1.7-5.4 | 1.5 | 1.0-2.2 | 1.6 | 1.1-2.3 | 1.5 | 1.0-2.2 | ||
| Motor vehicle only | 1.8 | 1.2-2.7 | 1.2 | 0.9-1.7 | 1.2 | 0.9-1.7 | 1.2 | 0.9-1.7 | ||
| Bicyclist only | 2.1 | 1.4-3.2 | 1.6 | 1.3-2.1 | 1.6 | 1.3-2.1 | 1.6 | 1.3-2.1 | ||
| Neither | 1.0 | ref | 1.0 | ref | 1.0 | ref | 1.0 | ref | ||
| Motor vehicle action | ||||||||||
| Moving essentially straight | 1.0 | ref | 1.0 | ref | 1.0 | ref | 1.0 | ref | ||
| Turning (L, R, or U-turn) | 0.4 | 0.3-0.4 | 0.4 | 0.3-0.4 | 0.4 | 0.3-0.4 | 0.4 | 0.3-0.4 | ||
| Other/Unknown | 1.3 | 1.1-1.7 | 1.4 | 1.1-1.7 | 1.4 | 1.1-1.7 | 1.4 | 1.1-1.7 | ||
| Environmental Characteristics | ||||||||||
| Posted Speed Limit (mph) | ||||||||||
| 25 & Under | 1.0 | ref | ||||||||
| 30-35 | 0.9 | 0.8-1.1 | ||||||||
| 40-50 | 1.0 | 0.7-1.5 | ||||||||
| 55+ | 1.2 | 0.9-1.6 | ||||||||
| Vision obscurement | ||||||||||
| No | 1.0 | ref | 1.0 | ref | 1.0 | ref | ||||
| Yes | 1.5 | 1.2-1.8 | 1.5 | 1.2-1.9 | 1.5 | 1.2-1.8 | ||||
| Unknown | 1.1 | 0.9-1.4 | 1.2 | 1.0-1.4 | 1.2 | 1.0-1.4 | ||||
| Reduced Lighting | ||||||||||
| No (daylight or lighted roadway) | 1.0 | ref | 1.0 | ref | 1.0 | ref | ||||
| Yes (dusk, dawn, unlighted roadway) | 1.9 | 1.5-2.4 | 1.9 | 1.5-2.5 | 1.9 | 1.5-2.4 | ||||
| Unknown | 1.2 | 0.5-2.8 | 1.1 | 0.5-2.6 | 1.2 | 0.5-2.8 | ||||
| Population Characteristics (based on 2010 census) | ||||||||||
| Population density by zip code (state quartiles) | ||||||||||
| 0-466 | 0.7 | 0.3-1.6 | ||||||||
| 467-1013 | 1.5 | 0.9-2.5 | ||||||||
| 1014-2456 | 0.9 | 0.7-1.1 | ||||||||
| 2457+ | 1.0 | ref | ||||||||
| Median Household Income ($USD) | ||||||||||
| Above state median | 1.0 | 0.9-1.2 | ||||||||
| Below state median | 1.0 | Ref | ||||||||
| % High School Degree or Higher | ||||||||||
| Above state median | 0.9 | 0.8-1.1 | ||||||||
| Below state median | 1.0 | Ref | ||||||||
| % Bachelor's Degree or Higher | ||||||||||
| Above state median | 0.9 | 0.8-1.1 | ||||||||
| Below state median | 1.0 | ref | ||||||||
Notes: All models are adjusted, with all variables in the column included. Ref=referent; mph = miles per hour; $USD = United States dollars.
The sample size, N, decreases in Models 3,4, and 5 due to missing values.
Adjusted R2: Model 1 (0.03), Model 2 (0.20), Model 3 (0.21), Model 4 (0.21), Model 5 (0.21).
Likelihood ratio tests: Model 2 vs. Model 1 (χ2=641.15, df=13, p<0.001), Model 3 vs. Model 2 (χ2=73.75, df=1, p<0.001), Model 4 vs.
Model 3 (χ2=137.02, df=2, p<0.001), Model 4 vs. Model 5 (χ2=140.42, df=5, p<0.001).
Variables included in successive models (2-5) had to meet criteria of p<0.05
All of the person variables from model 1 were included in model 2 and crash characteristics were added: location (rural or urban), bicyclist and motorist contributing circumstances, major cause (bicyclist, motorist, both, neither), and motor vehicle action (straight, turning, other). Rural crashes had especially high odds of occurring at non-intersections (OR 5.9, 95% CI: 4.1-8.6). Both bicyclist and motorist contributing circumstances (improper crossing, failure to yield right of way, etc.) had higher odds of occurring at intersections.
For Model 3, gender, darting, and swerving/evasive action were removed and environmental characteristics (posted speed limit, vision obscurement, and reduced lighting) were added. Vision obscurement and reduced lighting both had increased odds of crash location being at a non-intersection.
In Model 4, population-level characteristics of population density, median household income, and education were added to the significant variables from Model 3. None of these new variables showed a significant contribution to crash location.
Model 5, the final model, contained the significant variables from Model 4. This final model showed that person, crash, and environment variables were independently significant in predicting the odds of a crash occurring at a non-intersection. Young children (<10 years old) were nearly two times as likely to be involved in non-intersection crashes compared to older age groups (OR 1.8, 95% CI: 1.2-2.6). Rural crashes were nearly six times more likely to be at a non-intersection (OR 5.7, 95% CI: 3.9-8.3). Crashes with a bicyclist who failed to yield right-of-way to a car (OR 0.4, 95%CI: 0.3-0.6) or failed to obey traffic signs/signals/officers (OR 0.1, 95%CI: 0.1-0.2) were much less likely to occur at a non-intersection compared to those without those contributing circumstances. Crashes where the motorist failed to yield right of way were 40% less likely to be at non-intersections than those without that circumstance (OR 0.6, 95% CI: 0.4-0.8). Compared to crashes where neither the motorist nor bicyclist were listed as responsible, crashes in which only the bicyclist was responsible were more likely to be at non-intersections (OR 1.6, 95% CI: 1.3-2.1). Crashes in which the motor vehicle was turning (left, right, U-turn) were 60% less likely to have been non-intersection crashes (OR 0.4, 95% CI: 0.3-0.4). Non-intersection crashes were more likely to have vision obscurement (OR 1.5, 95% CI: 1.2-1.8) and reduced lighting (OR 1.9, 95% CI: 1.5-2.4). The population characteristics we examined did not play a significant role in location (intersection/non-intersection) of bicycle crashes.
A Hosmer-Lemeshow goodness-of-fit test of the final model indicated an acceptable fit (χ2=8.35, p=0.40). Likelihood ratio tests to compare Model 4 to Model 5 showed significant contribution of the additional variables in Model 4 (χ2=140.42, df=5, p<0.001). However, Model 4, with the additional population-level variables, did not account for any more variance than Model 5 (adjusted R2 for Model 4 and Model 5 = 0.21). Thus, Model 5 provided the best profile of predictive characteristics.
4. DISCUSSION
Our results showed that person, crash, and environmental characteristics were independent predictors of crash location (intersection/non-intersection). Compared to intersections, non-intersection BMV crashes were more likely to involve young bicyclists (<10 years old) or driver vision obscurement. Likely explained by variations in exposure, results also showed non-intersection BMV crashes to more often occur outside city limits (e.g., rural areas have fewer intersections meaning a bicyclist would more often be exposed to non-intersections), , or with reduced lighting on roadway and less likely occur when involve either the bicyclist or motorist failing to yield right of way a turning motor vehicle.
A majority of crashes occurred in the most densely populated parts of the state and more so in lower income and lower education areas, but this did not vary by intersection/non-intersection and we did not have exposure data on bicycle volume, so we could not determine if these distributions were as expectedReasons for this may be attributed to more traffic and/or poorer maintenance of roadways that pass through areas with those characteristics (Evans et al. 2002) or to the role that socioeconomic disparity plays in the likelihood of crashes, which can include behavioral aspects, such as greater risk-taking likelihood (Edwards P et al. 2008; Morency et al. 2012).
To our knowledge, our study is the first to examine the influence of factors at all four levels (person, crash, environment, and population) on crash location (intersection versus non-intersection). The risk factors we identified were not universally consistent with the existing bicycle crash literature on crash outcomes (e.g., fatalities or injury severity) and location (intersection/ non-intersection), but our focus was risk of crash, not outcomes. For example, our findings that crash characteristics vary by intersection or non-intersection are consistent with results of a study in Ohio that found factors were different for intersection and non-intersection BMV crashes, (e.g., crash geometry, vehicle type, bicyclist safety devices, and driver insurance status), but their study outcome was injury severity(Moore et al. 2011).
Another study, conducted in Canada and predicting injury severity of bicyclists had mixed agreement with our findings (Zahabi et al. 2011). Similar to our results, they found that crash occurrence at a signalized intersection was a significant predictor, but population density, and median income were not. Converse to our findings, they did not find crash occurrence at an intersection (any type) or lighting (after dark) to be significant, but this may be explained by the fact that they were examining severity as their dependent variable, not crash location.
Our findings somewhat differed with two spatial studies of pedestrians and bicyclists that examined similar person (age, gender) and population characteristics (population density, education, income) by census tracts in Buffalo, New York (Delmelle et al. 2008; 2012). For example, they found population density and education (no high school degree) to be important risk factors for bicyclists, while we did not. However, we did find similar results in terms of age by identifying clear differences between adults and children in terms of crash characteristics. The inconsistencies between our study and these two conducted in Buffalo may be due to differences in outcomes. Their outcomes were relative risk of bicycle versus pedestrian crashes (Delmelle et al. 2012) and traffic hazard intensity (Delmelle et al. 2008) and they did not stratify by intersection and non-intersection crashes. Our study also included crash characteristics that they did not examine, such as contributing circumstances, motor vehicle action, and major cause. It is also possible that our results differed due to the fact that our study was conducted at the regional scale (State of Iowa), while those studies were at a more micro level (city of Buffalo).
There is similar evidence to our findings within the pedestrian-MVC literature. One study examined population and environmental characteristics as they related to pedestrian-MVC risk by location (intersection vs. mid-block) and age (adult vs. child) in census tracts of Buffalo, New York(Ha et al. 2011). Consistent with our bicycle findings, their results showed children pedestrians to have more mid-block (non-intersection) crashes and adults to have more intersection crashes. Also consistent with our results, they found that age and location both varied by environmental characteristics, such as poverty-level, roadway functional classifications, and traffic controls. However, contrary to our results, they found that population density was an important predictor of location and age related to pedestrian crashes. Similar to the Delmelle et al. (2012) study, this may be due to the difference in scale between studies (city-level versus state-level).
Our result showing young children had higher odds of non-intersection crashes was also similar to results from a child pedestrian-motor vehicle study in Long Beach, California, that compared mid-block and intersection collisions(Lightstone et al. 2001). They found that children under five years of age were most likely to be hit by a motor vehicle at mid-block. Without adequate exposure denominator data we do not know if these are occurring more frequently because children have higher frequency of crossing mid-block or are more often exposed to traffic at mid-block due to absence of pedestrian phased traffic controls. They also found that both intersection and mid-block crashes occurred more frequently in census tracts as the population density increased, which is consistent with our finding that 90.5% of all the crashes included in our study occurred in the highest population density quartile (2457 people or more) of census tract areas in Iowa.
Results from this study can be used to select and target interventions from the range of possible approaches to reduce crash risk. For example, at intersections, segregation of motorists and bicyclists through use of bicycle-specific facilities (e.g., cycle paths) has been shown to provide a reduction in crash risk, resulting in a partial solution to the problem of bicycle-motor vehicle crash occurrence (Pucher et al., 2003; Reynolds et al., 2009). Comprehensive intervention programs for drivers and childbicyclists, to improve traffic safety behaviors and bicycle riding skills are other avenues for crash reduction; although further evaluation of such programs is needed to generate impact beyond knowledge change by assessing riding skills, driving behaviors, and injury and crash rates post intervention (Rivara & Metrik, 1998; Richmond et al., 2013; Ellis, 2014). Additionally, one of the known ways to reduce injuries and injury severity is speed reduction of motorized transport, of particular interest for non-intersection collisions (Kim et al., 2007; WHO, 2013). Speed reduction is also pertinent to children 10 and younger, rather than safety training alone; given their heightened impulsivity and eyesight that is not fully developed to be able to judge speeds over 20 miles per hour (Wang et al., 2011).
4.1. Limitations
This study includes only BMV crashes that were recorded via a police crash report, which under-reports bicycle crashes. Thus, we cannot determine if our results would generalize to crashes that did not have police reports, which likely includes the least severe crashes or crashes that did not involve property damage.
The Iowa DOT dataset was also limited in relation to speed and charges. It does not contain actual or estimated speeds on roads where crashes occurred and it contains motorist, but not bicyclist charges. Therefore, we relied on posted speed limits and reports of bicyclist and motorist contributing circumstances to serve as a proxy for cause of the crash.
The use of 2010 US Census data is a potential limitation given the study period was 2001 to 2011 and the census may have changed in Iowa over this time period. However, Iowa has a rather stable population, so we do not believe this would have had a large impact on our results.
Finally, we did not have information on bicyclist route or exposure, from which overall exposure and exposure to intersections and non-intersections during a bicyclist’s trip could be calculated. Instead, we had to rely on other rough population-level characterisitcs, which unfortunately were the best variables available to us. Some of the variables included in our models would account for part of that variance (e.g., population density and rural/urban status) and we do not believe that exposure to intersections and non-intersections would vary greatly between riders beyond those variables, but we do not know how the having bicyclist traffic volumes at crash sites, the ideal exposure information, would impact our results.
5. CONCLUSIONS
BMV crashes in Iowa are influenced by person, crash, and environmental factors and vary by location (intersection or non-intersection), which is similar to findings within the bicycle and pedestrian-MVC literature. Results from this study demonstrate the complicated nature of BMV crashes and the need to consider all types of road users, both motorists and non-motorists, as well as the built environment, when developing prevention methods to make roadways safer. This study provides specific focus areas for the prevention of crashes. For non-intersection crashes, prevention efforts can be directed to rural areas, increasing safety awareness among both drivers and young children (less than 10 years old) and speed reduction in areas where young children are exposed to motorized traffic, prevention of driver vision obscurement, and increases in roadway lighting. For intersection crashes, attention should be focused on bicyclists 10 and older, behavior modification interventions and enforcement to reduce failure to yield right-of-way infractions by both motorists and bicyclists, and infrastructure changes to make bicyclists more visible to motorists when turning.
Acknowledgements
We would like to thank Tracy Young for her assistance with data acquisition and management. This study was funded by the University of Iowa Injury Prevention Research Center (Grant Number R49CCR703640), the Iowa Department of Transportation (Contract 92080408-002), and a training grant from the Heartland Center for Occupational Health and Safety at the University of Iowa (Training Grant Number T42OH008491).
REFERENCES
- 1.Alliance for Biking & Walking. Bicycling and walking in the United States: 2012. benchmarking report Available at: www.peoplepoweredmovement.org/benchmarking. Accessed June 5, 2012. [Google Scholar]
- 2.Beck LF, Dellinger AM, O'Neil ME. Motor vehicle crash injury rates by mode of travel, united states: Using exposure-based methods to quantify differences. Am J Epidemiol. 2007;166(2):212–218. [DOI] [PubMed] [Google Scholar]
- 3.Delmelle EC, Thill JC, Ha HH. Spatial epidemiologic analysis of relative collision risk factors among urban bicyclists and pedestrians. Transportation. 2012;39(2):433–448. [Google Scholar]
- 4.Demelle EC, Thill JC. Urban bicyclists: Spatial analysis of adult and youth traffic hazard intensity. Transport Res Rec. 2008; 2074:31–39. [Google Scholar]
- 5.Edwards P, Green J, Lachowycz K, Grundy C, Roberts I. Serious injuries in children: variation by area deprivation and settlement type. Archives of disease in childhood. 2008. Jun;93(6):485–9. PubMed PMID: 18381345. [DOI] [PubMed] [Google Scholar]
- 6.Ellis J Bicycle safety education for children from a developmental and learning perspective. NHTSA Report No. DOT HS 811 880. 2014. Jan. [Google Scholar]
- 7.ESRI. ArcGIS desktop release 10.1. Redlands, CA: Environmental Systems Research Institute; 2011. [Google Scholar]
- 8.Evans GW, Kantrowitz E. Socioeconomic status and health: The potential role of environmental risk exposure. Annu Rev Public Health. 2002;23:303–331. [DOI] [PubMed] [Google Scholar]
- 9.Ha HH, Thill JC. Analysis of traffic hazard intensity: A spatial epidemiology case study of urban pedestrians. Comput Environ Urban. 2011;35(3):230–240. [Google Scholar]
- 10.Kim JK, Kim S, Ulfarsson GF, Porrello LA. Bicyclist injury severities in bicycle-motor vehicle accidents. Accid Anal Prev. 2007;39(2)238–251. [DOI] [PubMed] [Google Scholar]
- 11.Lightstone AS, Dhillon PK, Peek-Asa C, Kraus JF. A geographic analysis of motor vehicle collisions with child pedestrians in Long Beach, California: comparing intersection and midblock incident locations. Inj Prev. 2001;7(2):155–160. [DOI] [PMC free article] [PubMed] [Google Scholar]
- 12.Morency P, Gauvin L, Plante C, Fournier M, Morency C. Neighborhood social inequalities in road traffic injuries: the influence of traffic volume and road design. American journal of public health. 2012. Jun;102(6):1112–9. PubMed PMID: 22515869. [DOI] [PMC free article] [PubMed] [Google Scholar]
- 13.Moore DN, Schneider WH, Savolainen PT, Farzaneh M. Mixed logit analysis of bicyclist injury severity resulting from motor vehicle crashes at intersection and non-intersection locations. Accident Anal Prev. 2011;43(3):621–630. [DOI] [PubMed] [Google Scholar]
- 14.National Highway Traffic Safety Administration. National survey of bicyclist and pedestrian attitudes and behavior, volume I: Summary report. 2008. [Google Scholar]
- 15.National Highway Traffic Safety Administration. Traffic safety facts: 2011 data, bicyclists and other cyclists. Report No. DOT HS 811 743. 2013. [Google Scholar]
- 16.Pucher J, Dijkstra L. Making walking and cycling safer: Lessons from Europe. Transport Q. 2000;54(3):25–50. [Google Scholar]
- 17.Pucher J, Buehler R, Merom D, Bauman A. Walking and Cycling in the United States, 2001-2009: Evidence From the National Household Travel Surveys. Am J Public Health. 2011;101:S310–S317. [DOI] [PMC free article] [PubMed] [Google Scholar]
- 18.Pucher J, Buehler R, Seinen M. Bicycling renaissance in North America? An update and re-appraisal of cycling trends and policies. Transport Res A-Pol. 2011;45(6):451–475. [Google Scholar]
- 19.Pucher J, Dijkstra L. Promoting safe walking and cycling to improve public health: Lessions from the Netherlands and Germany, Am J Public Health. 2003;93:1509–1516. [DOI] [PMC free article] [PubMed] [Google Scholar]
- 20.Rails-to-Trails Conservancy. Active transportation beyond urban centers:Walking and bicycling in small towns and rural America. 2012. http://www.railstotrails.org/ourWork/reports/beyondurbancenters.html. Accessed Feb 27, 2013. [Google Scholar]
- 21.Reynolds CC, Harris MA, Teschke K, Cripton PA, Winters M. The impact of transportation infrastructure on bicycling injuries and crashes: a review of the literature. Environ Health. 2009;8(1):47. [DOI] [PMC free article] [PubMed] [Google Scholar]
- 22.Richmond SA, Zhang YJ, Stover A, Howard A, Macarthur C. Prevention of bicycle-related injuries in children and youth: a systematic review of bicycle skills training interventions. Inj Prev. 2013;doi: 10.1136/injuryprev-2013-040933. [DOI] [PubMed] [Google Scholar]
- 23.Rivara FP & Metrik J. Training programs for bicycle safety. Retrieved February 3, 2014. from http://depts.washington.edu/hiprc/pdf/report.pdf [Google Scholar]
- 24.Thompson MJ, Rivara FP. Bicycle-related injuries. Am Fam Physician. 2001;63(10):2007–2014. [PubMed] [Google Scholar]
- 25.U.S. Census Bureau. American fact finder Available at: http://factfinder2.census.gov/faces/nav/jsf/pages/index.xhtml. Accessed 9/4/2012. [Google Scholar]
- 26.Wang J, Poulter DR, Purcell C. Reduced sensitivity to visual looming inflates the risk posed by speeding vehicles when children try to cross the road. Psych Sci. 2011;22(4):429–434. [DOI] [PubMed] [Google Scholar]
- 27.World Health Organization. Global status report on road safety 2009. Available at: http://www.who.int/violence_injury_prevention/road_safety_status/2009/en/. Accessed 3/27/2014.
- 28.Zahabi SAH, Strauss J, Manaugh K, Miranda-Moreno LF. Estimating potential effect of speed limits, built environment, and other factors on severity of pedestrian and cyclist injuries in crashes.Transport Res Rec. 2011; 2247:81–90. [Google Scholar]