

Abstract
Atmospheric aging of combustion particles alters their chemical composition and morphology. Previous studies have reported differences in toxicological responses after exposure to fresh versus aged particles, with chemical composition being the prime suspect behind the differences. However, less is known about the contribution of morphological differences in atmospherically aged particles to toxicological responses, possibly due to the difficulty in resolving the two properties (composition and morphology) that change simultaneously. This study altered the shape of lab-generated combustion particles, without affecting the chemical composition, from fractal-like to a more compact spherical shape, using a water condensation-evaporation method. The two shapes were exposed to a co-culture of human airway epithelial (A549) and differentiated human monocyte (THP-1) cells at air-liquid interface (ALI) conditions. The particles with different shapes were deposited using an electrostatic field-based ALI chamber. For the same mass dose, both shapes were internalized by cells, induced a pro-inflammatory response (IL-8 and TNFα), and enhanced CYP1A1 gene expression compared to air controls. The more compact spherical particles (representative of atmospherically aged particles) induced more early apoptosis and release of TNFα compared to the more fractal-like particles. These results suggest a contribution of morphology to the increased toxicity of aged combustion-derived particles.
Keywords: Aerosol shape, Atmospheric aging, Air-liquid exposure, Cell uptake, Pro-inflammatory markers, Apoptosis, CYP response
Graphical Abstract

1. Introduction
Combustion-derived particles contribute significantly to urban fine particulate matter (PM2.5) (Khan et al., 2021) and cause severe health impacts, including cardiovascular diseases, premature death, and decreased lung function (Br̊bäck and Forsberg, 2009; Thurston et al., 2016). Freshly generated combustion particles are hydrophobic and form a fractal-like aggregates with an average fractal dimension of 1.8 (van Poppel et al., 2005; China et al., 2013). However, after aging in the atmosphere, the particles become more hydrophilic due to the condensation of organic or inorganic compounds and aggregation with other particles (Zhang et al., 2008; Bhandari et al., 2019). Atmospheric oxidizing agents, such as ozone, hydroxyl radicals, and nitrogen oxides, promote the formation of oxygen-containing polar functional groups (e. g., carboxylates) on the combustion particle surface and also contribute to making combustion particles more hydrophilic (Zhang et al., 2008; Bhandari et al., 2019). When combustion particles become more hydrophilic, they adsorb water, which later exerts capillary forces between the primary particles of the aggregates, causing the structure to collapse and become more compact (Schnitzler et al., 2017; Ma et al., 2013).
In vivo and in vitro studies comparing toxicological responses to fresh versus aged combustion particles have attributed differences in responses primarily to differences in the chemical composition (Li et al., 2021; Nordin et al., 2015; Housseiny et al., 2020; Tong et al., 2019; Atwi et al., 2021). Specifically, aged particles have been associated with increased oxidative stress (Zhu et al., 2019; Antiñolo et al., 2015). For example, after two days of atmospheric aging, reactive oxygen species (ROS) content in biomass burning aerosol increased by 11–64% in human bronchial epithelial BEAS-2B cells (24 h exposure) (Li et al., 2021). In another example, the expression of HO-1 mRNA and glutamate levels increased significantly in adult male mice exposed for 5 h a day and 5 days per week to aged diesel engine exhaust compared to non-aged diesel exhaust (Win-Shwe et al., 2016). In these studies, particles typically age in a smog chamber (Chu et al., 2022) or oxidative flow reactor (Bhattarai et al., 2018; Chowdhury et al., 2019), and at least two properties (chemical composition and morphology) change simultaneously. To the best of our knowledge, no study has attempted to resolve the contribution from each property to the observed toxicological response. This study aims to address this gap by changing the morphology of combustion particles in an atmospherically relevant manner without affecting the chemical composition.
Previous studies with synthesized nanoparticles have found that the morphology of a particle affects cellular uptake and subsequent response (Yuan et al., 2019; Zheng and Yu, 2016; Tabei et al., 2017; Tree- Udom et al., 2015; Salatin et al., 2015; Kettler et al., 2014; Huang et al., 2010; Champion and Mitragotri, 2006; Manzano et al., 2008; Geiser, 2002). For example, Huang et al. (2010) has reported that A375 human melanoma cells exhibited greater internalization of mesoporous silica with an aspect ratio of 4, compared to silica with aspect ratios of 2 or 1. The high aspect ratio silica induced the greatest cell proliferation and apoptosis. Chithrani et al. (2006) observed a decreased uptake of gold particles in HeLa cells with increased particle aspect ratio. Fibrous TiO2 particles has been observed to cause a higher inflammatory response than spherical TiO2 particles in primary murine alveolar macrophages (Hamilton et al., 2009). For carbon black nanomaterials, particle toxicity greatly depends on the particle geometry and is generally highest for graphene, followed by single-walled carbon nanotubes, multiwall carbon nanotubes (MWCNTs), carbon nanoparticle (CNPs), and fullerenes, respectively (Yuan et al., 2019). For example, Kang et al. (2015) reported higher ROS production and cellular toxicity (measured by the decrease in viability) in a normal human bronchial epithelial cell line 16HBE14o- exposed to MWCNTs compared to onion-shell CNPs. This study aims to understand the effect of particle shape for atmospherically relevant particles on the cellular response in co-cultures of human airway epithelial (A549) and differentiated human monocyte cells (THP-1) that exhibit macrophage-like behavior. This study compares the biological responses of freshly generated combustion particles with a fractal-like structure to more compact combustion particles that have undergone a shape transformation similar to what occurs in the atmosphere.
2. Method
Fresh combustion particles were generated in a laboratory under well-controlled conditions using a flat-flame burner. The morphology of the fresh particles was modified from fractal-like to a more compact spherical shape with a condensation growth tube and diffusion dryer arranged in series. The particles with different morphologies were exposed to the co-culture of A549 and differentiated THP-1 using an electrostatic ALI exposure system (CelTox Sampler, MedTech Biolab, NC, USA).
2.1. Generation of combustion particles
To generate particles with consistent properties, a jet-fuel surrogate (a blend of six pure compounds; details in the supplementary material) was combusted in a laboratory flat-flame burner under constant combustion conditions (Fig. 1). Before reaching the burner, the liquid surrogate fuel was vaporized using a custom-made vaporizer. Table S1 (Supplementary material) demonstrates that the chemical composition before and after the vaporizer was consistent. A mass flow controller and a syringe pump controlled the flows of air and fuel, respectively. The equivalence ratio was fixed at 1.8. A quartz housing surrounded the flame and limited any interference from air flow in the hood (Fig. 1). The quartz housing had sample openings at 15 cm, 25 cm, and 30 cm above the burner base. For this study, the particles were sampled at the height of 15 cm (post-flame region) using an eductor (#30, mini eductor, Fox Venturi Products, NJ, USA; fixed motive particle-free air at 3 psig).
Fig. 1.

Schematic shows the generation of the combustion particles using the flat-flame burner, probe with eductor used to draw the particles from the flame, growth tube to condense water onto the particles, diffusion dryers to evaporate the water from the particle surface, measurement of particle size distribution at the inlet of the growth tube and the Celtox sampler, humidifier and exposure chamber of the sampler, relative humidity and temperature sensor, and suction pump required for the flow through the whole setup.
2.1.1. Modifying the morphology of combustion particles
Understanding the effect of morphology required a method to change particle morphology without affecting the chemical composition. The process of water condensation on particle surface using a condensation growth tube, followed by subsequent evaporation, changes particle morphology (Ma et al., 2013). This method does not require surface oxidation for condensing water; rather, it uses supersaturation to forcefully condense water on the particle surface. Using this same method, freshly generated combustion particles were reliably modified in the laboratory in a manner that mimics the morphological transformations that occur in the atmosphere.
The water was first condensed onto the freshly generated combustion particles using the condensation growth tube (Fig. 1; Spot Sampler 110 A (Aerosol Devices Inc., CO, USA) with a modified outlet; more detail in the supplementary material, section S2). The particles coated with water were quickly dried with two diffusion dryers (TSI 3062, TSI Incorporated, MN, USA) arranged in a series. The outlet of the dryer flowed to the air-liquid interface exposure (ALI) system (CelTox Sampler, MedTech Biolab, NC, USA). The flow through the growth tube was 1.25 LPM. Supplemental particle-free air was added after the first dryer to provide sufficient flow for the ALI system, i.e., 2.2 LPM. The fractal-like particles (abbreviated as before shape change, BSC) flowed through the same setup (i.e., growth tube and dryer, followed by ALI) as the modified shape particles (abbreviated as after shape change, ASC), the only difference being that no water was added to the growth tube for the BSC.
2.1.2. Validation of morphology change
Both the BSC and ASC were collected onto a copper grid (Ted Pella, Inc., CA, USA) and imaged using transmission electron microscopy (TEM). The copper grids were placed onto a 0.2 μm filter (PTFE, Whatman Ltd.) using carbon tape, and the filter was placed inside a filter housing, which was connected at the outlet of the diffusion dryer (Fig. 1). The outlet of the filter housing was connected to a pump, creating a flow of 1.25 LPM through the growth tube (measured at the inlet of the growth tube) using a flow calibrator, Defender 530 (Mesa Laboratories, Inc., CO, USA). The inlet of the growth tube was connected to the outlet of the eductor, which was used for sampling from the flame (Fig. 1). TEM images were taken at various magnifications using a JEM 2800 (JEOL, Japan; accelerating voltage of 200 kV).
2.1.3. Physical and chemical characteristics of the BSC and ASC particles
The particle size distribution was measured at the inlet of the condensational growth tube and inlet of the ALI (for both BSC and ASC) using a scanning mobility particle sizer (SMPS) with a long-differential mobility analyzer (TSI model 3081, TSI Incorporated, MN, USA) and ultra-fine condensation particle counter (TSI model 3025 A, TSI Incorporated, MN, USA). The inlet aerosol flow rate and sheath flow rate of SMPS were set to 0.3 L/min and 3 L/min, respectively. The SMPS measurements were also collected at the outlet of ALI chamber (no humidifier used) for electric field on and off conditions to check for any size-based preferential deposition in the chamber. The SMPS measurements were analyzed for total number concentration using Aerosol Instrument Manager® Software version 8.0.0.0(U).
For chemical composition, the BSC and ASC particles were collected at the second diffusion dryer’s outlet onto quartz filters (Whatman Ltd.). A mass of about 10 mg each was collected for both the particle type (9.5 mg for BSC, and 9.6 mg for ASC). Chemtech-Ford laboratories (Sandy, UT) extracted the filters using EPA method SW-846 3511 and quantitatively analyzed the filters for semi-volatiles and polycyclic aromatic hydrocarbons (PAHs) using EPA method SW-846 8270E. The chemical species with concentrations higher than minimum reporting limit (MRL) were compared for BSC and ASC. The laboratory estimated their analytical uncertainty as 20% of the measured values if concentrations exceeded the 5xMRL, otherwise uncertainties were estimated as the MRL.
2.2. In vitro study design
2.2.1. Cell lines
THP-1 cells and A549 cells were purchased from American Type Culture Collection (ATCC, Manassas, VA, USA). THP-1 cells were maintained in complete growth medium (RPMI, Roswell Park Memorial Institute medium 1640) with L-glutamine, 25 mM HEPES buffer, 0.05 mM 2-mercaptoethanol (Bio-Rad, Inc. Hercules, CA, USA), and 10% FBS (Fetal Bovine Serum; GE Healthcare Biosciences, Corp. Marlborough, MA, USA). A549 cells were maintained in DMEM (Dulbecco’s Modified Eagle Medium, Life Technologies Corporation, NY, USA) with L-glutamine 4.5 g/L D-glucose, 25 mM HEPES Buffer, and 10% FBS. Cell cultures were incubated at 37 °C in 5% CO2, and 95% humidified air and maintained in the logarithmic phase of growth throughout all experiments.
THP-1 cells are a monocytic cell-line that is routinely maintained in suspension, and can be differentiate to macrophage-like cells using phorbol 12-myristate 13-acetate (PMA, Sigma Aldrich, St. Louis, MO) (Daigneault et al., 2010). THP-1 cells were seeded in a T25 K flask with a concentration of approximately 860K–1000K cells/mL in media with 0.5 μg/mL PMA. Ninety minutes after seeding, as described in Kasurinen et al. (2018), the floating cells were aspirated, and partially attached cells were gently tapped to resuspend the cells using phosphate buffer solution (PBS; VWR Life Sciences, PA, USA). The cells were washed twice with PBS (by centrifugation at 1200×g for 6 min) before resuspending in DMEM with FBS. This suspension in DMEM with FBS was used for seeding the co-culture.
2.2.2. Cell seeding for co-cultures
Co-cultures of airway epithelial cells and macrophages provide more realistic cellular systems than monocultures. In addition, co-cultures of A549 and differentiated THP-1 have been reported to be more sensitive than monocultures to particulate matter (Wang et al., 2019). Therefore, the differentiated THP-1 were grown as co-culture with A549 cells. Co-cultures were seeded onto standing-type inserts (Millicell Cell Culture Insert, 30 mm, hydrophilic PTFE, 0.4 μm). The inserts were coated with collagen (10 μg/cm2, PureCol®, CA, USA) on the apical side before seeding. Seeding amount and timings for A549 and THP-1 followed the protocol detailed by Kasurinen et al. (2018). One mL of DMEM (with FBS and 25 mM HEPES buffer) was added to each well of a six-well plate, and the inserts were placed in the wells containing media. The inserts were allowed to rest in the media for 5 min before initiating the seeding process. Approximately 240K A549 cells (~57.2K cells/cm2) were seeded onto the apical side of the insert in 0.5 mL DMEM. After 4 h, 48K differentiated THP-1 cells (~11.4K cells/cm2) in 0.1 mL DMEM were seeded onto the A549 cells, yielding an apical volume of 0.6 mL. After 40 h, the apical media was removed, and the inserts were moved to DMEM media with 25 mM HEPES and without FBS in an aluminum six-well exposure plate (MedTec Biolab, NC, USA). The co-cultures were allowed to rest at ALI for 2 h in the incubator (5% CO2 and 37 °C) before exposure.
2.2.3. Treatment in the ALI exposure system
The CelTox sampler was used for exposing the co-cultures to the BSC and ASC particles (Fig. 1). Previous studies have successfully deposited diesel and gasoline engine exhaust particles onto the cell cultures at ALI using electrostatic forces (Hawley et al., 2014; Maikawa et al., 2016). In CelTox sampler, the aerosol flows parallel to the membrane inserts. The particles were deposited onto the cells using an oscillating electrostatic field. A cover plate placed on top of the six-well plate reduced the possibility of particle deposition directly into the media (rather all particles depositing on the co-cultured cells on the inserts). Due to the default polarity setting of the ALI system, only positively charged particles deposit on the inserts. The CelTox ALI system does allow the use of a corona for enhanced deposition, but corona charging was not used in this study. More details about the Celtox sampler can be found in the supplementary material (Section S3).
The CelTox system was pre-conditioned by heating the chamber and the humidifier to 37 °C for 2 h. The aluminum 6-well plate with the inserts was moved to the Celtox exposure chamber, and the chamber was sealed. The pump was turned on, followed by the electric field. The total flow through the chamber was 2.2 LPM. The particles were deposited onto the cells with exposure times that ranged between 25 and 43 min, which was the time required to deposit 2 ± 0.3 μg/cm2 (more details in section 2.2.4). The temperature of the air remained at 36.5 ± 0.5 °C, and the humidity remained at greater than 86% throughout all tests. Negative controls were exposure to particle-free air in the Celtox ALI. The electric field remained on during control exposures. An inline microfiber filter (Parker Hannifin, OH, USA) was placed at the inlet of the growth tube to obtain particle-free air. The air flowed through the entire setup (including the spot sampler and dryers), then to the ALI. The exposure time of the negative controls was set as the maximum time required to deposit 2 ± 0.3 μg/cm2. After exposure, the inserts were moved to a normal six-well plate containing 1 mL of fresh DMEM with FBS, followed by incubation for 24 h.
2.2.4. Estimation of combustion particle dose in ALI system
The mass deposition during each exposure was measured with an insert (with no cells) containing an 18 mm (diameter) round glass slide (AmScope, CA, USA) on the apical side. Before placing the glass slide, the membrane area of the insert was covered with aluminum tape to avoid the wetting of the glass slide with media from the bottom. After exposure, the glass slide was moved to a 12 well plate, and 0.5 mL of ethanol was added and sonicated for 5–10 s to suspend the particles. Quickly, 50 μL of the suspension was transferred to a 96-well plate in triplicate and read for absorbance at 450 nm using a plate reader (Bio-Tek, Synergy HTX, VT, USA). The absorbance value was compared to the calibration curve (supplementary material, Fig. S3) to obtain the approximate concentration of the suspension (μg/mL). The total mass per area was estimated using: concentration of the suspension (μg/mL) multiplied by 0.5 mL divided by the area of the slide (cm2). However, since the mass was estimated after the exposure had ended, a slight variation (±0.3 μg/cm2) in the deposition was observed. All experiments were performed in triplicate.
The intended dose for each run was 2 μg/cm2. This dose is in the midrange of previous ALI studies that apply particle doses of 0.1–80 μg/cm2 (Loret et al., 2016; Lenz et al., 2009; Diabaté et al., 2020). This 2 μg/cm2 dose corresponds to approximately 400 h of exposure to 5 mg/cm3 (OSHA limit, exposure estimate based on Paur et al. (2011).
The time to deposit BSC and ASC differed. Depositing the same mass (2 μg/cm2) of ASC, as compared to BSC, required additional time (1.6–1.7X) mainly due to loss of water-coated ASC particles in the 90-degree bend at the outlet of the growth tube. This 1.6–1.7 ratio was determined in trial experiments (prior to cellular exposure, data not shown). The mass was measured at the end of each exposure and confirmed the dose of 2 μg/cm2 for both BSC and ASC.
2.3. Biological endpoints
Twenty-four hours after exposure, the cells were evaluated for viability, pro-inflammatory markers (IL-8 and TNFα), apoptosis, CYP1A1 gene expression, and particle cell uptake.
2.3.1. Pro-inflammatory marker analysis
The basolateral media was collected, centrifuged at 10,000×g for 10 min to remove any debris, and the supernatant was saved and frozen at −80 °C. The pro-inflammatory markers (IL-8 and TNFα) were measured using ELISA (R&D Systems, Minneapolis, MN, USA), according to the manufacturer’s protocols.
2.3.2. Apoptosis assay
The cells were analyzed for viability, apoptosis, and necrosis using Annexin V-FITC and propodium iodide (PI) staining Kit (Invitrogen™, Eugene, OR, USA) by flow cytometry. After the removal of the basolateral media (saved for ELISA), 300 μL of TRYP-LE (Gibco, Thermo Fischer Scientific, MA, USA) solution was added to the apical side of the insert to detach the cells. After incubating for 3 min, 0.7 mL of warm DMEM media with FBS was added to the apical side. The cells were mixed using pipetting and finally transferred to 1.5 mL vials. The vials were centrifuged at 1200×g for 6 min. The supernatant was aspirated, and 300 μL of Annexin-V buffer was added to the pellet. The cells were resuspended and counted. A volume corresponding to 100K cells (~100 μL) was transferred to another set of 1.5 mL vials and mixed with 5 μL of FITC Annexin V and 1 μL of 100 μg/mL of PI. The mixture was incubated in the dark at room temperature for 15 min, and an additional 400 μL of Annexin-V buffer was added. Quickly, the cells were analyzed using flow cytometry (Beckman Coulter Cytoflex, Beckman Coulter, Life Sciences, IN, USA) at the emission wavelength of 525/40 and 690/50 nm. For each analysis, 30,000 cell events were recorded. Gating and analysis were performed using FlowJo 10 (OR, USA).
2.3.3. CYP1A1 gene expression analysis
After saving the basolateral media for ELISA, 0.3 mL of TRYP-LE was added to detach the cells. Following 3 min of incubation, 0.7 mL of cold PBS was added to the apical side, and cells were resuspended using gentle pipetting. The cell suspension was transferred to 1.5 mL vials, which were then centrifuged for 5 min at 1200×g. The supernatant was removed, and the cell pellet was placed at −20 °C.
When ready for extraction, the cell pellets were thawed on ice, and the RNA was extracted and purified using RNeasy Plus Kits (Qiagen, MD, USA) following the manufacturer’s protocol. The total RNA content was measured using a NanoDrop Microvolume Spectrophotometer (Thermo Fischer Scientific, MA, USA). A total of 1 μg of RNA from each sample was reverse transcribed to cDNA using QuantiTech Reverse Transcriptase kit (Qiagen, MD, USA), following manufacturers’ protocol. cDNA equivalent to 50 ng of reverse-transcribed RNA was used for quantitative polymerase chain reaction (qPCR, Applied Biosystems 7900 Real-Time PCR, Thermo Fischer Scientific, USA) using RT (Bṙbäck and Forsberg, 2009) SYBR® Green qPCR master mix (Qiagen, MD, USA). Primer’s sequence used for the reaction includes Cytochrome P450, family 1, subfamily A, polypeptide 1 (CYP1A1, F: TAGACACTGATCTGGCTGCAG, R: GGGAAGGCTCCATCAGCATC), and glyceraldehyde 3-phosphate dehydrogenase (GAPDH, F: AGCCACATCGCTCAGACAC, R: GCCCAATACGACCAAATCC) as a reference gene. The copy numbers were normalized to the reference gene and control sample using the Livak ΔΔCt method (Livak and Schmittgen, 2001).
2.3.4. Visualization of combustion particle cell uptake using TEM
24 h after dosing the co-culture with combustion particles, the basolateral media was removed, and the cells were detached after 3 min incubation in TRYP-LE. The cells were resuspended in 0.7 mL of DMEM with FBS. The suspension was transferred into a vial and centrifuged at 1200×g for 5 min. The supernatant was removed, 0.7 mL fixation buffer (formaldehyde glutaraldehyde 2.5%, Electron Microscopy Sciences, PA, USA) was added, and the suspension was vortexed for 5 min for mixing. The suspension was left to rest at room temperature for 15–30 min, followed by storage at 2–8 °C. The fixed samples were fabricated and prepared for TEM analysis. The images were taken using FEI TECNAI T-12 TEM operated at 120 kV (Thermo Fischer Scientific, MA, USA). A qualitative analysis of uptake was made between air controls and the BSC and ASC treated cells.
2.4. Data analysis
One-way analysis of variance (ANOVA) with astatsa.com online software and Tukey’s honest significant difference (HSD) post-hoc test was used to compare the mean between the samples at significance levels of p < 0.01 and p < 0.05. A student’s t-test was used when comparing the ELISA means for BSC- and ASC-treated cells.
3. Results
TEM imaging and particle size distribution measurements confirmed the change in morphology from BSC to ASC. The biological response, including pro-inflammatory markers, apoptosis, CYP1A1 gene expression, and uptake after exposure to BSC and ASC particles, were compared for co-cultures of A549-and THP-1 exposure to air controls.
3.1. Comparison of physical and chemical characteristics of BSC and ASC particles
Fig. 2 illustrates clear morphological restructuring for the ASC compared to BSC particles. The BSC particles are more fractal-like, whereas the ASC particles are more compact and spherical. The restructuring was observed for all particles, irrespective of their size (Fig. S4). These findings agree with those of Ma et al. (2013)
Fig. 2.
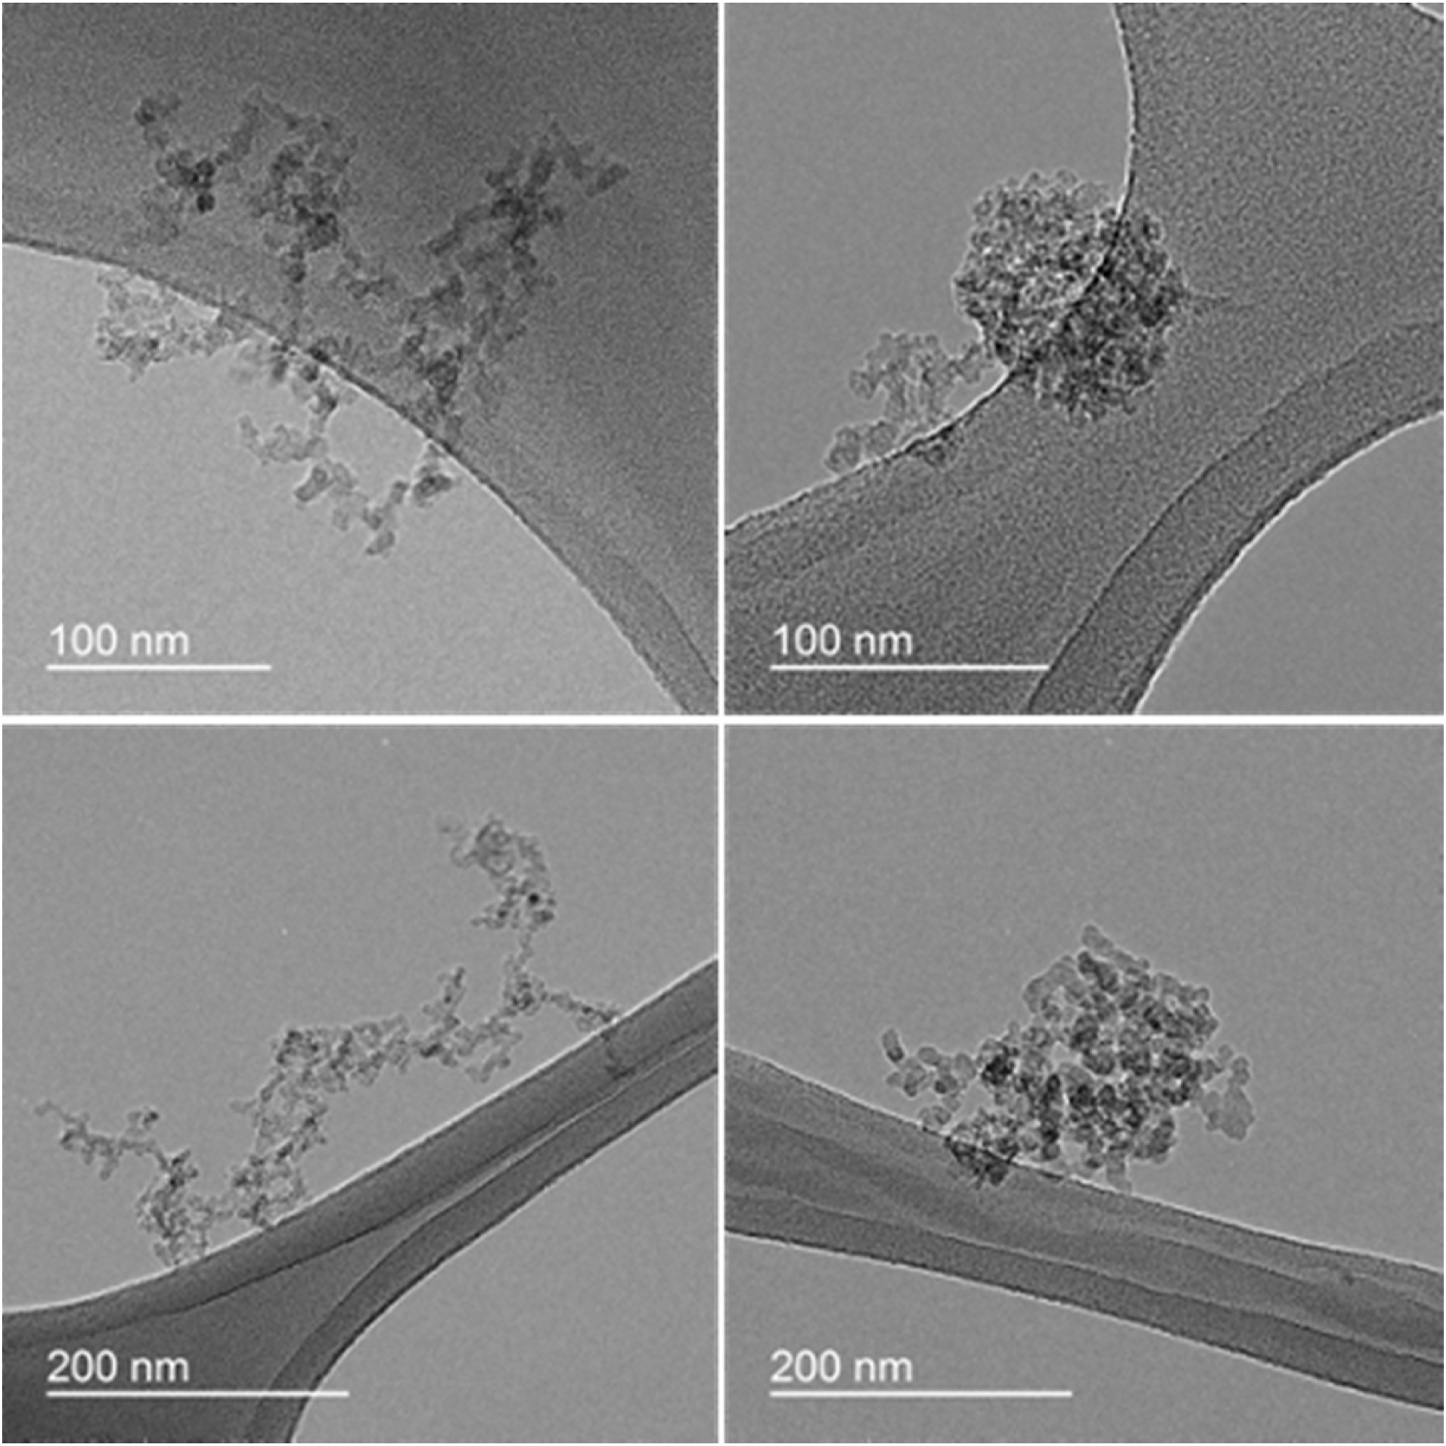
TEM images validate the change in the morphology of combustion particles from fractal-like (left, BSC) to more compact spherical like (right, ASC). Examining the TEM images visually revealed that approximately 85% of the particles (85 particles from 10 different TEM images) had a compact-spherical structure for ASC samples. Approximately 93% of BSC particles had a fractal-like shape (13 particle from 11 different TEM images).
Fig. 3a compares the ASC and BSC number–weighted particle size distributions and reveals a decrease in the total number concentration for the ASC (6.45E5), as compared to BSC (9.08E5) and the concentration measured at the inlet of the growth tube (1.16E6). The number-weighted and volume-weighted particle size distributions show similar trends (Fig. 3c). The number-weighted mean mobility diameter (Table 1) for ASC (191.4±9.1) was smaller than the BSC (213.6±7.8). The mean volume-weighted mobility size was also lower for ASC (383.3 ±12.8 nm) than for BSC (411.2± 8). This decrease in mean size could be due to two reasons: loss of large water coated particles in the 90-degree bend at the outlet of growth tube (inlet of the dryer), or restructuring of particles, thereby reducing their size. The normalized number-weighed distribution (Fig. 3b) show a decrease in the ASC particles larger than ~200 nm but no significant increase in the count of small particles, indicating that losses of the larger particles were the contributor behind the lower mean particle size. The shift toward lower mean size for ASC became more evident in the normalized volume-weighted counts (Fig. 3d) as the concentration of small particles (less than ~430 nm) increased, along with the reduction in the concentration of large particles, indicating the role of the shape restructuring on particle size. Although the total number concentration differed slightly between ASC and BSC, the ALI exposure time was adjusted to deposit the same dose of 2 μg/cm2 of ASC and BSC. Electrostatic forces were the dominate mechanism for particle deposition in the ALI, and the size of the particles did not affect deposition in the ALI (Fig. S5).
Fig. 3.

Particle size distribution at the inlet of condensational growth tube (square) and at the inlet of the ALI chamber (outlet of dryers) for the BSC (circle) and ASC (triangle) particles measured using the SMPS: a) number-weighted distribution; b) normalized number-weighted data; c) volume-weighted distribution; d) normalized number weighted data. The measurements were normalized with respect to the maximum counts (bottom left and right). The error bars indicate standard deviation (n = 9).
Table 1.
Statistics for the number-weighed and volume-weighed particle size distributions for combustion particles measured at the inlet of growth tube and for BSC and ASC, measured at the inlet of the ALI chamber (measured by SMPS).
| Sample | Number-weighted |
Volume-weighted |
||
|---|---|---|---|---|
| Mean [SD] (nm) | Total concentration [SD] (#/cm3) | Mean [SD] (nm) | Total concentration [SD] (nm /cm3) | |
|
| ||||
| At the inlet of growth tube | 214.8 [9.2] | 1.16 E6 [2.59E5] | 412.8 [8.0] | 1.34E13 [2.34E12] |
| BSC | 213.6 [7.8] | 9.08E5 [1.31E5] | 411.2 [13.4] | 9.53E12 [1.11E12] |
| ASC | 191.4 [9.1] | 6.45E5[9.93E4] | 383.3 [12.8] | 5.5E12 [1.12E12] |
Fig. 4 compares the PAHs and semi-volatiles concentration between BSC and ASC samples. A total of 7.75 mg/kg and 7.99 mg/kg of PAH content was found in BSC and ASC, respectively. Any observed differences between species concentration were less than the analytical uncertainty. These results (Figs. 3 and 4) suggest that the particle size distribution and the chemical composition are similar for BSC and ASC particles, and any differences in cellular response are likely due to the differences in particle shape.
Fig. 4.

PAH and semi volatile content (mg/kg of particle mass) in BSC and ASC samples. The error bars represent analytical uncertainties, measured as described in section 2.1.3. The superscripts in the semi volatiles results indicates a flag for: concentrations that were overestimated due to high recovery of laboratory control sample or continuing calibration verification for both shapes (**) and just for BSC (*); indicates concentrations were below detection limit and therefore estimated (^). The data in tabular form can be found in supplementary material in Table S2.
3.2. Comparison of cellular response to BSC and ASC particles
A similar degree of uptake for BSC and ASC was observed qualitatively (Fig. 5). The TEM images (Fig. 5 b–d) showed particle uptake by the cells, predominantly by the macrophages, shown in Fig. 5a, which also verifies the presence of the co-culture. The endosomal vesicles in ASC- and BSC-exposed cells indicated the presence of particles.
Fig. 5.
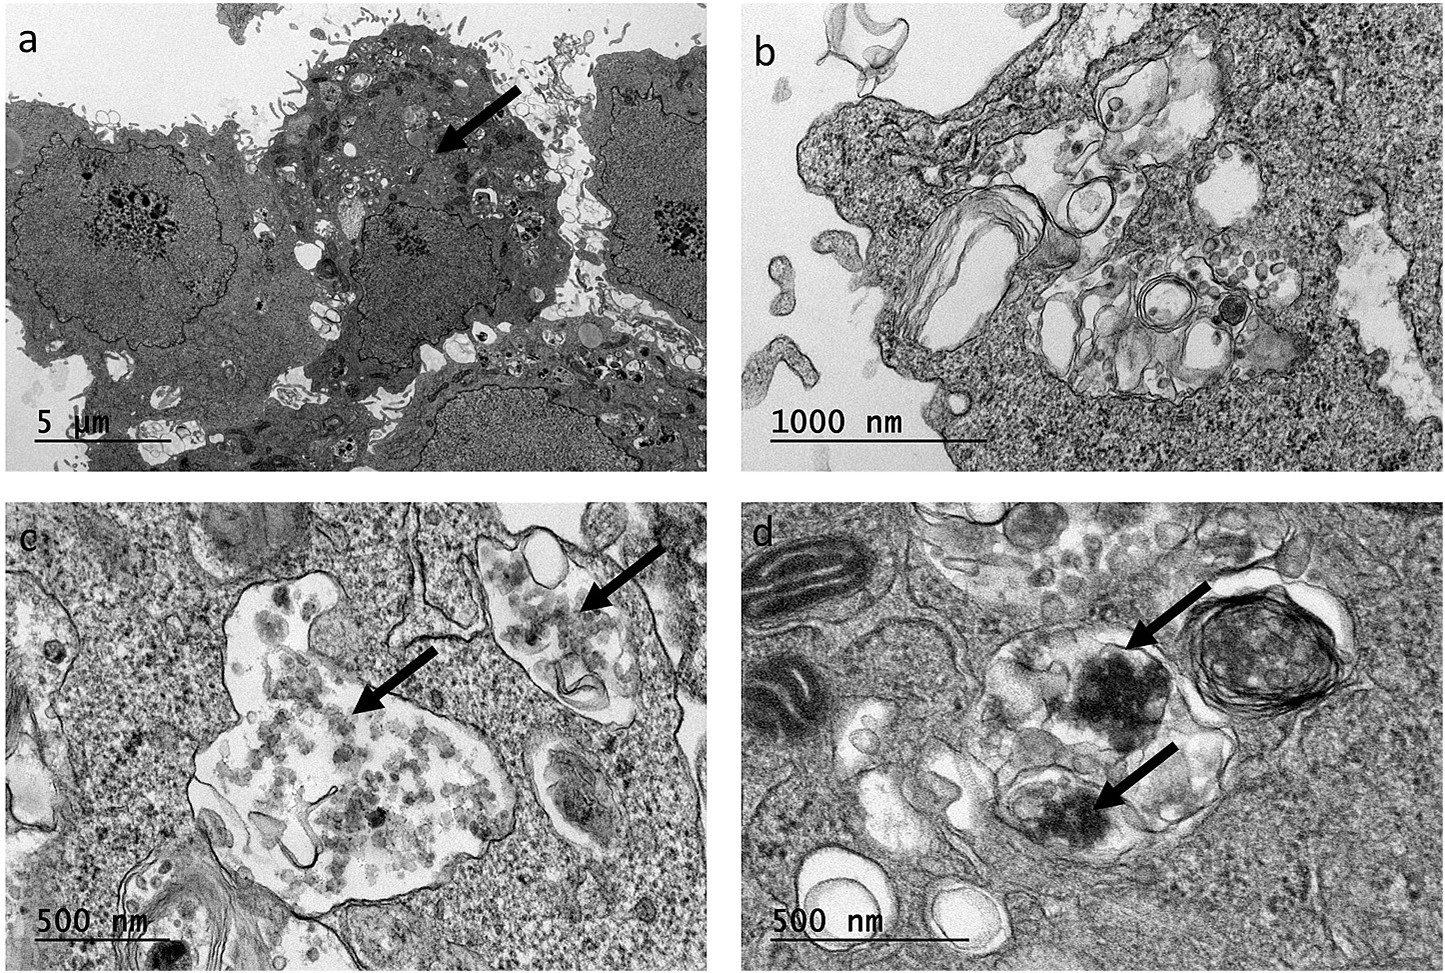
(a) TEM image showing the co-culture of A549 and differentiated THP-1 (arrow), 24 h after exposure to BSC particles; TEM images illustrating the presence of particles (arrows) in the endosomal vesicles in the THP-1 macrophage-like cells after exposure to (b) air, (c) BSC, and (d) ASC particles.
Fig. 6a and b illustrate that the secretion of pro-inflammatory markers was higher for the BSC and ASC exposed cells than for the controls. For IL-8, the ASC particles induced a greater pro-inflammatory response compared BSC particles, but the difference was not statistically significant. However, for TNFα, the ASC particles induced a greater inflammatory response than BSC particles (p < 0.01).
Fig. 6.

Cellular response from the co-culture of A549 and differentiated THP-1 24 h after exposure to BSC and ASC particles. (a) release of IL-8 (n=24); (b) secretion of TNFα (n=24); (c) Apoptotic response (n=6); (d) fold increase in the gene expression for CYP1A1 (n=6). The numbers next to box represent the mean values. Marked pairs indicate statistical significance (*p < 0.05; **p < 0.01). Error bars denote standard deviation.
Fig. 6c illustrates that ASC-treated cells exhibited a significantly greater early apoptosis than the control (p < 0.05) and BSC (p < 0.05). No statistically significant difference was observed in the late apoptosis, necrosis, and live cells.
Fig. 6d demonstrates an upregulation in the CYP1A1 gene expression compared to the control. However, there was no statistically significant difference between cells exposed to BSC or ASC particles.
4. Discussion
The generation of particles with different morphologies but with the same size (surface or volume-based) is challenging. For engineered nanoparticles, creating particles of the same composition but with spherical or fractal-like morphology would result in a difference in size. For combustion particles, atmospheric processing collapses the particles, changing their size and shape. Ma et al. (2013) reported that the mobility diameter of the collapsed soot (ethylene flame) particles was 0.803 (ln-ln plot) times that of the fresh, fractal-like particles. In this study, the decrease in the mean mobility diameter size was also observed (209.1 ± 11.5 nm for ASC particles and 225.8 ± 12.6 nm of BSC).
The shape of a particle is one important factor in its uptake by phagocytes (Yuan et al., 2019; Zheng and Yu, 2016; Tabei et al., 2017; Tree- Udom et al., 2015; Salatin et al., 2015; Kettler et al., 2014; Huang et al., 2010; Champion and Mitragotri, 2006; Manzano et al., 2008; Geiser, 2002; Augustine et al., 2020). For nano-sized particles, particles with higher aspect ratios may be more easily taken up by the cells due to the larger point of contact with the cell membrane (Salatin et al., 2015). Other factors, such as local shape, as measured by the tangent angles at the first point of initial contact, are considered important factors for whether macrophages initiate phagocytosis (Champion and Mitragotri, 2006). Uptake is also considered an energy-driven process, and those particles requiring less free energy for membrane wrapping are taken up more easily (Tree- Udom et al., 2015). Smooth surfaces are more easily wrapped than particles with sharp edges/angles, which need more energy for uptake. If considering only the initial point of contact, which for both BSC and ASC aggregates is the primary particle, which is a sphere (diameter of ~24.5 nm, as observed in our previous study (Kaur et al., 2019)). Consequently, the initial point of contact for both BSC and ASC aggregates is the same. However, the speed of uptake might differ based on the surface area of the particle, which is less for the more compact ASC particles. Wrapping time increases with increasing surface area (Chithrani and Chan, 2007). The higher energy requirement to engulf the fractal-like structure of BSC could also slow the uptake. The greater speed and lower energy requirements associated with engulfing the ASC particles could be one reason for the greater presence of pro-inflammatory markers (Fig. 6 a–b) and the greater degree of early apoptosis in the ASC exposed cells (Fig. 6c).
Particle uptake is an important step in the activation of pro-inflammatory and other cellular responses. Since the post-exposure time was identical for ASC and BSC, the faster uptake of ASC could be one of the reasons for higher TNFα secretion. If ASC are ingested more quickly, the cells will have a longer time period to respond by releasing cytokines, and TNFα (as well as other cytokines) accumulates in the media over time. The higher early apoptosis (Fig. 6c) could also be linked to higher levels of pro-inflammatory markers for ASC particles. TNFα induced apoptosis has been reported previously for the ambient particulate matter and diesel exhaust particles (Dagher et al., 2006).
Previous studies considering particle uptake for different morphologies have reported uptake in the range of minutes to 6 h (Tree- Udom et al., 2015; Champion and Mitragotri, 2006). This study used 24 h post-exposure time, which is sufficient for cells to take up the particles irrespective of the shape or volume of the ASC and BSC particles. The TEM images support uptake (Fig. 5c and d) and qualitatively suggest no difference between ASC and BSC particles. More studies using monodisperse combustion particles with varying shapes and cellular collection at multiple time points would be required for clearer conclusions regarding the effect of shape on particle rate and mechanism of uptake.
The cytochrome P450, regulated by CYP1A1 gene expression, is responsible for the metabolism ofpoly-aromatic hydrocarbons (Shimada et al., 2001). Enhanced CYP1A1 gene expression in lung cells has been previously reported for exposure to combustion-derived particles due to the presence of PAHs on the combustion particle surface (Stoeger et al., 2009; Totlandsdal et al., 2010; Jaramillo et al., 2018). Totlandsdal et al. (2010) have observed a dose-dependent increase in the induction of CYP1A1 gene expression at concentrations <25 μg/mL of diesel exhaust particles in human bronchial epithelial cells BEAS-2B. Jaramillo et al. (2018) reported a higher CYP1A1 induction in lung cells (H441 and THP-1) after exposure to dodecane/alcohol-blended diesel, as compared to dodecane/biofuel-blended diesel, attributing to the higher concentration of PAHs in dodecane/alcohol-blended diesel. In this study, at the same mass dose, both the BSC and ASC particles induced an increase in CYP1A1 gene expression relative to the air control (Fig. 6d). The similar composition of ASC and BSC (Fig. 4) likely explains the similar induction in CYP1A1 response.
This study was a first step towards understanding the effect of shape in atmospherically relevant combustion particles on biological responses in an ALI exposure setting. Factors other than particle shape, including particle surface topography, stiffness, total particle charge, and extent of hydrophilicity (Augustine et al., 2020; Violi, 2016), which affect particle uptake, were not considered in this study. The contribution of these factors to combustion particle uptake remains unknown. The effect of surfactant layer, as released by the A549 cells at ALI, on the particle properties and possible interaction with cellular response was not considered. Also, the effect of possible agglomeration of particles after they deposit onto the cells would be worthy of investigation. The possible change in the morphology due to the uptake process itself requires further investigation. Further studies would be necessary to better understand the role of other metrics like particle surface area, number concentration, volume/mass of particles on cellular response.
In conclusion, this study demonstrated the ability to modify the shape of combustion particles in the laboratory in a way that mimics atmospheric transformations. It also applied a consistent mass dose of two particle shapes at ALI to co-cultured cells. The results suggest that both types of combustion particles (BSC and ASC) were ingested by the cells, and the particles induced a pro-inflammatory response and enhanced CYP1A1 gene expression compared to the air controls. In addition, the more compact (ASC) particles induced more early apoptosis and release of TNFα compared to the more fractal-like (BSC) particles. This suggests the role of particle morphology in facilitating cellular uptake and possible contribution of morphology to the increased toxicity of aged particles.
Supplementary Material
HIGHLIGHTS.
Water condensation-evaporation changes particle morphology from fractal-like to compact.
Compact particles induce more TNFa and early apoptosis than fractal-like particles.
Morphological changes during atmospheric aging may contribute to cell response.
Acknowledgment
The authors acknowledge the use of the University of Utah shared facilities of the Micron Microscopy Suite and the University of Utah USTAR shared facilities supported in part by the MRSEC Program of the NSF under Award (No. DMR-1121252). The authors acknowledge the use of BioRender.com used for graphical abstract.
Funding sources
Support for this research was provided by grants from the National Institute of Environmental Health Sciences, National Institutes of Health (5K25ES027504-02, R01ES024681, ES017431, and ES027015). This work was also supported by a Merit Research Grant from the Department of Veterans Affairs (660-D64122). This work was also supported by the University of Utah Flow Cytometry Facility in addition to the National Cancer Institute through Award Number 5P30CA042014-24.
Footnotes
Declaration of competing interest
The authors declare that they have no known competing financial interests or personal relationships that could have appeared to influence the work reported in this paper.
CRediT authorship contribution statement
Kamaljeet Kaur: Conceptualization, Methodology, Formal analysis, Investigation, Writing – original draft. Raziye Mohammadpour: Methodology, Investigation, Resources, Writing – review & editing. Hamidreza Ghandehari: Conceptualization, Resources, Writing – review & editing. Christopher A. Reilly: Conceptualization, Writing – review & editing. Robert Paine: Conceptualization, Writing – review & editing. Kerry E. Kelly: Conceptualization, Investigation, Resources, Supervision, Funding acquisition, Writing – original draft, Writing – review & editing.
Appendix A. Supplementary data
Supplementary data to this article can be found online at https://doi.org/10.1016/j.atmosenv.2022.119194.
References
- Antiñolo M, Willis MD, Zhou S, Abbatt JPD, 2015. Connecting the oxidation of soot to its redox cycling abilities. Nat. Commun 6 (1), 6812. 10.1038/ncomms7812. [DOI] [PMC free article] [PubMed] [Google Scholar]
- Atwi K, Wilson SN, Mondal A, Edenfield RC, Symosko Crow KM, El Hajj O, Perrie C, Glenn CK, Easley CA, Handa H, Saleh R, 2021. Differential response of human lung epithelial cells to particulate matter in fresh and photochemically aged biomass-burning smoke. Atmos. Environ, 118929 10.1016/j.atmosenv.2021.118929. [DOI] [Google Scholar]
- Augustine R, Hasan A, Primavera R, Wilson RJ, Thakor AS, Kevadiya BD, 2020. Cellular uptake and retention of nanoparticles: insights on particle properties and interaction with cellular components. Mater. Today Commun 25 (August), 101692 10.1016/j.mtcomm.2020.101692. [DOI] [Google Scholar]
- Bhandari J, China S, Chandrakar KK, Kinney G, Cantrell W, Shaw RA, Mazzoleni LR, Girotto G, Sharma N, Gorkowski K, Gilardoni S, Decesari S, Facchini MC, Zanca N, Pavese G, Esposito F, Dubey MK, Aiken AC, Chakrabarty RK, Moosmüller H, Onasch TB, Zaveri RA, Scarnato BV, Fialho P, Mazzoleni C, 2019. Extensive soot compaction by cloud processing from laboratory and field observations. Sci. Rep 9 (1) 10.1038/s41598-019-48143-y. [DOI] [PMC free article] [PubMed] [Google Scholar]
- Bhattarai C, Samburova V, Sengupta D, Iaukea-Lum M, Watts AC, Moosmüller H, Khlystov AY, 2018. Physical and chemical characterization of aerosol in fresh and aged emissions from open combustion of biomass fuels. Aerosol Sci. Technol 52 (11), 1266–1282. 10.1080/02786826.2018.1498585. [DOI] [Google Scholar]
- Br̊bäck L, Forsberg B, 2009. Does traffic exhaust contribute to the development of asthma and allergic sensitization in children: findings from recent cohort studies. Environ. Heal. A Glob. Access Sci. Source 8 (1). 10.1186/1476-069X-8-17. [DOI] [PMC free article] [PubMed] [Google Scholar]
- Champion JA, Mitragotri S, 2006. Role of target geometry in phagocytosis. Proc. Natl. Acad. Sci. U.S.A 103 (13), 4930–4934. 10.1073/pnas.0600997103. [DOI] [PMC free article] [PubMed] [Google Scholar]
- China S, Mazzoleni C, Gorkowski K, Aiken AC, Dubey MK, 2013. Morphology and mixing state of individual freshly emitted wildfire carbonaceous particles. Nat. Commun 4 (1), 1–7. 10.1038/ncomms3122. [DOI] [PMC free article] [PubMed] [Google Scholar]
- Chithrani BD, Chan WCW, 2007. Elucidating the mechanism of cellular uptake and removal of protein-coated gold nanoparticles of different sizes and shapes. Nano Lett. 7 (6), 1542–1550. 10.1021/nl070363y. [DOI] [PubMed] [Google Scholar]
- Chithrani BD, Ghazani AA, Chan WCW, 2006. Determining the size and shape dependence of gold nanoparticle uptake into mammalian cells. Nano Lett. 6 (4), 662–668. 10.1021/nl052396o. [DOI] [PubMed] [Google Scholar]
- Chowdhury PH, He Q, Carmieli R, Li C, Rudich Y, Pardo M, 2019. Connecting the oxidative potential of secondary organic aerosols with reactive oxygen species in exposed lung cells. Environ. Sci. Technol 53 (23), 13949–13958. 10.1021/acs.est.9b04449. [DOI] [PubMed] [Google Scholar]
- Chu B, Chen T, Liu Y, Ma Q, Mu Y, Wang Y, Ma J, Zhang P, Liu J, Liu C, Gui H, Hu R, Hu B, Wang X, Wang Y, Liu J, Xie P, Chen J, Liu Q, Jiang J, Li J, He K, Liu W, Jiang G, Hao J, He H, 2022. Application of smog chambers in atmospheric process studies. Natl. Sci. Rev 9 (2) 10.1093/NSR/NWAB103 nwab103. [DOI] [PMC free article] [PubMed] [Google Scholar]
- Dagher Z, Garçon G, Billet S, Gosset P, Ledoux F, Courcot D, Aboukais A, Shirali P, 2006. Activation of different pathways of apoptosis by air pollution particulate matter (PM2.5) in human epithelial lung cells (L132) in culture. Toxicology 225 (1), 12–24. 10.1016/j.tox.2006.04.038. [DOI] [PubMed] [Google Scholar]
- Daigneault M, Preston J.a., Marriott HM, Whyte MKB, Dockrell DH, 2010. The identification of markers of macrophage differentiation in PMA-stimulated THP-1 cells and monocyte-derived macrophages. PLoS One 5 (1), e8668. 10.1371/journal.pone.0008668. [DOI] [PMC free article] [PubMed] [Google Scholar]
- Diabaté S, Armand L, Murugadoss S, Dilger M, Fritsch-Decker S, Schlager C, Béal D, Arnal M-E, Biola-Clier M, Ambrose S, Mülhopt S, Paur H-R, Lynch I, Valsami-Jones E, Carriere M, Weiss C, 2020. Air–liquid interface exposure of lung epithelial cells to low doses of nanoparticles to assess pulmonary adverse effects. Nanomaterials 11 (1), 65. 10.3390/nano11010065. [DOI] [PMC free article] [PubMed] [Google Scholar]
- Geiser M, 2002. Morphological aspects of particle uptake by lung phagocytes. Microsc. Res. Tech 57 (6), 512–522. 10.1002/jemt.10105. [DOI] [PubMed] [Google Scholar]
- Hamilton RF, Wu N, Porter D, Buford M, Wolfarth M, Holian A, 2009. Particle length-dependent titanium dioxide nanomaterials toxicity and bioactivity. Part. Fibre Toxicol 6 (1), 1–11. 10.1186/1743-8977-6-35. [DOI] [PMC free article] [PubMed] [Google Scholar]
- Hawley B, McKenna D, Marchese A, Volckens J, 2014. Time course of bronchial cell inflammation following exposure to diesel particulate matter using a modified EAVES. Toxicol. Vitro 28 (5), 829–837. 10.1016/j.tiv.2014.03.001. [DOI] [PubMed] [Google Scholar]
- Al Housseiny H, Singh M, Emile S, Nicoleau M, Vander Wal RL, Silveyra P, 2020. Identification of toxicity parameters associated with combustion produced soot surface chemistry and particle structure by in vitro assays. Biomedicines 8 (9). 10.3390/BIOMEDICINES8090345. [DOI] [PMC free article] [PubMed] [Google Scholar]
- Huang X, Teng X, Chen D, Tang F, He J, 2010. The effect of the shape of mesoporous silica nanoparticles on cellular uptake and cell function. Biomaterials 31 (3), 438–448. 10.1016/j.biomaterials.2009.09.060. [DOI] [PubMed] [Google Scholar]
- Jaramillo IC, Sturrock A, Ghiassi H, Woller DJ, Deering-Rice CE, Lighty JS, Paine R, Reilly C, Kelly KE, 2018. Effects of fuel components and combustion particle physicochemical properties on toxicological responses of lung cells. J. Environ. Sci. Heal. Part A 53 (4), 295–309. 10.1080/10934529.2017.1400793. [DOI] [PMC free article] [PubMed] [Google Scholar]
- Kang S, Kim JE, Kim D, Woo CG, Pikhitsa PV, Cho MH, Choi M, 2015. Comparison of cellular toxicity between multi-walled carbon nanotubes and onion-like shell-shaped carbon nanoparticles. J. Nanoparticle Res 17 (9), 1–11. 10.1007/s11051-015-3181-4. [DOI] [Google Scholar]
- Kasurinen S, Happo MS, Rönkkö TJ, Orasche J, Jokiniemi J, Kortelainen M, Tissari J, Zimmermann R, Hirvonen M-R, Jalava PI, 2018. Differences between Co-cultures and monocultures in testing the toxicity of particulate matter derived from log wood and pellet combustion. PLoS One 13 (2), e0192453. 10.1371/journal.pone.0192453. [DOI] [PMC free article] [PubMed] [Google Scholar]
- Kaur K, Jaramillo IC, Mohammadpour R, Sturrock A, Ghandehari H, Reilly C, Paine R, Kelly KE, 2019. Effect of collection methods on combustion particle physicochemical properties and their biological response in a human macrophage-like cell line. J. Environ. Sci. Heal. Part A 54 (12), 1170–1185. 10.1080/10934529.2019.1632626. [DOI] [PMC free article] [PubMed] [Google Scholar]
- Kettler K, Veltman K, van de Meent D, van Wezel A, Hendriks AJ, 2014. Cellular uptake of nanoparticles as determined by particle properties, experimental conditions, and cell type. Environ. Toxicol. Chem 33 (3), 481–492. 10.1002/etc.2470. [DOI] [PubMed] [Google Scholar]
- Khan JZ, Sun L, Tian Y, Shi G, Feng Y, 2021. Chemical characterization and source apportionment of PM1 and PM2.5 in tianjin, China: impacts of biomass burning and primary biogenic sources. J. Environ. Sci 99, 196–209. 10.1016/j.jes.2020.06.027. [DOI] [PubMed] [Google Scholar]
- Lenz AG, Karg E, Lentner B, Dittrich V, Brandenberger C, Rothen-Rutishauser B, Schulz H, Ferron GA, Schmid O, 2009. A dose-controlled system for air-liquid interface cell exposure and application to zinc oxide nanoparticles. Part. Fibre Toxicol 6 (1), 32. 10.1186/1743-8977-6-32. [DOI] [PMC free article] [PubMed] [Google Scholar]
- Li JJ, Li JJ, Wang G, Ho KF, Dai W, Zhang T, Wang Q, Wu C, Li L, Li L, Zhang Q, 2021. Effects of atmospheric aging processes on in vitro induced oxidative stress and chemical composition of biomass burning aerosols. J. Hazard Mater 401, 123750 10.1016/J.JHAZMAT.2020.123750. [DOI] [PubMed] [Google Scholar]
- Livak KJ, Schmittgen TD, 2001. Analysis of relative gene expression data using realtime quantitative PCR and the 2–ΔΔCT method. Methods 25 (4), 402–408. 10.1006/meth.2001.1262. [DOI] [PubMed] [Google Scholar]
- Loret T, Peyret E, Dubreuil M, Aguerre-Chariol O, Bressot C, le Bihan O, Amodeo T, Trouiller B, Braun A, Egles C, Lacroix G, 2016. Air-liquid interface exposure to aerosols of poorly soluble nanomaterials induces different biological activation levels compared to exposure to suspensions. Part. Fibre Toxicol 13 (1), 58. 10.1186/s12989-016-0171-3. [DOI] [PMC free article] [PubMed] [Google Scholar]
- Ma X, Zangmeister CD, Gigault J, Mulholland GW, Zachariah MR, 2013. Soot aggregate restructuring during water processing. J. Aerosol Sci 66, 209–219. 10.1016/j.jaerosci.2013.08.001. [DOI] [Google Scholar]
- Maikawa CL, Zimmerman N, Rais K, Shah M, Hawley B, Pant P, Jeong C-H, Delgado-Saborit JM, Volckens J, Evans G, Wallace JS, Godri Pollitt KJ, 2016. Murine precision-cut lung slices exhibit acute responses following exposure to gasoline direct injection engine emissions. Sci. Total Environ 568 (August), 1102–1109. 10.1016/j.scitotenv.2016.06.173. [DOI] [PubMed] [Google Scholar]
- Manzano M, Aina V, Areán CO, Balas F, Cauda V, Colilla M, Delgado MR, Vallet-Regí M, 2008. Studies on MCM-41 mesoporous silica for drug delivery: effect of particle morphology and amine functionalization. Chem. Eng. J 137 (1), 30–37. 10.1016/j.cej.2007.07.078. [DOI] [Google Scholar]
- Nordin EZ, Uski O, Nyström R, Jalava P, Eriksson AC, Genberg J, Roldin P, Bergvall C, Westerholm R, Jokiniemi J, Pagels JH, Boman C, Hirvonen M-R, 2015. Influence of ozone initiated processing on the toxicity of aerosol particles from small scale wood combustion. Atmos. Environ 102, 282–289. 10.1016/j.atmosenv.2014.11.068. [DOI] [Google Scholar]
- Paur H-R, Cassee FR, Teeguarden J, Fissan H, Diabate S, Aufderheide M, Kreyling WG, Hänninen O, Kasper G, Riediker M, Rothen-Rutishauser B, Schmid O, 2011. In-vitro cell exposure studies for the assessment of nanoparticle toxicity in the lung—a dialog between aerosol science and biology. J. Aerosol Sci 42 (10), 668–692. 10.1016/j.jaerosci.2011.06.005. [DOI] [Google Scholar]
- Salatin S, Maleki Dizaj S, Yari Khosroushahi A, 2015. Effect of the surface modification, size, and shape on cellular uptake of nanoparticles. Cell Biol. Int 39 (8), 881–890. 10.1002/cbin.10459. [DOI] [PubMed] [Google Scholar]
- Schnitzler EG, Gac JM, Jäger W, 2017. Coating surface tension dependence of soot aggregate restructuring. J. Aerosol Sci 106, 43–55. 10.1016/j.jaerosci.2017.01.005. [DOI] [Google Scholar]
- Shimada T, Oda Y, Gillam EMJ, Guengerich FP, Inoue K, 2001. Metabolic activation of polycyclic aromatic hydrocarbons and other procarcinogens by cytochromes P450 1A1 and P450 1B1 allelic variants and other human cytochromes P450 in Salmonella typhimurium NM2009. Drug Metab. Dispos 29 (9), 1176–1182. [PubMed] [Google Scholar]
- Stoeger T, Takenaka S, Frankenberger B, Ritter B, Karg E, Maier K, Schulz H, Schmid O, 2009. Deducing in vivo toxicity of combustion-derived nanoparticles from a cell-free oxidative potency assay and metabolic activation of organic compounds. Environ. Health Perspect 117 (1), 54–60. 10.1289/ehp.11370. [DOI] [PMC free article] [PubMed] [Google Scholar]
- Tabei Y, Sugino S, Eguchi K, Tajika M, Abe H, Nakajima Y, Horie M, 2017. Effect of calcium carbonate particle shape on phagocytosis and pro-inflammatory response in differentiated THP-1 macrophages. Biochem. Biophys. Res. Commun 490 (2), 499–505. 10.1016/j.bbrc.2017.06.069. [DOI] [PubMed] [Google Scholar]
- Thurston GD, Burnett RT, Turner MC, Shi Y, Krewski D, Lall R, Ito K, Jerrett M, Gapstur SM, Diver WR, Pope CA, 2016. Ischemic heart disease mortality and long-term exposure to source-related components of U.S. Fine particle air pollution. Environ. Health Perspect 124 (6), 785–794. 10.1289/ehp.1509777. [DOI] [PMC free article] [PubMed] [Google Scholar]
- Tong H, Zavala J, McIntosh-Kastrinsky R, Sexton KG, 2019. Cardiovascular effects of diesel exhaust inhalation: photochemically altered versus freshly emitted in mice. J. Toxicol. Environ. Health Part A 82 (17), 944–955. 10.1080/15287394.2019.1671278. [DOI] [PMC free article] [PubMed] [Google Scholar]
- Totlandsdal AI, Cassee FR, Schwarze P, Refsnes M, Låg M, 2010. Diesel exhaust particles induce CYP1A1 and pro-inflammatory responses via differential pathways in human bronchial epithelial cells. Part. Fibre Toxicol 7 (1), 41. 10.1186/1743-8977-7-41. [DOI] [PMC free article] [PubMed] [Google Scholar]
- Tree-Udom T, Seemork J, Shigyou K, Hamada T, Sangphech N, Palaga T, Insin N, Pan-In P, Wanichwecharungruang S, 2015. Shape effect on particle-lipid bilayer membrane association, cellular uptake, and cytotoxicity. ACS Appl. Mater. Interfaces 7 (43), 23993–24000. 10.1021/acsami.5b06781. [DOI] [PubMed] [Google Scholar]
- van Poppel LH, Friedrich H, Spinsby J, Chung SH, Seinfeld JH, Buseck PR, 2005. Electron tomography of nanoparticle clusters: implications for atmospheric lifetimes and radiative forcing of soot. Geophys. Res. Lett 32 (24), L24811. 10.1029/2005GL024461. [DOI] [Google Scholar]
- Violi A, 2016. Effects of combustion-generated nanoparticles on cellular membranes. Combust. Sci. Technol 188 (4–5), 769–775. 10.1080/00102202.2016.1139370. [DOI] [Google Scholar]
- Wang G, Zhang X, Liu X, Zheng J, Chen R, Kan H, 2019. Ambient fine particulate matter induce toxicity in lung epithelial-endothelial Co-culture models. Toxicol. Lett 301, 133–145. 10.1016/j.toxlet.2018.11.010. [DOI] [PubMed] [Google Scholar]
- Win-Shwe T-T, Kyi-Tha-Thu C, Moe Y, Fujitani Y, Tsukahara S, Hirano S, 2016. Exposure of BALB/c mice to diesel engine exhaust origin secondary organic aerosol (DE-SOA) during the developmental stages impairs the social behavior in adult Life of the males. Front. Neurosci 9 10.3389/fnins.2015.00524. [DOI] [PMC free article] [PubMed] [Google Scholar]
- Yuan X, Zhang X, Sun L, Wei Y, Wei X, 2019. Cellular toxicity and immunological effects of carbon-based nanomaterials. Part. Fibre Toxicol 16 (1) 10.1186/s12989-019-0299-z. [DOI] [PMC free article] [PubMed] [Google Scholar]
- Zhang R, Khalizov AF, Pagels J, Zhang D, Xue H, McMurry PH, 2008. Variability in morphology, hygroscopicity, and optical properties of soot aerosols during atmospheric processing. Proc. Natl. Acad. Sci. U.S.A 105 (30), 10291–10296. 10.1073/pnas.0804860105. [DOI] [PMC free article] [PubMed] [Google Scholar]
- Zheng M, Yu J, 2016. The effect of particle shape and size on cellular uptake. Drug Deliv. Transl. Res 6 (1), 67–72. 10.1007/s13346-015-0270-y. [DOI] [PubMed] [Google Scholar]
- Zhu J, Chen Y, Shang J, Zhu T, 2019. Effects of air/fuel ratio and ozone aging on physicochemical properties and oxidative potential of soot particles. Chemosphere 220, 883–891. 10.1016/j.chemosphere.2018.12.107. [DOI] [PubMed] [Google Scholar]
Associated Data
This section collects any data citations, data availability statements, or supplementary materials included in this article.