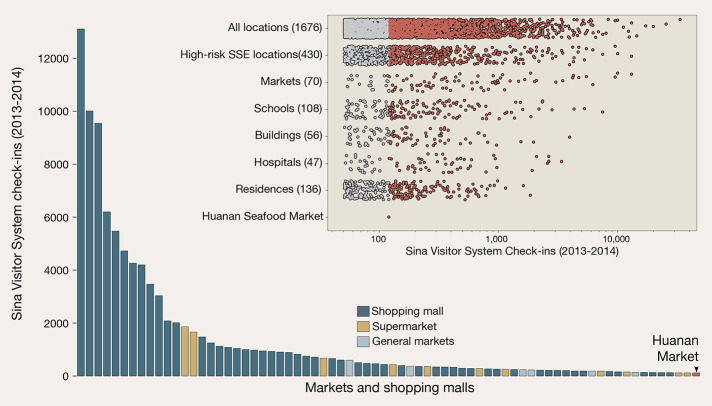
Fig. 3. Visitors to locations throughout Wuhan.
Number of social media check-ins in the Sina Visitor System from 2013-2014 as shared by ( 33 ). Number of visitors to individual markets throughout the city are shown in comparison to the Huanan market. Inset: the total number of check-ins to all individual locations across the city of Wuhan, grouped by category. Locations with more than 50 visitor check-ins are shown, and the locations which received more check-ins than the Huanan market in the same period are shown in red.

