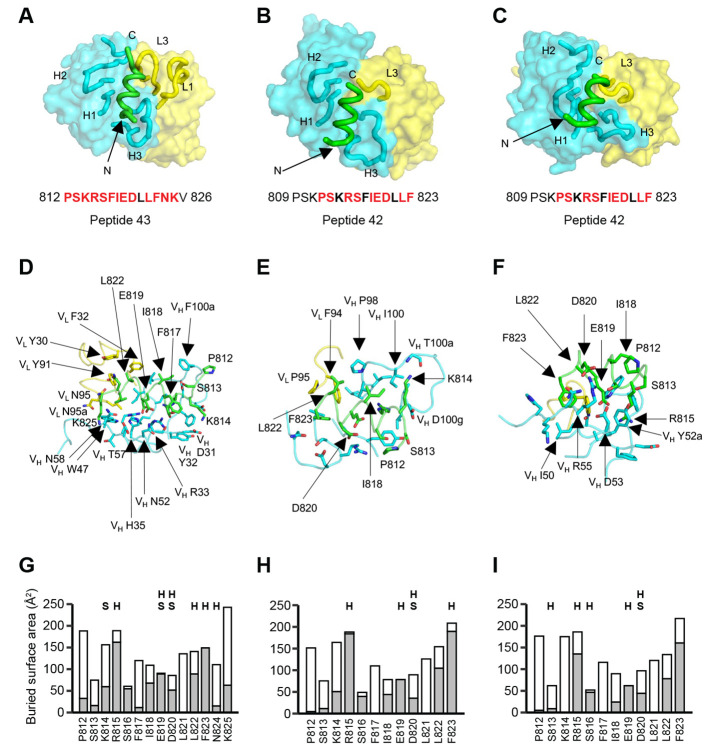
Fig. 4. Crystal structures of COV44-62, COV44-79, and COV91-27 in complex with SARS-CoV-2 fusion peptide.
(A to C) The overall interactions of (A) COV44-62, (B) COV44-79, and (C) COV91-27 with the fusion peptide. Fabs are shown in a molecular surface and the CDRs and peptides are represented as tubes. Cyan and yellow represent the heavy and light chains of the Fabs. Peptides are shown in green. H1, H2, H3, L1, and L3 denotes CDRs in the heavy (H) and light (L) chains. The resolution of the crystal structures are 1.46 Å, 2.8 Å, and 2.3 Å for the COV44-62, COV44-79, and COV91-27 complexes. Peptide residues observed in the crystal structure are in bold and residues involved in interaction with antibody (buried surface area >0 Å2) are in red. (D to F) Details of the interactions between (D) COV44-62, (E) COV44-79, and (F) COV91-27 with the fusion peptide. VH and VL indicate the variable domains of the heavy (H) and light (L) chains. Kabat numbering was used for the Fabs and numbering in the native spike protein for the fusion peptide. The colors for the heavy chain, light chain, and fusion peptide are as in (A). (G to I) Buried surface area (in gray) and accessible surface area (in white) of each residue of the fusion peptide in complex with antibody are shown in the stacked bar chart. Residues that form polar interactions with COV44-62, COV44-79, and COV91-27 are denoted with “H” if they form a hydrogen-bond or “S” for a salt bridge on top of the corresponding bar. Buried and accessible surface areas were calculated with PISA ( 44 ).

