

Abstract
Objective
To study clinical presentation, disease severity, pregnancy complications, and maternal outcomes in women affected with coronavirus disease 2019 (COVID‐19) during the third wave compared with the first and second waves of COVID‐19.
Methods
A retrospective, observational cohort study was conducted among 2058 pregnant and postpartum women with COVID‐19 admitted during three wave periods at a tertiary care COVID‐19‐dedicated hospital.
Results
The number of severe acute respiratory syndrome coronavirus 2 (SARS‐CoV‐2) ‐infected pregnant and postpartum women with symptoms of COVID‐19 was four times higher during the third wave compared with the first (odds ratio [OR] 4.6, 95% confidence interval [CI] 3.5–6.0, P < 0.001). There was a significantly lower proportion of pregnant and postpartum women with moderate to severe COVID‐19 during the third wave (0.6%, 2/318) compared with those during the first wave (2.4%, 27/1143, P < 0.001) and second wave (14.4%, 86/597, P < 0.001). The intensive care/high dependency unit admissions during the third wave were significantly lower (2.5%, 8/318) than during the second wave (14.7%, 88/597; OR 0.2, 95% CI 0.1–0.3, P < 0.001) but similar to the first wave (2.4%, 27/1143).
Conclusions
Decreased severity of COVID‐19, reduced maternal mortality, and morbidity were reported in the third wave compared with the first wave and second wave of COVID‐19 in the Mumbai Metropolitan Region, India.
Trial Registration
The study is registered with the Clinical Trial Registry of India (Registration no: CTRI/2020/05/025423).
Keywords: coronavirus disease 2019, maternal outcomes, Omicron, pregnancy complications, severe acute respiratory syndrome coronavirus 2 infection, third wave
Synopsis
Decreased severity of COVID‐19 and reduced maternal mortality were reported in the Omicron‐dominant third wave of COVID‐19 in Mumbai, India.
1. INTRODUCTION
A new severe acute respiratory syndrome coronavirus 2 (SARS‐CoV‐2) variant B.1.1.529 (Omicron) was reported from South Africa on November 24, 2021 and was declared as a variant of concern by WHO on November 26, 2021. 1 The dramatic rise in the number of COVID‐19 cases caused by highly transmissible Omicron in South Africa, the United Kingdom, and the USA was followed by a sudden rise in coronavirus disease 2019 (COVID‐19) cases reported in India from mid‐December 2021 onwards, indicating the beginning of the third wave of the COVID‐19 pandemic in India. As per the INSACOG (Indian SARS‐CoV‐2 Genomics Consortium) report of January 3, 2022, the Omicron variant is in the phase of community transmission in India, and was dominant in Mumbai as well as other metropolitan regions. 2 As of March 3, 2022, there were 42.9 million cases with 0.5 million deaths attributed to COVID‐19 in India. 3 Pregnant and postpartum women infected with SARS‐CoV‐2 were reported to have adverse outcomes during the first and second waves of COVID‐19 in India. 4 , 5 Moreover, the second wave of COVID‐19 was associated with a higher frequency of severe COVID‐19 disease, intensive care unit (ICU) or high dependency unit admission (HDU), and high maternal mortality compared with the first wave in Mumbai Metropolitan Region, India. 5 To date, no information is available on the impact of the third wave of COVID‐19 on pregnant and postpartum women in India. Here, we present data on clinical presentation, disease severity, pregnancy complications, and maternal outcomes in women affected with COVID‐19 during the third wave in India and the comparative analysis with the first and second waves of COVID‐19.
2. MATERIALS AND METHODS
We conducted a retrospective observational cohort study of pregnant and postpartum women with laboratory‐confirmed SARS‐CoV‐2, admitted to the BYL Nair Charitable Hospital (NH), Mumbai, India. NH is one of the network hospitals of the PregCovid registry and the only dedicated COVID‐19 tertiary care hospital, during most of the duration of all three waves catering to the most densely populated Mumbai Metropolitan Region (population 26 million). 6 Data were analyzed for the three‐wave periods: first wave, April 1, 2020 to January 31, 2021, second wave, February 1, 2021 to December 10, 2021; and third wave, December 18, 2021 to February 24, 2022 (Table 1). The hospital admission policy 6 was uniform during all three waves of the COVID‐19 pandemic period. The data were captured as per the standardized data collection methods of the PregCovid registry. 7 A total of 2058 pregnant and postpartum women with COVID‐19 were admitted during the first, second, and third waves of COVID‐19 at NH. The study was approved by the Ethics Committees of NH (ECARP#2020‐63) and ICMR‐NIRRH (ICEC#2020‐404). The study is registered with the Clinical Trial Registry of India (CTRI#2020‐025423). A waiver of consent was granted by the institute ethics committees because the data were collected from the medical case records of the pregnant women with COVID‐19.
TABLE 1.
Comparative analysis of clinical presentation, disease severity, and outcomes of SARS‐CoV‐2 infection in pregnant women during first, second, and third waves of COVID‐19 in Mumbai, India a
| Parameter | First wave (April 1, 2020 to January 31, 2021) | Second wave (February 1, 2021 to December 10, 2021) | Third wave (December 18, 2021 to February 24, 2022) | Second wave vs. first wave | Third wave vs. first wave | Third wave vs. second wave | |||
|---|---|---|---|---|---|---|---|---|---|
| OR (95% CI) | P value | OR (95% CI) | P value | OR (95% CI) | P value | ||||
| Demographic characteristics | |||||||||
| Total no. of pregnant and postpartum women managed at NH | 1143 | 597 | 318 | ||||||
| Age, years | 27 (24–30) | 28 (25–31) | 26 (24–29) | – | 0.07 | – | <0.01 | – | <0.001 |
| Clinical presentation | |||||||||
| Asymptomatic | 981 (85.8) | 363 (60.8) | 181 (56.9) | ||||||
| Symptomatic | 162 (14.2) | 234 (39.2) | 137 (43.1) | 3.9 (3.1–4.9) | <0.001 | 4.6 (3.5–6.0) | <0.001 | 1.2 (0.9–1.5) | 0.25 |
| Severity of COVID‐19 | |||||||||
| Mild | 135 (11.8) | 148 (25) | 135 (42.5) | ||||||
| Moderate and severe | 27 (2.4) | 86 (14.4) | 2 (0.6) | 2.9 (1.8–4.8) | <0.001 | 0.1 (0.0–0.3) | <0.001 | 0.0 (0.0–0.1) | <0.001 |
| Comorbidities | |||||||||
| Anemia (Hb <11 g/dl) | 484/1042 (46.4) | 356/597 (59.6) | 165/317 (52.1) | 1.7 (1.4–2.1) | <0.001 | 1.3 (1.0–1.6) | 0.08 | 0.7 (0.6–1.0) | 0.02 |
| Chronic hypertension | 14 (1.2) | 5 (0.8) | 3 (0.9) | 0.7 (0.2–1.9) | 0.46 | 0.8 (0.2–2.7) | 0.70 | 1.1 (0.3–4.7) | 0.87 |
| Diabetes mellitus | 8 (0.7) | 7 (1.2) | 1 (0.3) | 1.7 (0.6–4.7) | 0.31 | 0.4 (0.1–3.6) | 0.45 | 0.3 (0.0–2.2) | 0.22 |
| Bronchial asthma | 8 (0.7) | 4 (0.7) | 3 (0.9) | 1.0 (0.3–3.2) | >0.99 | 1.4 (0.4–5.1) | 0.66 | 1.4 (0.3–6.3) | 0.66 |
| Cardiac disease b | 8 (0.7) | 7 (1.2) | 4 (1.3) | 1.7 (0.6–4.7) | 0.31 | 1.8 (0.5–6.0) | 0.33 | 1.1 (0.3–3.7) | 0.91 |
| Hypothyroidism | 77 (6.7) | 48 (8.0) | 21 (6.6) | 1.2 (0.8–1.8) | 0.32 | 1.0 (0.6–1.6) | 0.93 | 0.8 (0.5–1.4) | 0.43 |
| Obstetrical characteristics | |||||||||
| Gestational age at COVID‐19 diagnosis, week | 38 (37–39) | 38 (31–39) | 38 (34.25–39) | – | <0.001 | – | <0.001 | – | 0.10 |
| Total delivery | 807 | 381 | 233 | – | – | – | – | – | – |
| Cesarean birth | 324 (40.1) | 145 (38.1) | 79 (33.9) | 0.9 (0.7–1.2) | 0.49 | 0.8 (0.6–1.0) | 0.09 | 0.8 (0.6–1.2) | 0.30 |
| Total births | 822 | 393 | 234 | ||||||
| Spontaneous preterm birth rate (per 1000 births) | 67 (81.5) | 42 (106.9) | 15 (64.1) | 1.4 (0.9–2.0) | 0.13 | 0.8 (0.4–1.4) | 0.36 | 0.6 (0.3–1.0) | 0.06 |
| Spontaneous abortions rate (per 1000 births) | 22 (26.8) | 30 (76.3) | 9 (38.5) | 3.0 (1.7–5.3) | <0.001 | 1.4 (0.7–3.2) | 0.37 | 0.5 (0.2–1.0) | 0.05 |
| Ectopic pregnancy rate (per 1000 births) | 3 (3.6) | 4 (10.2) | 2 (8.5) | 2.8 (0.6–12.6) | 0.17 | 2.3 (0.4–14.0) | 0.36 | 0.8 (0.1–4.5) | 0.82 |
| Stillbirth rate (per 1000 births) | 12 (14.6) | 13 (33.1) | 2 (8.5) | 2.3 (1.0–5.1) | 0.03 | 0.6 (0.1–2.6) | 0.47 | 0.2 (0.1–1.1) | 0.06 |
| Pregnancy complications; n for >20 weeks of pregnancy | 1103 | 535 | 291 | – | – | – | – | – | – |
| Gestational diabetes mellitus | 26 (2.4) | 28 (5.2) | 7 (2.4) | 2.3 (1.3–3.9) | 0.001 | 1.0 (0.4–2.4) | 0.96 | 0.4 (0.2–1.0) | 0.06 |
| Gestational hypertension | 53 (4.8) | 46 (8.6) | 23 (7.9) | 1.9 (1.2–2.8) | 0.001 | 1.7 (1.0–2.8) | 0.04 | 0.9 (0.5–1.5) | 0.73 |
| Pre‐eclampsia/eclampsia | 64 (5.8) | 36 (6.7) | 25 (8.6) | 1.2 (0.8–1.8) | 0.46 | 1.5 (0.9–2.5) | 0.09 | 1.3 (0.8–2.2) | 0.32 |
| Eclampsia | 5 (0.4) | 2 (0.4) | 4 (1.4) | 0.8 (0.2–4.3) | 0.99 | 3.0 (0.8–11.5) | 0.01 | 3.7 (0.6–20.4) | 0.13 |
| Hemorrhagic complications c | 23 (2.1) | 7 (1.3) | 6 (2.1) | 0.6 (0.3–1.5) | 0.27 | 1.0 (0.3–2.5) | 0.98 | 1.6 (0.5–5.0) | 0.41 |
| COVID‐19 severity and outcomes | |||||||||
| ICU/HDU admissions | 27 (2.4) | 88 (14.7) | 8 d (2.5) | 7.2 (4.6–11.1) | <0.001 | 1.1 (0.5–2.4) | 0.87 | 0.2 (0.1–0.3) | <0.001 |
| Case fatality rate | 8 (0.7) | 38 (6.4) | 1 (0.3) | 9.6 (4.5–20.8) | <0.001 | 0.4 (0.0–3.6) | 0.45 | 0.0 (0.0–0.3) | <0.01 |
| Maternal mortality ratio (per 1000 births) | 8 (9.7) | 38 (96.7) | 1 (4.3) | 10.9 (5.0–23.5) | <0.001 | 0.4 (0.1–3.5) | 0.44 | 0.0 (0.0–0.3) | 0.001 |
| Completely vaccinated for COVID‐19 | 0 | 0 | 20 (6.3) | – | – | – | – | – | – |
| Partial vaccination for COVID‐19 | 0 | 0 | 20 (6.3) | – | – | – | – | – | – |
Abbreviations: CI, confidence interval; COVID‐19, coronavirus disease 2019; Hb, hemoglobin; ICU/HDU, intensive care/high dependency unit; NH, BYL Nair Charitable Hospital; OR, odds ratio; SARS‐CoV‐2, severe acute respiratory syndrome coronavirus 2.
Data are presented as median (interquartile range) or as number (percentage).
Cardiac disease includes rheumatic heart disease + congenital heart disease + peripartum cardiomyopathy.
Hemorrhagic complications include antepartum hemorrhage + postpartum hemorrhage + hemoperitoneum.
Out of eight ICU/HDU admissions during the third wave one was moderate COVID‐19, other six were not related to COVID‐19 severity; two were pulmonary edema secondary to severe preeclampsia/eclampsia (one had stillbirth and was on NIV, other needed invasive ventilation), one was eclampsia with posterior reversible encephalopathy syndrome (PRES), one was severe rheumatic mitral stenosis and two were ruptured ectopic (one with massive blood loss needing ionotropic support and the other had transfusion reaction).
Data are presented as frequency (%) or median (interquartile range) and odds ratio (OR) with 95% confidence interval (CI). Fisher exact or χ2 test for categorical variables and Mann–Whitney U test for continuous variables were applied for analysis of different waves of COVID‐19 at the significance level of P < 0.05. The statistical analysis was conducted using SPSS Statistics Base 26.0 (IBM, Armonk, NY, USA).
3. RESULTS
The Mumbai Metropolitan Region in Maharashtra, India experienced three distinct waves of COVID‐19 (Table 1; Figure 1). The median age of pregnant and postpartum women admitted with SARS‐CoV‐2 infection during the third wave was significantly lower than the first and second waves, respectively (P = 0.01, P = 0.001, respectively). The numbers of SARS‐CoV‐2‐infected pregnant and postpartum women with symptoms of COVID‐19 were four times higher during the third wave compared with the first wave (OR 4.6, 95% CI 3.5–6.0, P < 0.001). In contrast, there was a significantly lower proportion of pregnant and postpartum women with moderate to severe COVID‐19 during the third wave (0.6%, 2/318) compared with those during the first wave (2.4%, 27/1143, P < 0.001) and second wave (14.4%, 86/597, P < 0.001). The ICU/HDU admissions during the third wave were significantly lower (2.5%, 8/318) than those during the second wave (14.7%, 88/597; OR 0.2, 95% CI 0.1–0.3, P < 0.001) but similar to the first wave (2.4%, 27/1143). One maternal death was reported during the third wave up to February 24, 2022.
FIGURE 1.
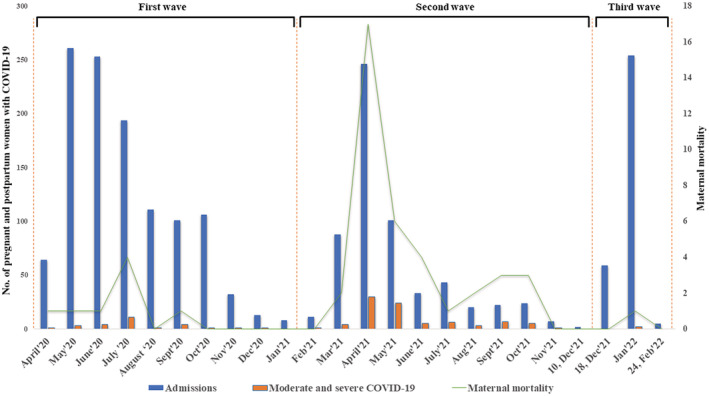
Timelines of the first, second, and third waves of coronavirus disease 2019 (COVID‐19) in Mumbai Metropolitan Region, India.
The proportion of pregnant and postpartum women with anemia was significantly lower during the third wave (52.1%, 165/317) compared with the second wave (59.6%, 356/597; OR 0.7, 95% CI 0.6–1.0, P < 0.02). The spontaneous preterm birth rate (per 1000 births) was lower during the third wave (64.1%, 15/234) compared with the second wave (106.9, 42/393) and first wave (81.5, 67/822); this difference did not reach statistical significance. The spontaneous abortion rate (per 1000 births) was higher during the third wave (38.5) than the first wave (26.8; P = 0.37) but significantly lower than the second wave (76.3; P = 0.05).
The frequency of gestational diabetes mellitus in pregnant women with SARS‐CoV‐2 infection was lower during the third wave (2.4%) compared with those during the second wave (5.2%) (OR 0.4, 95% CI 0.2–1.0, P = 0.06). Eclampsia was three times higher during the third wave compared with the second wave (OR 3.0, 95% CI 0.8–11.5, P = 0.01) and first wave (OR 3.7, 95% CI 0.6–20.4, P = 0.13). There were 6.3% (20/318) of pregnant women who received two doses of either Covaxin or Covishield (ChAdOx1 nCoV‐19) vaccines whereas partial vaccination was reported in 6.3% (20/318) of pregnant women admitted with COVID‐19 at NH during the third wave of COVID‐19.
4. DISCUSSION
The third wave of the SARS‐CoV‐2 outbreak has spread with unparalleled speed in the Mumbai Metropolitan Region compared with the two earlier waves. Hospital admissions increased rapidly within a period of 4 weeks during the third wave of COVID‐19. This exhibits a different transmission curve and epidemiologic profile from the previous two waves of COVID‐19 in India. During the first 4 weeks of this new COVID‐19 surge, we observed seven major differences among pregnant and postpartum women with COVID‐19 compared with the earlier two waves: (1) women in the younger age group were admitted during the third wave compared with the two earlier waves of COVID‐19; (2) the proportion of pregnant and postpartum women with symptomatic COVID‐19 was higher; (3) the proportions of moderate–severe disease, ICU/HDU admissions, and maternal mortality were lower compared with the earlier two waves; (4) spontaneous preterm birth rate per 1000 births was lower during the third wave compared with the earlier two waves; (5) spontaneous abortion rate per 1000 births was higher during the third wave than the first wave but lower than in the second wave; (6) gestational diabetes mellitus was lower during the third wave than the second wave, and (7) eclampsia was higher during the third wave compared with the two earlier waves. An important consideration in the interpretation of these results is that these are early observations from a single center representing a population of 26 million in the Mumbai Metropolitan Region, India.
The higher proportion of symptomatic COVID‐19 is likely due to immune evasion and potential intrinsic increased transmissibility of the new variant of concern, Omicron. 8 The decline in the proportion of severe COVID‐19 disease among pregnant and postpartum women during the third wave in India was similar to that in the general population as observed in South Africa. 8 , 9 The rise in symptomatic cases during the third wave could be the result of multiple factors including increasing awareness of COVID‐19 symptoms and early referral to the hospitals, better preparedness of the COVID‐19 hospitals with all specialties required to manage pregnant women with COVID‐19. The decline in severity of COVID‐19 may be attributed to the fact that Omicron causes less severe disease compared with Delta 10 , 11 and Omicron infection is mainly limited to the upper respiratory tract. 12 , 13 However, more data are needed to better understand the factors responsible for a higher number of symptomatic cases and decline in severe COVID‐19 cases during the third wave of COVID‐19.
Although the Government of India recommended the inclusion of pregnant women in the COVID‐19 vaccination schedule on July 2, 2021, there is still hesitancy for vaccination leading to low vaccination coverage in pregnant women; only 6.3% of pregnant women were found to have two doses of vaccination during the third wave.
Limitations of the study include the single‐center study and the non‐availability of genome sequencing data to confirm the SARS‐CoV‐2 variants during the three waves of the COVID‐19 pandemic. To conclude, early surveillance data indicate that the third wave is associated with higher number of symptomatic cases, lower severity, and lower fatality among pregnant and postpartum women with COVID‐19.
AUTHOR CONTRIBUTIONS
Niraj N. Mahajan and Rahul K. Gajbhiye had full access to all of the data in the study and take responsibility for the integrity of the data and the accuracy of the data analysis; they conceived and designed the study. Data were acquired and collected by Shweta Kesarwani, Chetna Salunke, Padmaja Kumbhar, Piyusha Yenkure, Juvairiya Shaikh, and Shrutika Shikhare, and were analyzed or interpreted by all authors. Rahul K. Gajbhiye and Niraj N. Mahajan drafted the manuscript, and Rahul K. Gajbhiye, Niraj N. Mahajan, and Smita D. Mahale critically revised the manuscript for important intellectual content. Niraj N. Mahajan and Rahul K. Gajbhiye performed the statistical analysis. Administrative and technical or material support were provided by Niraj N. Mahajan, Rahul K. Gajbhiye, Geetanjali Sachdeva, and Smita D. Mahale.
FUNDING INFORMATION
No external funding.
CONFLICT OF INTEREST
The authors have no conflicts of interest to declare.
ACKNOWLEDGMENTS
The authors sincerely thank the Network of National Registry of Pregnant women with COVID‐19 in India (CTRI/2020/05/025423). The Faculties, Resident doctors, and Interns in the Department of Obstetrics and Gynecology at TNMC, Mumbai, are sincerely acknowledged. The authors thank Dr. Periyasamy Kuppusamy, Ph.D., and Dr. Hrishikesh Munshi, MBBS, MPH, ICMR‐NIRRCH for their assistance in statistical analysis and preparation of the figure. The study is supported by an intramural grant from ICMR‐NIRRCH (ICMR‐NIRRCH/RA/01/1190). Dr. Rahul K Gajbhiye is an awardee of the DBT‐Wellcome India alliance clinical and public health intermediate fellowship (Grant no. IA/CPHI/18/1/503933).
Mahajan NN, Kesarwani S, Salunke C, et al. Clinical presentation, pregnancy complications, and outcomes of pregnant women with COVID‐19 during the Omicron‐dominant third wave in Mumbai, India. Int J Gynecol Obstet. 2022;00:1‐6. doi: 10.1002/ijgo.14348
Niraj N. Mahajan and Rahul K. Gajbhiye contributed equally.
DATA AVAILABILITY STATEMENT
The data that support the findings of this study are available from the corresponding author upon reasonable request. The data are not publically available due to privacy or ethical restrictions.
REFERENCES
- 1. World Health Organisation . Technical document: Enhancing response to Omicron SARS‐CoV‐2 variant. January 7, 2022. Accessed January 19, 2022. https://www.who.int/publications/m/item/enhancing‐readiness‐for‐omicron‐(b.1.1.529)‐technical‐brief‐and‐priority‐actions‐for‐member‐states
- 2. The Indian SARS‐CoV‐2 Genomics Consortium (INSACOG) weekly bulletin. January 3, 2022. Accessed January 24, 2022. https://dbtindia.gov.in/sites/default/files/INSACOG‐WEEKLY%20Bulletin_03‐01‐2022.pdf
- 3. MoHFW . Home. Accessed January 20, 2022. https://www.mohfw.gov.in/
- 4. Gajbhiye RK, Mahajan NN, Waghmare RB, et al. Clinical characteristics, outcomes, & mortality in pregnant women with COVID‐19 in Maharashtra, India: Results from PregCovid registry. Indian J Med Res. 2021;153:5‐6. [DOI] [PMC free article] [PubMed] [Google Scholar]
- 5. Mahajan NN, Pophalkar M, Patil S, et al. Pregnancy outcomes and maternal complications during the second wave of coronavirus disease 2019 (COVID‐19) in India. Obstet Gynecol. 2021;138(4):660‐662. [DOI] [PMC free article] [PubMed] [Google Scholar]
- 6. Mahajan NN, Pednekar R, Patil SR, et al. Preparedness, administrative challenges for establishing obstetric services, and experience of delivering over 400 women at a tertiary care COVID‐19 hospital in India. Int J Gynecol Obstet. 2020;151(2):188‐196. [DOI] [PMC free article] [PubMed] [Google Scholar]
- 7. Gajbhiye RK, Mahajan NN, Waghmare R, et al. Protocol for a prospective, hospital‐based registry of pregnant women with SARS‐CoV‐2 infection in India: PregCovid Registry study. BMJ Open. 2022; 12:e050039. doi: 10.1136/bmjopen-2021-050039 [DOI] [PMC free article] [PubMed] [Google Scholar]
- 8. Pearson CAB, Silal SP, Li MWZ, et al. Bounding the levels of transmissibility immune evasion of the Omicron variant in South Africa. medRxiv. 2021. doi: 10.1101/2021.12.19.21268038 [DOI] [Google Scholar]
- 9. Abdullah F, Myers J, Basu D, et al. Decreased severity of disease during the first global omicron variant covid‐19 outbreak in a large hospital in Tshwane, South Africa. Int J Infect Dis. 2022;116:38‐42. doi: 10.1016/j.ijid.2021.12.357 [DOI] [PMC free article] [PubMed] [Google Scholar]
- 10. Butt AA, Dargham SR, Chemaitelly H, et al. Severity of illness in persons infected with the SARS‐CoV‐2 delta variant vs beta variant in Qatar. JAMA Intern Med. 2021;182:197‐205. doi: 10.1001/jamainternmed.2021.7949 [DOI] [PMC free article] [PubMed] [Google Scholar]
- 11. Dyer O. Covid‐19: Omicron is causing more infections but fewer hospital admissions than delta, South African data show. BMJ. 2021;375:n3104. [DOI] [PubMed] [Google Scholar]
- 12. Diamond M, Halfmann P, Maemura T, et al. The SARS‐CoV‐2 B.1.1.529 Omicron virus causes attenuated infection and disease in mice and hamsters. Res Sq. 2021. doi: 10.21203/rs.3.rs-1211792/v1 [DOI] [Google Scholar]
- 13. Zhao H, Lu L, Peng Z, et al. SARS‐CoV‐2 Omicron variant shows less efficient replication and fusion activity when compared with Delta variant in TMPRSS2‐expressed cells. Emerg Microbes Infect. 2022;11(1):277‐283. doi: 10.1080/22221751.2021.2023329 [DOI] [PMC free article] [PubMed] [Google Scholar]
Associated Data
This section collects any data citations, data availability statements, or supplementary materials included in this article.
Data Availability Statement
The data that support the findings of this study are available from the corresponding author upon reasonable request. The data are not publically available due to privacy or ethical restrictions.