

Abstract
Objective
There have been conflicting reports concerning weight gain among adults during the COVID‐19 epidemic. Although early studies reported large weight increases, several of these analyses were based on convenience samples or self‐reported information. The objective of the current study is to examine the pandemic‐related weight increase associated with the pandemic through May 2021.
Methods
A total of 4.25 million adults (18 to 84 years) in an electronic health record database who had at least two weight measurements between January 2019 and February 2020 and one after June 2020 were selected. Weight changes before and after March 2020 were contrasted using mixed‐effects regression models.
Results
Compared with the pre‐pandemic weight trend, there was a small increase (0.1 kg) in weight in the first year of the pandemic (March 2020 through March 2021). Weight changes during the pandemic varied by sex, age, and initial BMI, but the largest mean increase across these characteristics was < 1.3 kg. Weight increases were generally greatest among women, adults with BMI of 30 or 35 kg/m2, and younger adults.
Conclusions
The results indicate that the mean weight gain among adults during the COVID‐19 pandemic may be small.
Study Importance.
What is already known?
There have been conflicting reports concerning weight gain among adults during the COVID‐19 epidemic. Although early studies reported substantial weight increases (e.g., 0.7 kg per month), several of these analyses were based on convenience samples or self‐reported information.
What does this study add?
In a cohort of 4.25 million adults examined from January 2019 through May 2021 in an electronic health database, there was a small increase (0.1 kg) in weight in the first year of the pandemic (March 2020 through March 2021) compared with the pre‐pandemic trend. Weight changes during the pandemic varied by sex, age, and initial BMI, but the largest mean increase across these characteristics was < 1.3 kg.
How might these results change the direction of research or the focus of clinical practice?
Although some adults may have gained substantial weight during the COVID‐19 pandemic, the average weight gain during the pandemic may be much less than suggested by initial reports.
INTRODUCTION
Although the COVID‐19 pandemic and the subsequent mitigation strategies have had a significant impact on the lives and behaviors of many individuals, the effects of the pandemic on weight gain among adults in the United States are uncertain. A widely publicized study [1] reported a 0.7‐kg increase in weight per month (February through June 2020), which would equal 18.5 lb if extrapolated to 12 months, but these findings were based on 269 participants with a Bluetooth‐connected scale. A meta‐analysis [2] of 35 cross‐sectional studies and 1 cohort study among adults and older adolescents in various countries found an average 1.6‐kg increase in (self‐reported) weight from March to May 2020. An American Psychological Association press release [3] in March 2021 also indicated that among the 42% of adults who reported that they had gained weight during the pandemic, the mean weight increase was 29 lb (13 kg).
Other studies have indicated that pandemic‐related weight increases may be smaller than suggested by these reports. A longitudinal study without formal peer review, based on the electronic health records (EHR) of about 15 million adults in the United States, for example, concluded that the mean weight gain during the 12 months of the pandemic (through March 2021) was less than 0.5 kg [4]; this increase was similar to the annual increase before the pandemic. In addition, a large study of self‐reported, longitudinal data among adults in the United Kingdom found no change in mean weight after February 2020 [5].
Studies among children and adolescents may also be relevant, and four studies [6, 7, 8, 9] have found that BMI increases were larger during the pandemic than in previous years. For example, Lange et al. [7] reported that the rate of BMI increase was 0.05 kg/m2 per month before the pandemic and 0.1 kg/m2 per month during the pandemic. These increases, however, were most pronounced among 6‐ to 11‐year‐olds, with 18‐ to 20‐year‐olds showing a smaller increase in BMI during the pandemic than before the pandemic. Somewhat similar age interactions have been seen by others [6, 8]. Although increases in the prevalence of obesity were also reported in cross‐sectional analyses [9], this result may have been influenced by an ascertainment bias [10] because heavier children and adolescents may have been more likely to be examined during the pandemic.
It has been suggested that further studies are needed to assess potential group‐specific impacts of the COVID‐19 epidemic on body weight [2]. Therefore, we examine changes in weight among 18‐ to 84‐year‐olds from January 2019 through May 2021 among 4.24 million adults in a large EHR database to determine whether weight gain increased during the pandemic. We focus on differences in weight gain from January 2019 to February 2020 with those after March 2020.
METHODS
Data were obtained from IQVIA's Ambulatory Electronic Medical Records database (Version Q3, May 2021 data release), containing deidentified information recorded during outpatient encounters for a geographically diverse US patient population. This database contains the clinical data of approximately 80 million patients from January 2006 through May 2021 from all 50 states recorded by more than 100,000 providers affiliated with over 800 ambulatory large practices and physician networks. The data set contains key clinical variables, including laboratory values, patient vitals, health behaviors, diagnoses, and procedures. All data were extracted using the E360 Software‐as‐a‐Service Platform [11].
The extracted data comprises 43.7 million adults with weight and height measurements from 2009 through 2021. Overall, there are 360 million recorded weights and 297 million heights among these participants. We calculated age at the examination as the difference between the examination date and year of birth. To preserve confidentiality, years of birth before 1936 were re‐coded by IQVIA as 1936 so that the maximum age in 2021 would be 85 years. As the 1936 birth year contains several actual years of birth (e.g., 1936, 1935, 1934), we included only participants born in 1937 or later. The maximum age in the current study in 2021 is therefore 84 years.
These data were cleaned using the growthcleanr algorithm for adult data developed to accompany the growthcleanr pediatric algorithm [12, 13] used in previous studies [7, 14, 15]. This algorithm is designed to clean clinically obtained longitudinal weights and heights in EHR databases [16]. Many steps in both the pediatric and adult algorithms are similar and they rely on the deviation of a value from an exponentially weighted moving average (EWMA) of a participant's other weights and heights.
There are, however, several differences between adult and pediatric algorithms. Although the EWMA in the pediatric algorithm uses SD scores to account for the expected changes in weight and height with sex and age, the adult algorithm uses the actual weight and height values. The height algorithm for adults differs from the children's algorithm because little change is expected among adults. Furthermore, most repeated values are retained in the adult data but are coded as “carried forwards” in the pediatric algorithm.
Of the 360 million weights, 2.1% were excluded based on the growthcleanr algorithm. The largest exclusion categories were (a) identical same day (0.9%), (b) different values on same day (0.7%), (c) biologically implausible (0.2%), and (d) EWMA (0.2%). About 2.9% of the 297 million heights were excluded, with the largest categories being (1) heights of a participant that differed by more than 2 inches (1.3%), (2) identical same day (1.1%), and (3) different values on the same day (0.3%). The adult algorithm limits the weight range from 20 to 500 kg and the height range from 50 to 244 cm.
We restricted the analyses to the 16.1 million people examined after January 1, 2019, who were at least 18 years of age at their first examination. We also required participants to have (1) two or more visits in the pre‐pandemic period (January 1, 2019, through February 28, 2020) and (2) one or more visits after June 1, 2020. We chose the latter date as there was an approximately 50% decrease in the number of examinations conducted in the first few months of the pandemic, which could introduce a selection bias. For participants with more than one weight or height measurement in a given month, we selected one value at random. These criteria reduced the sample to 4.25 million participants with 30.1 million examinations. For weights (14%) without a recorded height on the same day, we used the median height of the participant (based on all height measurements) to calculate BMI.
The median number of visits in this sample was three in the pre‐pandemic period and two in the postpandemic period. Information on race and ethnicity was optionally reported in a single composite variable in the database. About 75% of the sample was White, and 8% was Black, but race/ethnicity was unknown for about 12% of the sample, and < 1% of the participants indicated that they were Hispanic. As the collection of race/ethnicity data in EHR can be inaccurate [17], we do not focus on this characteristic.
All analyses were performed in R.4.1.2 (R Foundation for Statistical Computing), and they are based on 4,246,001 participants examined from January 2019 through May 2021. After showing descriptive characteristics of the participants at their first and last examinations, we examined the mean monthly weights in 2020 and 2021 relative to those in 2019. These differences were calculated as the mean monthly weights in 2020 and 2021 minus the mean weight in the same month in 2019. Because the number of monthly examinations substantially decreased in April and May 2020, we also examined the possibility of a selection bias. This sensitivity analysis was limited to the 1 million 18‐ to 59‐year‐olds examined in April and May 2019. We contrasted the mean 2019 weights between those reexamined in April and May 2020 (26%) and those not reexamined (74%).
We then used mixed‐effects models [18, 19], which use all of the intercorrelated, serial data from a person, to examine the difference in the rate of weight change between the pre‐pandemic (before March 2020) and pandemic (after March 2020) periods in the cohort. These sex‐specific models included a random‐intercepts term to account for individual‐level heterogeneity, initial BMI, initial age, time (in years) relative to March 1, 2020, and pandemic period. The difference in the rate of weight change during the pandemic was assessed using an interaction term between the pandemic period (coded as 0 or 1) and time relative to March 1, 2020. These models allowed the weight change between the two periods to vary by sex, age, and BMI. We modeled BMI and age using natural splines [20] to account for nonlinearity.
The results of these models are displayed graphically for various combinations of sex, initial age (25, 40, 60, and 75 years), and initial BMI (25, 30, and 35 kg/m2). We also summarize the differences calculated from this model between the pre‐pandemic and pandemic changes in weight over 1 year. We refer to the difference in weight change during the pandemic and the weight change before the pandemic from these models as the excess weight gain during the pandemic. This is the weight gain during the pandemic in excess of that predicted by the pre‐pandemic trend in weight.
Given the very large sample size, we do not emphasize statistical significance in the results. For example, the F‐statistics for most terms in the mixed‐effects models were > 100.
RESULTS
Table 1 shows descriptive characteristics of the cohort at the first and last examinations. The mean initial ages were 59 years among men and 54 years among women. The mean BMI was about 30.5 kg/m2, 46% of the participants had obesity, and 8% (men) to 11% (women) had BMI ≥ 40 kg/m2. Among men, the mean initial weight of 96.4 kg decreased by 0.5 kg between the first and last examinations, whereas the mean weight of women increased by 0.1 kg.
TABLE 1.
Descriptive characteristics of the cohort at the first and last examinations a
| Males (n = 1,745,530) | Females (N = 2,500,471) | |||
|---|---|---|---|---|
| First exam | Last exam | First exam | Last exam | |
| Mean date of exam | 4/6/19 | 1/17/21 | 4/6/19 | 1/18/21 |
| Age (y) | 58.6 ± 15.0 | 60.4 ± 15.0 | 54.5 ± 16.7 | 56.3 ± 16.8 |
| Weight (kg) | 96.4 ± 21.2 | 95.9 ± 20.9 | 80.2 ± 21.2 | 80.3 ± 21.0 |
| BMI | 30.6 ± 6.1 | 30.4 ± 6.1 | 30.3 ± 7.6 | 30.3 ± 7.5 |
| BMI ≥ 25 kg/m2 | 84.0% | 82.9% | 72.9% | 73.2% |
| BMI ≥ 30 kg/m2 | 47.3% | 46.3% | 44.6% | 45.1% |
| BMI ≥ 40 kg/m2 | 7.5% | 7.4% | 11.0% | 11.2% |
Values are mean ± SD or percentage. The width of the 95% CI for each of the prevalences was about 0.1% because of the very large sample size.
Although there was only a minimal change in weight (and BMI) throughout the study period, we examined the possibility that weight increased during the first few months of the pandemic. Figure 1 shows the difference in the mean weights of participants by year and month in 2020 and 2021 versus 2019 (blue line at y = 0), with results stratified by sex (columns) and age (rows). For these differences, we subtracted the month‐specific mean 2019 weight from those in 2020 (denoted with 0) and 2021 (denoted with 1) within the four sex and age groups. Among participants < 60 years (top panels), mean weights were generally 0.5 to 1.5 kg higher in 2020 and 2021 than in 2019, with the largest differences (about 1.5 kg) occurring in April and May 2020. Differences across years among older participants (bottom panels) were smaller, with most weights in the pandemic period being slightly lower or very similar to those in 2019.
FIGURE 1.
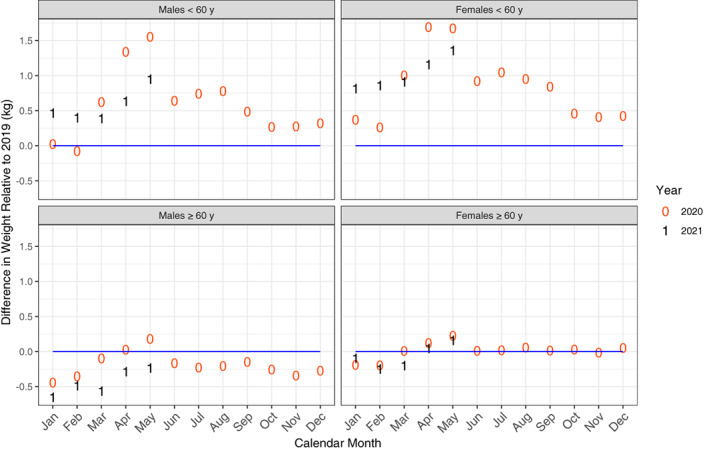
Differences in mean weights by calendar month (x‐axis) in 2020 (denoted by 0) and 2021 (denoted by 1) vs. those in 2019 (blue line at y = 0). Results are stratified by sex (columns) and age (rows). Values were calculated by subtracting the month‐specific mean 2019 weight in 2019 from those in 2020 (0) and 2021 (1). The first “1” among men < 60 years of age indicates that the mean weight in January 2021 was 0.47 kg higher than in January 2019 [Color figure can be viewed at wileyonlinelibrary.com]
Additional analyses, however, indicated that much of the difference in mean weights in April and May 2020 among the 18‐ to 59‐year‐olds may have resulted from a selection bias. Table 2 shows mean levels of various characteristics in April and May 2019 according to whether participants were reexamined in the same months in 2020. Only about one fourth of 18‐ to 59‐year‐olds examined in 2019 were reexamined in 2020. The mean 2019 weight among those reexamined in 2020 was 2.6 kg higher (90.8 vs. 88.2) than that of non–reexamined participants, a larger weight difference than seen in Figure 1. Adjustment for the slight differences in sex and age in the two groups did not substantially change the difference in 2019 mean weights according to reexamination status (data not shown).
TABLE 2.
Mean 2019 (April and May) levels of various characteristics among 18‐ to 59‐year‐olds according to whether they were reexamined in April or May 2020 a
| Reexamined in 2020 | ||
|---|---|---|
| No | Yes | |
| N | 739,977 | 259,828 |
| Females | 64.4% | 65.1% |
| Age (y) | 44.2 ± 12 | 45.5 ± 11 |
| Weight (kg) | 88.2 ± 24 | 90.8 ± 25 |
| Height in 2019 (cm) | 168.6 ± 10 | 168.5 ± 10 |
| BMI (kg/m2) | 30.9 ± 8.0 | 31.8 ± 8.0 |
| Obesity (%) | 48.2% (48.1, 48.3) | 53.5% (53.4, 53.7) |
| BMI ≥40 (%) | 12.1% (12.1, 12.2) | 14.9% (14.7, 15.0) |
Values are mean ± SD or percentage (95% CI).
We then examined the longitudinal change in weight between the last visit before the pandemic (mean date: December 7, 2019) and the last visit after the pandemic (mean date: January 17, 2021). Over this period, 15% of the sample lost more than 5% of pre‐pandemic weight, whereas 16% gained more than 5%. The mean weight changes in the two groups were −9.0 kg and +7.7 kg, respectively.
We then examined the trends in weight from January 2019 through May 2021 using mixed‐effects models that controlled for sex and initial levels of both age and BMI. These models indicated that the mean weight in May 2021 was about 0.1 kg higher in the cohort than expected had the pre‐pandemic trend continued. However, the effects of the pandemic on excess weight gain differed substantially by sex, initial BMI, and age.
Figure 2 presents the results of the mixed‐effects models that allowed the effects of the pandemic on weight to vary by sex, age, and BMI, with results shown for 48 combinations of these characteristics. All interactions were highly statistically significant because of the very large sample size. The effect of the pandemic on excess weight gain is illustrated by a change in the slope or a discontinuity in March 2020. For example, the predicted weight of a 25‐year‐old man with an initial BMI of 30 (dashed black line in upper middle panel) was 95.3 kg in March 2019, 96.2 kg in March 2020, and 97.9 kg in March 2021. Based on these predictions, weight increased by 0.9 kg in the year before the pandemic and increased by 1.7 kg in the year after March 2020. The difference (1.7–0.9) in weight change between these two periods indicated that, for this participant, the excess weight gain was 0.8 kg. Most lines in the figure were fairly linear between the two periods, indicating that excess weight gain was typically close to 0. Furthermore, in some groups (e.g., 60‐year‐old men with an initial BMI of 25), the predicted weight after 1 year of the pandemic was lower than expected based on the pre‐pandemic trend.
FIGURE 2.
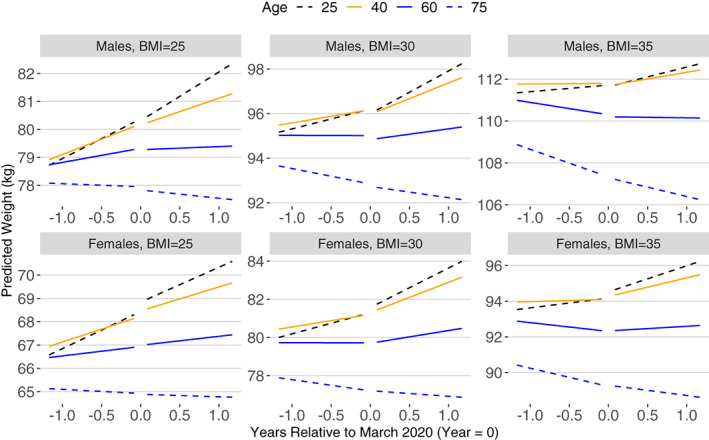
Predicted levels of weight by sex, BMI, and age based on sex‐specific mixed‐effects models. The x‐axis is time (y) relative to March 2020 [Color figure can be viewed at wileyonlinelibrary.com]
Table 3 summarizes the predicted increases in excess weight gain during the pandemic for the various combinations of sex, initial BMI, and age in Figure 2. (Values represent the difference between the 12‐month predicted change in weight after March 2020 and the 12‐month change in predicted weight before March 2020.) Although some 25‐year‐old women showed slightly more than a 1‐kg increase in excess weight, most groups showed smaller weight increases or even a decrease. In general, excess weight gain during the pandemic was (1) slightly larger for women than men, (2) most evident among adults with BMI of 30 or 35 kg/m2, and (3) larger among younger adults.
TABLE 3.
Excess weight (kg) gained in the year after March 2020 a
| Initial BMI | |||||
|---|---|---|---|---|---|
| Sex | Age (y) | 25 kg/m2 | 30 kg/m2 | 35 kg/m2 | 40 kg/m2 |
| Males | 25 | 0.26 b | 0.83 | 0.56 | −0.52 |
| 40 | −0.15 | 0.61 | 0.49 | −0.44 | |
| 60 | −0.44 | 0.31 | 0.44 | −0.03 | |
| 75 | −0.26 | 0.03 | 0.42 | 0.90 | |
| Females | 25 | 0.32 | 1.24 | 1.26 | 0.45 |
| 40 | 0.18 | 1.02 | 1.07 | 0.36 | |
| 60 | 0.05 | 0.66 | 0.78 | 0.43 | |
| 75 | 0 | 0.19 | 0.44 | 0.77 | |
Based on sex‐specific mixed‐effects regression models that allowed weight change to vary by pandemic period, initial age, and initial BMI.
The additional (excess) weight in the year after March 2020 was calculated as weight change in the first 12 months of the pandemic minus the weight change in the year preceding the epidemic.
DISCUSSION
In this large cohort of participants with a mean initial age of 56 years and a mean BMI of 30.4 kg/m2, weight gain was not strongly influenced by the COVID‐19 pandemic. Based on the results of the mixed‐effects models, the overall mean change in weight during the year preceding the pandemic was −0.12 kg, whereas the mean weight change in the year after March 2020 was −0.02 kg, an increase of 0.1 kg. Although weight changes associated with the pandemic varied by sex, initial BMI, and age, the maximum excess weight gain across various combinations of these characteristics in the first year of the pandemic (March 2020 through March 2021) was 1.25 kg (about 3 lb) among 25‐year‐old women who had BMI of 30 or 35 kg/m2. The small annual decrease in weight before the pandemic was unexpected but likely reflects the combination of weight gain among younger adults and weight loss among older adults.
Although some widely publicized studies [1, 3] reported large increases in weight during the pandemic, there are several possible limitations in these reports. For example, one study [1] consisted of 269 participants who owned a Bluetooth‐connected scale and were likely unrepresentative of all adults, whereas the other [3] was an online poll comprising 2013 adults. In contrast, our findings of a much smaller weight increase during the pandemic are based on EHR data from 4.25 million adults and are consistent with those of several other investigators [4, 5, 21, 22].
For example, a cohort study of 11,000 adults in Massachusetts found that obesity increased by 1% among women and decreased by 1% among men during the first 3 months of the pandemic [21]. Another study of 1.1 million adults in the United Kingdom and the United States, based on self‐reported data, found that similar proportions of participants either gained or lost weight during the pandemic [5]. Similarly, Alban et al. [4], in a journal not indexed by PubMed but based on longitudinal EHR data from 15 million adults, concluded that the rate of weight gain during the pandemic (April 2020 to March 2021) did not substantially differ from the trend in the pre‐pandemic period. Our finding that the pandemic weight increase was most evident among young adults is also consistent with the findings of others [21, 22].
Despite the large sample size of the current study, there are several limitations in the secondary analysis of EHR. Information is not always collected in a standardized way within or across practices, and the view of a patient captured in EHR is not a comprehensive record of all medical visits. However, because we were interested in weights between January 2019 and May 2021, the lack of information on a patient's entire history may be less critical. Also, the data in the current study are limited to encounters occurring in specific ambulatory settings, and the data are not representative of the US population [10, 23]. In EHR databases, weights and heights are measured only when an adult interacts with the medical system.
Furthermore, because we required each adult to have three medical encounters, our sample may be less healthy than the general US population. Additional analyses indicated that among white adults, the mean weight in the current study was about 3 (women) to 5 (men) kg higher than that in NHANES 2015–16 to 2017–18 (data not shown). There can also be many errors in recorded weights and heights in EHR data. Although we used an algorithm [16] to identify and exclude probable errors, we likely failed to exclude all errors and likely excluded some valid values. There are also data quality issues that data cleaning cannot address, such as small increases in weight in the winter due to heavier clothes.
It should also be noted that a large proportion (18.5%) of weights in the current study were identical to the previously recorded weight for that participant (about 98% of weights were recorded to the nearest pound). Although these repeated weights may represent actual values, some may have been carried forward. If a large number were simply carried forward, possibly because of an increase in the number of telehealth visits during the pandemic, this could have reduced the amount of pandemic weight gain. There was, however, no difference in the proportion of these identical, consecutive weights in the pre‐pandemic and pandemic periods. Furthermore, race/ethnicity was optionally reported and was missing for 12% of the sample. Therefore, we could not investigate if weight gain during COVID‐19 varied by race/ethnicity. However, analyses restricted to White (75% of the cohort) or Black (8.5%) participants indicated very little difference in the mean pandemic‐related weight change between these two groups.
Several aspects of the COVID‐19 pandemic can further complicate the data analysis. For example, in our EHR database, monthly examinations decreased from 1.3 to 1.5 million in January and February 2020 to 463,000 in April 2020. Because 20‐ to 59‐year‐olds examined in 2020 were about 2.6 kg heavier in 2019 than were participants not reexamined (Table 2), the higher mean weight in 2020 may have been primarily due to selection bias. This bias may have influenced the results of previous analyses based on cross‐sectional data [2, 9, 22]. Similarly, polls [3] may also be biased if people who gained weight were more likely to participate. Our longitudinal results may also have been biased if the decision to see a physician during the pandemic depended on recent weight gain or loss. We attempted to minimize this possibility by requiring participants to have been examined in June 2021 or after, when the number of examinations was 80% of that in January 2020. It should also be realized that the race/ethnicity distribution of the cohort differs substantially from the US population, but this may be partly due to the inaccuracies of this information in EHR databases [17].
Although the COVID‐19 pandemic had a significant impact on individuals' lives, livelihoods, and behaviors, we found little weight change among adults associated with the first year of the pandemic. Compared with expected weight changes based on pre‐pandemic trends, there was a small increase (0.1 kg) in weight among the 4.25 million adults in our study. Although weight changes varied by sex, age, and initial BMI, the maximum excess weight gain across various combinations of these characteristics was 1.3 kg among 25‐year‐old women with BMI of 30 or 35 kg/m2 in the first year of the pandemic. Adult weight gain during the pandemic may be much less than the amount suggested by several initial reports.
CONFLICT OF INTEREST
The authors declare no conflict of interest.
ACKNOWLEDGMENTS
The findings and conclusions in this report are those of the authors and do not necessarily represent the official position of the Centers for Disease Control and Prevention.
Freedman DS, Kompaniyets L, Daymont C, Zhao L, Blanck HM. Weight gain among US adults during the COVID‐19 pandemic through May 2021. Obesity (Silver Spring). 2022;30(10):2064‐2070. doi: 10.1002/oby.23511
REFERENCES
- 1. Lin AL, Vittinghoff E, Olgin JE, Pletcher MJ, Marcus GM. Body weight changes during pandemic‐related shelter‐in‐place in a longitudinal cohort study. JAMA Netw Open. 2021;4:e212536. doi: 10.1001/jamanetworkopen.2021.2536 [DOI] [PMC free article] [PubMed] [Google Scholar]
- 2. Bakaloudi DR, Barazzoni R, Bischoff SC, Breda J, Wickramasinghe K, Chourdakis M. Impact of the first COVID‐19 lockdown on body weight: a combined systematic review and a meta‐analysis. Clin Nutr. 2021;S0261‐5614:00207‐7. doi: 10.1016/j.clnu.2021.04.015 [DOI] [PMC free article] [PubMed] [Google Scholar]
- 3. American Psychological Association . One year on: Unhealthy weight gains, increased drinking reported by Americans coping with pandemic stress. Published March 11, 2021. https://www.apa.org/news/press/releases/2021/03/one-year-pandemic-stress
- 4. Alban C, Posner X, Fox B, Ruben‐Miller L. Pandemic pound theories don't hold weight. Published July 2, 2021. https://epicresearch.org/articles/pandemic-pound-theories-dont-hold-weight
- 5. Mazidii M, Leeming E, Merino J, et al. Impact of COVID‐19 on health behaviours and body weight: a prospective observational study in a cohort of 1.1 million UK and US individuals. Nat Food. 2021;2:957‐969. [Google Scholar]
- 6. Woolford SJ, Sidell M, Li X, et al. Changes in body mass index among children and adolescents during the COVID‐19 pandemic. JAMA. 2021;326:1434‐1436. [DOI] [PMC free article] [PubMed] [Google Scholar]
- 7. Lange SJ, Kompaniyets L, Freedman DS, et al. Longitudinal trends in body mass index before and during the COVID‐19 pandemic among persons aged 2‐19 years ‐ United States, 2018‐2020. MMWR Morb Mortal Wkly Rep. 2021;70:355‐361. [DOI] [PMC free article] [PubMed] [Google Scholar]
- 8. Brooks CG, Spencer JR, Sprafka JM, et al. Pediatric BMI changes during COVID‐19 pandemic: an electronic health record‐based retrospective cohort study. EClinicalMedicine. 2021;38:101026. doi: 10.1016/j.eclinm.2021.101026 [DOI] [PMC free article] [PubMed] [Google Scholar]
- 9. Jenssen BP, Kelly MK, Powell M, Bouchelle Z, Mayne SL, Fiks AG. COVID‐19 and changes in child obesity. Pediatrics. 2021;147:e2021050123. doi: 10.1542/peds.2021-050123 [DOI] [PubMed] [Google Scholar]
- 10. Phelan M, Bhavsar NA, Goldstein BA. Illustrating informed presence bias in electronic health records data: how patient interactions with a health system can impact inference. EGEMS (Wash DC). 2017;5:22. doi: 10.5334/egems.243 [DOI] [PMC free article] [PubMed] [Google Scholar]
- 11. IQVIA . E360 Real World Data Platform. https://www.iqvia.com/solutions/real-world-evidence/platforms/e360-real-world-data-platform
- 12. Daymont C, Ross ME, Russell Localio A, Fiks AG, Wasserman RC, Grundmeier RW. Automated identification of implausible values in growth data from pediatric electronic health records. J Am Med Inform Assoc. 2017;24:1080‐1087. [DOI] [PMC free article] [PubMed] [Google Scholar]
- 13. Daymont C. GrowthcleanR: R package for cleaning growth measurements. Updated July 25, 2022. https://github.com/carriedaymont/growthcleanr
- 14. Freedman DS, Goodman AB, King RJ, Kompaniyets L, Daymont C. The relation of adiposity rebound to subsequent BMI in a large electronic health record database. Child Obes. 2021;17:51‐57. [DOI] [PubMed] [Google Scholar]
- 15. Freedman DS, Goodwin Davies AJ, Phan T‐LT, et al. Measuring BMI change among children and adolescents. Pediatr Obes. 2022;17:e12889. doi: 10.1111/ijpo.12889 [DOI] [PMC free article] [PubMed] [Google Scholar]
- 16. Daymont C, Grundmeier RW, Miller J, Diego C. growthcleanr 2.0.0: Adult algorithm. Published August 24, 2022. https://carriedaymont.github.io/growthcleanr/articles/adult-algorithm.html
- 17. Klinger EV, Carlini SV, Gonzalez I, et al. Accuracy of race, ethnicity, and language preference in an electronic health record. J Gen Intern Med. 2015;30:719‐723. [DOI] [PMC free article] [PubMed] [Google Scholar]
- 18. Fitzmaurice GM, Ravichandran C. A primer in longitudinal data analysis. Circulation. 2008;118:2005‐2010. [DOI] [PubMed] [Google Scholar]
- 19. Bates D, Mächler M, Bolker B, Walker S. Fitting linear mixed‐effects models using lme4. J Stat Softw. 2015;67:1‐48. [Google Scholar]
- 20. Harrell FE. Regression Modeling Strategies: with Applications to Linear Models, Logistic Regression, and Survival Analysis. Springer; 2010. [Google Scholar]
- 21. Mulugeta W, Desalegn H, Solomon S. Impact of the COVID‐19 pandemic lockdown on weight status and factors associated with weight gain among adults in Massachusetts. Clin Obes. 2021;11:e12453. doi: 10.1111/cob.12453 [DOI] [PMC free article] [PubMed] [Google Scholar]
- 22. Valabhji J, Barron E, Bradley D, Bakhai C, Khunti K, Jebb S. Effect of the COVID‐19 pandemic on body weight in people at high risk of type 2 diabetes referred to the English NHS Diabetes Prevention Programme. Lancet Diabetes Endocrinol. 2021;9:649‐651. [DOI] [PMC free article] [PubMed] [Google Scholar]
- 23. McGee G, Haneuse S, Coull BA, Weisskopf MG, Rotem RS. On the nature of informative presence bias in analyses of electronic health records. Epidemiology. 2022;33:105‐113. [DOI] [PMC free article] [PubMed] [Google Scholar]