Abstract
Little is known about the characteristics of respiratory tract microbiome in Coronavirus disease 2019 (COVID‐19) inpatients with different severity. We conducted a study that expected to clarify these characteristics as much as possible. A cross‐sectional study was conducted to characterize respiratory tract microbial communities of 69 COVID‐19 inpatients from 64 nasopharyngeal swabs and 5 sputum specimens using 16S ribosomal RNA gene V3‐V4 region sequencing. The bacterial profiles were analyzed to find potential biomarkers by the two‐step method, the combination of random forest model and the linear discriminant analysis effect size, and explore the connections with clinical characteristics by Spearman's rank test. Compared with mild COVID‐19 patients, severe patients had significantly decreased bacterial diversity (p‐values were less than 0.05 in the alpha and beta diversity) and relative lower abundance of opportunistic pathogens, including Actinomyces, Prevotella, Rothia, Streptococcus, Veillonella. Eight potential biomarkers including Treponema, Leptotrichia, Lachnoanaerobaculum, Parvimonas, Alloprevotella, Porphyromonas, Gemella, and Streptococcus were found to distinguish the mild COVID‐19 patients from the severe COVID‐19 patients. The genera of Actinomyces and Prevotella were negatively correlated with age in two groups. Intensive care unit admission, neutrophil count, and lymphocyte count were significantly correlated with different genera in the two groups. In addition, there was a positive correlation between Klebsiella and white blood cell count in two groups. The respiratory tract microbiome had significant differences in COVID‐19 patients with different severity. The value of the respiratory tract microbiome as predictive biomarkers for COVID‐19 severity deserves further exploration.
Keywords: biomarker, COVID‐19, disease severity, respiratory tract microbiome
Abbreviations
- ASV
Amplicon Sequence Variant
- BMI
body mass index
- COVID‐19
Coronavirus disease 2019
- CRP
C‐reactive protein
- GRA
neutrophil count
- ICU
intensive care unit
- IQR
interquartile range
- LEfSe
linear discriminant analysis effect size
- LRT
lower respiratory tract
- LYMPH
lymphocyte count
- PCoA
principal coordinate analysis
- RDP
Ribosomal Database Project
- rRNA
ribosomal RNA
- RT
respiratory tract
- SARS‐CoV‐2
severe acute respiratory syndrome coronavirus 2
- URT
upper respiratory tract
- WBC
white blood cell count
1. INTRODUCTION
As an emerging infectious disease caused by severe acute respiratory syndrome coronavirus 2 (SARS‐CoV‐2), 1 coronavirus disease 2019 (COVID‐19) has spread throughout the world, causing more than 223 million confirmed cases and over 4.6 million deaths. 2 Since the World Health Organization (WHO) has declared COVID‐19 outbreak a global pandemic on March 11, 2020, 3 the pandemic has already brought an enormous threat to the global economy and public health burden.
SARS‐CoV‐2 may damage the epithelial barrier acutely and promote invasions of other pathogens. 4 Moreover, viral respiratory infections such as influenza virus and human coronavirus may lead to secondary bacterial and/or fungal infections which results in high mortality rate among patients, especially in high‐risk groups. 5 , 6 A systematic review showed that bacterial co‐infection was relatively infrequent in hospitalized patients with COVID‐19. 7 However, the occurrence and characterizations of bacterial infection in COVID‐19 patients remains poorly understood.
The bacterial communities of the upper respiratory tract (URT) can prevent respiratory pathogens from establishing an infection on the mucosal surface and spread to the lower respiratory tract (LRT) 8 and play an important role in human health. Concerns about biomarkers of the gut and respiratory microbiome in COVID‐19 patients have been raised. For instance, compared with healthy controls, a relative higher abundance of opportunistic pathogens, such as Streptococcus, Rothia, Veillonella, and Actinomyces was observed in COVID‐19 patients. 9 Moreover, according to previous studies, viral load, 10 acute severity, 11 , 12 host immunity, and pathogen susceptibility 13 were influenced by the viral–bacterial relationships. However, little is known about the interaction between respiratory tract (RT) microbiome and COVID‐19 severity, and no appropriate biomarkers are available to support the prognosis of the disease. A cross‐sectional study was conducted to explore the relationship between RT microbiome and COVID‐19 severity, which could provide a theoretical reference for clinical diagnosis and intervention.
2. MATERIALS AND METHODS
2.1. Study patients and specimens collection
From March 17, 2020 to March 28, 2020, 69 RT samples were collected from 69 patients in a COVID‐19 treatment hospital in Wuhan, China. These patients were diagnosed as confirmed COVID‐19 cases according to the Diagnosis and Treatment Protocol for Novel Coronavirus Pneumonia (Trial Version 7) released by National Health Commission & State Administration of Traditional Chinese Medicine. 14
If serial samples were collected from the same patient, only the first sample was included in the comparison of the microbiome in hospitalized COVID‐19 patients with different disease severity. A total of 69 cases were classified as moderate cases, severe cases and critical cases. Finally, 41 moderate cases were classified as mild group, 26 severe cases, and 2 critical cases were combined into severe group for the further study.
Sixty‐four nasopharyngeal swabs, five sputum samples were collected at admission from hospitalized COVID‐19 patients and stored at −80°C until analysis after collection. Moreover, all blood samples from all patients were stored at room temperature and then were used to analyze routine blood parameters and inflammatory factors by the conventional laboratory methods. All detailed information of clinical characteristics for patients were presented in Supporting Information: Table S1.
2.2. DNA extraction
Total microbial DNA was extracted from all samples using RT gene detection kit (Capital Bio Corporation) following the manufacturer's protocol. A beat‐beating step was used to lyse bacteria, so that nucleic acids were released into the solution of nucleic acid extraction, and finally the purpose of extracting nucleic acids was achieved. When extracting nucleic acids from sputum samples, it is important to transfer each sputum sample to a sterile centrifuge tube and then add equal volume of 10% NaOH, respectively. Next, these tubes containing sputum samples were vibrated by pulse‐vortexing and then liquefied for 30 min at 37°C, to achieve better effect in the following operation. When the liquefied sputum samples with no sense of stickiness and homogenization were ideal. Then taking the 1 ml liquefied from each sample into a 1.5 ml centrifuge tube, centrifuging for 5 min at 12 000 rpm, and then discarding the supernatant. Adding 1 ml washing solution to the centrifugal tube and vortexing oscillation, centrifuging for 5 min at 12 000 rpm and discarding the supernatant. Next, after adding 100 µl nucleic acid extraction solution to the centrifugal tube, the tube was placed in the rapid nucleic acid extractor and oscillated 5 min with the maximum vibration velocity. Finally, putting these tubes in a 95°C dry bath for heating 5 min and then centrifuging 3 min at 10 000 rpm. All samples were stored at −80°C until shipment to Beijing Genomics Institute for sequencing.
2.3. Sequencing and bioinformatics analysis
After PCR amplification targeting 16S ribosomal RNA (rRNA) sequencing of the V3‐V4 regions in an Illumina MiSeq platform with base‐pair reads, DNA libraries was generated. The samples were amplified using the 341F (ACTCCTACGGGAGGCAGCAG) and 806R (GGACTACHVGGGTWTCTAAT) primer pair and sequenced as previously described.
The raw sequencing reads were removed with primers and adapter contaminations using cutadapt v2.6 15 and quality‐filtered to obtain clean data. The quality‐filtered reads were denoised and generated Amplicon Sequence Variants (ASVs) by Divisive Amplicon Denoising Algorithm in Qiime2 (https://qiime2.org/). 16 Then, ASVs representative sequences were taxonomically classified using Ribosomal Database Project (RDP) Classifier (1.9.1) (http://rdp.cme.msu.edu/) 17 with a minimum confidence threshold of 0.6 against the 16S rRNA database (RDP: Release16 20160930). 18
Alpha diversity and beta diversity were estimated and rare faction curve was plotted by Microbiome Analyst 19 , 20 at the ASVs level, respectively. Alpha diversity was estimated by the Simpson index and Abundance‐based coverage estimator (ACE) index. Beta diversity analysis was performed by principal coordinate analysis (PCoA) of the ordination method based on the Bray–Curits index. For the important biomarkers identification, a two‐step method was adopted by MicrobiomeAnalyst (https://www.microbiomeanalyst.ca/). First step, a random forest model (ntree = 500) was used to estimate the difference between the two groups and top 10 genera were selected as candidate biomarkers by their contributions to classification accuracy (mean decrease accuracy). Second step, the linear discriminant analysis (LDA) effect size (LEfSe) method was used to distinguish between the mild group and the severe group and genera with LDA‐score> 4 21 , 22 were selected as candidate biomarkers. Finally, the common genera were identified as final biomarkers by the two‐step method.
2.4. Statistical analysis
As appropriate, comparisons between different rates or percentages were performed using the χ 2 test or the Fisher's Exact test. Continuous variables such as age, inpatient days and clinical laboratory test results were reported as median and interquartile range (IQR), and statistical comparisons by the Mann–Whitney U‐test. It was supposed to be the Point‐Biserial Correlation Coefficient, when we explored the relationships between partial clinical indexes as binomial variables and the top 10 genera. But we assigned these indexes as dummy variables and then explored the relationships directly through the Spearman's rank test. Spearman's rank test for correlation analysis between clinical indexes and enriched genera were plotted with R v3.4.1 software using psych, pheatmap, and corrplot packages, the other statistical analyses were used by SPSS software version 23.0. p < 0.05 is considered as statistically significant.
3. RESULTS
3.1. Demographic and clinical characterizations of patients
Demographic information and clinical characteristics of 69 COVID‐19 patients were shown in Table 1 and laboratory test indices between two groups were shown in Table 2. The median age of patients was 57 years (IQR: 49.5–70.5), the median of length of hospitalization was 12 days (IQR: 6.5–17.0) and 14 (34.1%) were men in the mild group. In the mild group, 73.2% of hospitalized patients had at least one underlying disease, and 4.9% were admitted into the intensive care unit (ICU). In the severe group, the median age was 71 years (IQR: 62.3–82.8) and the median duration of hospitalization was 18.5 days (IQR: 10.0–38.6) and 16 were men (57.1%). And there was 92.9% of the patients with underlying diseases and 32.1% of patients were admitted into the ICU.
Table 1.
Demographic and clinical characteristics between two patient groups
| Characteristics | Groups | p Valuea | |
|---|---|---|---|
| Mild group (n = 41) | Severe group (n = 28) | ||
| Age (median [IQR]) | 57.0 (49.5–70.5) | 71.0 (62.3–82.8) | 0.009 |
| BMI (kg/m2) | 25.0 (20.3–26.0) | 24.0 (20.5–27.2) | 0.869 |
| Inpatient days | 12.0 (6.5–17.0) | 18.5 (10.0–38.6) | 0.010 |
| Sex, male (%) | 14 (34.1) | 16 (57.1) | 0.058 |
| Symptoms (yes, %) | |||
| Cough | 31 (75.6) | 25 (89.3) | 0.154 |
| Diarrhea | 7 (17.1) | 4 (14.3) | 1.000 |
| Dyspnea | 4 (9.8) | 11 (39.3) | 0.003 |
| Coexisting disorders (%) | |||
| Any | 30 (73.2) | 26 (92.9) | 0.040 |
| Hypertension | 20 (48.8) | 17 (60.7) | 0.329 |
| Cardiopathy | 7 (17.1) | 8 (28.6) | 0.256 |
| ICU admission (%) | 2 (4.9) | 9 (32.1) | 0.007 |
| Death during hospitalization (%) | 2 (4.9) | 3 (10.7) | 0.389 |
Abbreviations: BMI, body mass index; ICU, intensive care unit; IQR, interquartile range.
p < 0.05 was considered statistically significant between the mild group and severe group.
Table 2.
Laboratory test results between two patient groups
| Indicators | Groups | p Valuea | |
|---|---|---|---|
| Mild group (n = 41) | Severe group (n = 28) | ||
| IgG (μg/ml, median [IQR]) | 121.3 (58.3–187.6) | 102.8 (55.6–188.1) | 0.903 |
| IgM (μg/ml, median [IQR]) | 16.3 (3.7–33.5) | 18.0 (5.8–39.0) | 0.961 |
| White blood cell count (×109/L) | 6.0 (5.2–8.0) | 7.6 (6.1–10.6) | 0.006 |
| Neutrophil count (×109/L) | 3.9 (3.1–4.7) | 5.7 (4.6–8.7) | 0.001 |
| Lymphocyte count (×109/L) | 1.6 (1.2–1.9) | 0.9 (0.5–1.8) | 0.006 |
| Hemoglobin (g/L) | 117.0 (100.5–133) | 111.5 (93.0–133.8) | 0.591 |
| C‐reactive protein (mg/L) | 4.0 (1.5–9.6) | 42.4 (15.3–72.3) | <0.001 |
| Procalcitonin (ng/m)b | 0.04 (0.03–0.17) | 0.15 (0.06–0.38) | 0.002 |
Abbreviations: IgG, Immunoglobulin G; IgM, Immunoglobulin M; IQR, interquartile range.
p < 0.05 was considered statistically significant between the mild group and severe group.
Partial data missing.
There were significant differences in age, inpatient days, dyspnea, coexisting disorders, ICU admission (p < 0.05) between the mild group and the severe group (p < 0.05). Significant differences were also found in white blood cell count (WBC), neutrophil count (GRA), lymphocyte count (LYMPH), C‐reactive protein (CRP), and procalcitonin between two groups (p < 0.05). However, there was missing data of procalcitonin in eight patients and it was not considered in the subsequent analysis.
3.2. Microbial richness, abundance, and diversity
Sixty‐nine specimens including 64 nasopharyngeal swabs and 5 sputum swabs were analyzed by 16S RNA gene sequencing to study the microbial composition of RT in COVID‐19 patients. After merging and filtering the raw reads data, 3 957 195 high‐quality sequence reads were saved for the subsequent analysis. To avoid analysis bias caused by different sequence reads of samples, all samples were rarefied to even sequencing depth based on the sample with the lowest sequencing depth. With the increase of sequencing depth, the rarefaction curves increased rapidly and then became flat (Figure 1), indicating that the sample sequencing data was reasonable and the quality of reads was good with certain depth and representativeness.
Figure 1.
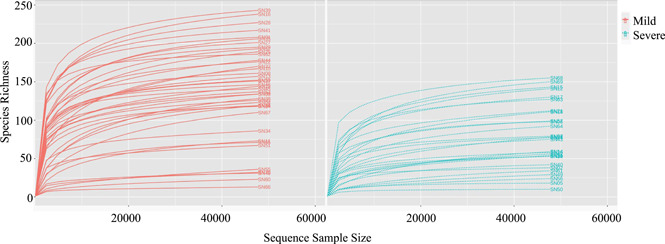
The rarefaction curves between the mild group and severe group. A curve represents a sample. The x‐axis indicates the number of clean reads randomly selected from a sample, and the y‐axis represents the species richness. Words "SN" plus a number indicates a specific sample.
According to Simpson diversity index (p = 0.0062) and ACE diversity index (p = 1.7474e−5), the microbial diversity and the richness of mean community were significantly higher in the mild group than the severe group (Figure 2A,B). PCoA based on Bray–Curtis distances displayed differences in both the mild group and severe group (analysis of similarities, R = 0.143, p < 0.003) (Figure 3).
Figure 2.
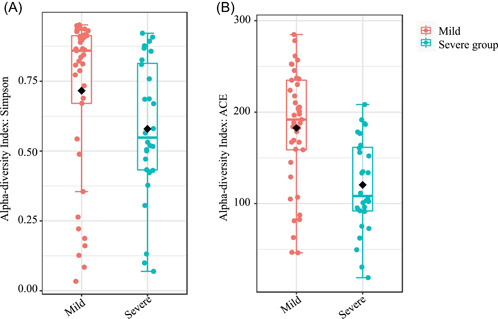
Alpha diversity between mild group and severe group. The Mann–Whitney U‐test was used to compare the (A) Simpson index (p = 0.0062) and (B) ACE (p = 1.7474e−5) index between the two groups, respectively. There were significant differences about the respiratory microbiome in the groups.
Figure 3.
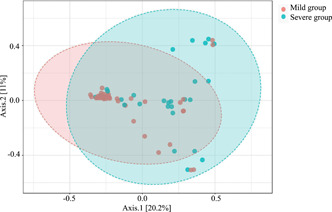
Beta diversity between mild group and severe group. PCoA of Bray‐Curtis distances indicated differences in the mild group (orange) and severe group (green). Each point represents one sample and each color shows all samples from the same group. R = 0.143, p < 0.003. PCoA, principal coordinate analysis.
3.3. Different bacterial taxonomic characterizations in the two groups
To investigate alterations in microbiome of the respiratory about COVID‐19 patients with different severity, we selected top 10 relative abundances at the phylum, class, order, family, and genus levels, respectively, and assessed differences by Mann–Whitney U‐test in the groups. Then, relative abundances with significant differences at different taxonomic levels were shown in Figure 4 and Supporting Information: Table S3. At the phylum level, the relative abundances of Fusobacteria and Bacteroidetes were lower in the severe group compared with the mild group (Figure 4A), which was probably due to significant decrease of Fusobacteriia and Bacteroidia at the class level (Figure 4B). At the class level, except the significant reduction in Bacteroidia and Fusobacteriia, the relative abundances of Clostridia and Negativicutes decreased in the severe group. At the order level (Figure 4C), there were seven significant orders including Bacteroidales, Clostridiales, Enterobacteriales, Fusobacteriales, Neisseriales, Pseudomonadales, Selenomonadales, among which the relative abundances of Selenomonadales and Bacteroidales in the mild group were higher than that in the severe group. However, the relative abundance of Pseudomonadales was lower in the mild group than that in the severe group. At the family level (Figure 4D), the relative abundances of Actinomycetaceae, Micrococcaceae, Prevotellaceae, Streptococcaceae, Veillonellaceae significantly decreased in the severe group compared to the mild group. At the genus level, the relative abundances of Actinomyces, Prevotella, Rothia, Streptococcus, Veillonella decreased in the severe group (Figure 4E) and this taxonomy bar plot showed the main species composition of each sample (Figure 5, Supporting Information: Table S2), respectively.
Figure 4.
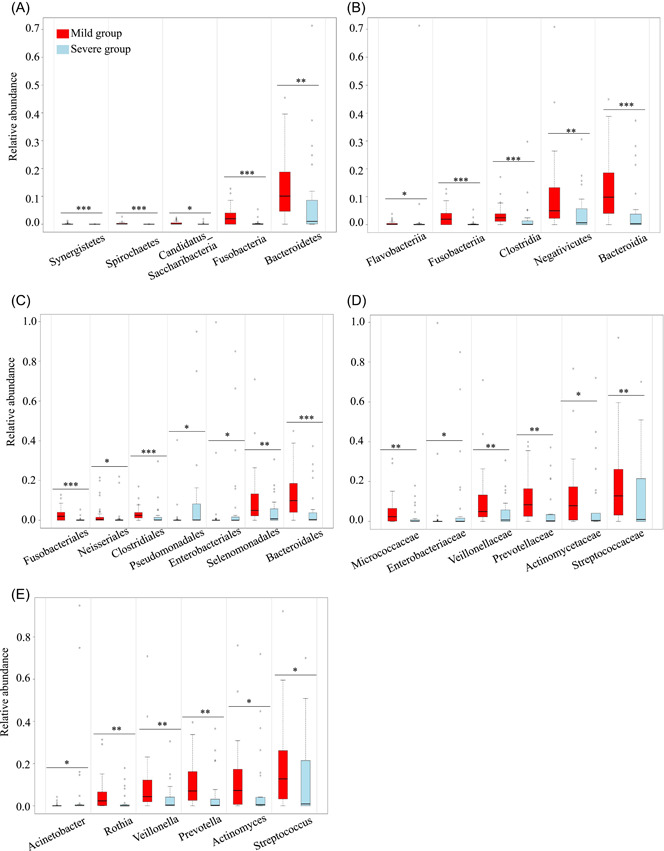
Taxonomic differences of top 10 in the respiratory microbiome beween the mild group and the severe group. Comparison of the significant relative abundance at the phylum (A), class (B), order (C), family (D), genus (E) levels in the groups. Each box shows the relative abundance levels of respiratory microbes in the mild group (red) and the severe group (blue) and the black line represents median abundance. Each hollow circle represents these extreme values. All significant taxa were selected by Mann–Whitney U‐test (*p < 0.05; **p ≤ 0.01; ***p ≤ 0.001).
Figure 5.
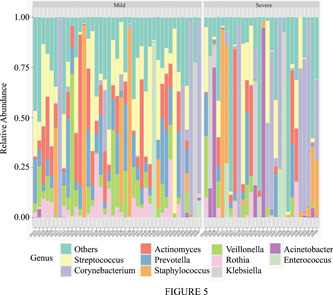
Taxonomy bar plot showing the top 10 microbiome profile at phylum level. This bar plot shows the main species composition of each sample in the two groups at the genus level, respectively.
3.4. Biomarkers exploration in the different groups
The random forest model was used to distinguish the different genera of respiratory microbiome between the two groups. The differential genera were ranked by their contribution to the mild and severe disease groups and then the top 10 genera were selected as candidate biomarkers (Figure 6A).
Figure 6.
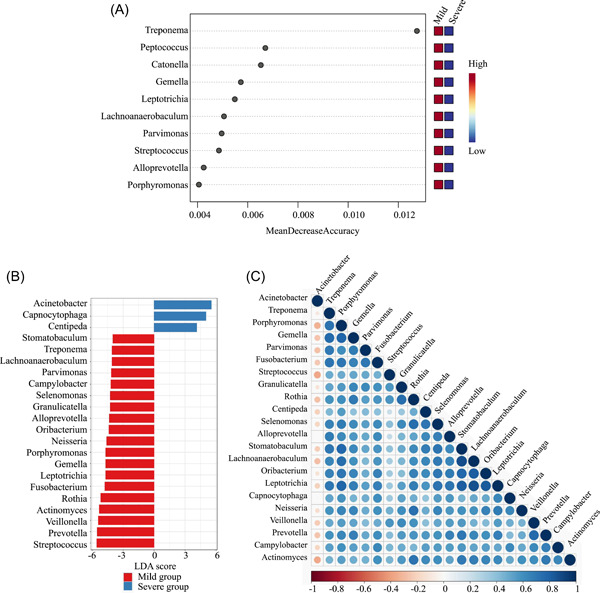
Screening of potential biomarkers and exploration of their correlations. The x‐axis represents MeanDecreaseAccuracy and y‐axis indicates the genera; the greater mean decrease accuracy, the more important the genus(A). At the genus level, linear discrimination analysis (LDA)‐scores generated by the LDA effect size (LEfSe) analysis showed significant differences in the mild (red) and severe (blue) groups. LDA‐score threshold >4 (B). Spearman's rank correlation of different genera between the mild and severe group (C). Blue represents positive correlation and red represents negative correlation. The larger the circle and the deeper the color, the greater the correlation coefficient in genera.
LDA‐score > 4 by LEfSe analysis was conducted to select candidate biomarkers in the groups. Significant differences were found in 22 genera of Acinetobacter, Capnocytophaga, Centipeda, and so forth, between the mild group and severe group (Figure 6B). Finally, eight common genera (Treponema, Leptotrichia, Lachnoanaerobaculum, Parvimonas, Alloprevotella, Porphyromonas, Gemella, and Streptococcus) were selected to distinguish the two groups. The correlations of enriched genera were analyzed by Spearman's rank test to evaluate relationships among genera (Figure 6C). There were positive correlations across different genera with different degrees of COVID‐19 severity, except for Acinetobacter.
3.5. Association of respiratory microbiome composition with clinical characteristics and inflammatory fetures
Spearman's rank analysis was used to evaluate the relationships of correlation between top 10 genera and clinical characteristics (including age, inpatient days, dyspnea, coexiting diseases, and days in the ICU) and indexes (WBC, GRA, LYMPH, and CRP) in the mild group and severe group, respectively (Figure 7, Supporting Information: Table S4). According to Figure 7A,B, the genera of Actinomyces and Prevotella were negatively correlated with age in the two groups. The genera of Acinetobacter were positively and Streptococcus were negatively correlated with dyspnea in the severe group, but these genera were uncorrelated with dyspnea in the mild group. Moreover, inpatient days, ICU admission, GRA, and LYMPH were correlated with different genera in the two groups. In addition, there were a positive correlation between Klebsiella and WBC in two groups and a negative correlation between Rothia and WBC in the mild group. There was a positive correlation between Acinetobacter, Corynebacterium, and CRP in the severe group, while Actinomyces, Rothia, and Streptococcus were negatively correlated with CRP in the severe group. No significant correlations were found between top 10 genera and CRP in the mild group (Figure 7C,D).
Figure 7.
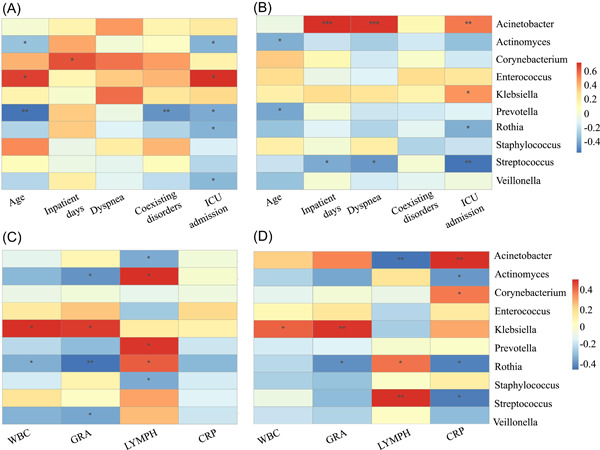
Association between clinical characteristics and genera (top 10 genera in terms of the relative abundance). Spearman's analysis was used to evaluate the correlation of genera and clinical indices in the mild group (A) and the severe group (B). And these laboratory test indices with significant differences in the mild group (C) and the severe group (D), respectively. Clinical variables include age, inpatient days, in the ICU and dyspnea and laboratory biomarkers include WBC, GRA, LYMPH, and CRP. A color gradient from blue (negative correlation) to red (positive correlation) indicates the degree of correlation. (*p < 0.05; **p ≤ 0.01; ***p ≤ 0.001).
4. DISCUSSION
In this cross‐sectional study, we explored connections between COVID‐19 inpatients with different severity and RT microbiome. While a large number of studies focused on SARS‐CoV‐2, there were few studies investigating alterations of the microbiome of RT between the mild and severe groups. URT is the entry point of respiratory viruses and bacterial pathogens. 8 The initial viral replication occurs in the nasal epithelia of COVID‐19 patients and when this initial response is insufficient, the virus migrates into the LRT and then results in moderate or severe COVID‐19. 23 Therefore, there is a need to understand the alterations of RT microbiome during SARS‐CoV‐2 infection.
In this study, we characterized the alterations of RT microbiome in COVID‐19 inpatients with different severity. Our results showed that there were significant differences between mild and severe groups, which is in accordance with previous studies. 11 , 12 Although these studies had various group reference standards, they all showed that microbiome diversity and abundance correlated inversely with disease severity of COVID‐19 inpatients.
Compared with the mild group, our study found there was a decreased relative abundance of opportunistic pathogens, including Actinomyces, Prevotella, Rothia, Streptococcus, Veillonella, in severe COVID‐19 patients. The relative abundance of Actinomyces, Rothia, and Streptococcus were negatively associated with CRP. Rothia was thought to play an important role in the pathogenesis of pneumonia, especially for patients with retained catheters and immunocompromised patients. 24 A study suggested that Rothia and Streptococcus were connected with susceptibility to secondary bacterial lung infection in patients of avian H7N9 virus infection. 25 Noteworthily, the level of Rothia might also affect the pathogenesis or disease severity of SARS‐CoV‐2 infection, and the changes of Rothia and Streptococcus might be associated with with susceptibility to secondary bacterial lung infection in patients of COVID‐19, while further explorations are needed.
Several bacterial taxa in RT microbiome have been found to be associated with disease severity in COVID‐19 inpatients and can become potential biomarkers to predict the development of disease, which was similar with previous studies. 22 Although we combined the random forest model and LEfSe to find these potential biomarkers, the final results were both partially overlapping and different. Therefore, it is necessary to find a more appropriate method to identify the microbial biomarkers. Most of our samples were nasopharyngeal swabs, which lead to final biomarkers associated with oral related bacteria. Thus, we hypothesized that the oral cavity may be a potential source of the pathogens that infect the lung. A study hypothesized that the genera of oral bacteria enriched in COVID‐19 such as Veillonella and Megasphaera may be pathogenic when transferred to other organs of the body, 26 which is in accordance with our hypothesis.
Another important finding was a core symbiotic relationships between most enriched genera in COVID‐19 inpatients with different disease severity, except there was the negative correlation between Acinetobacter and other enriched genera. More than one study about coinfection with Acinetobacter baumannii secondary to SARS‐CoV‐2 infections, particularly in ICU, during the COVID‐19 pandemic has been reported, 27 which suggested that there were nosocomial infections. Moreover, bacterial co‐pathogens are not only commonly identified in viral respiratory infections, but also important causes of exacerbating condition.
It was noteworthy that age might have influences on respiratory microbiome in COVID‐19 patients. When exploring the relationship between microbiome and inflammatory fetures, we found some opportunistic pathogens were significant correlated with CRP levels in severe patients, but not in mild patients. Previous studies have demonstrated a higher rate of co‐infections with bacteria in severe COVID‐19 patients 28 and common conditional pathogens in the RT could cause severe respiratory infections. 29 In addition, alteration of the microbiota profile with SARS‐CoV‐2 infection might be associated with disease severity. 30 It suggests that dysbacteriosis and bacteria infection were more likely to develop in severe patients.
Our study have several limitations. First, this study is an cross‐sectional study which makes it impossible to figure out whether the infection of SARS‐CoV‐2 affects the respiratory community or whether the dominated bacteria types of RT community selects a person to viral infection. This is a complex relationship. Second, there are some unknown classification taxa at the species level due to limiation of the 16S RNA sequencing. Third, there are still some confounding factors such as antibiotic use, age, and sex impacting the characteristics of RT microbiome in COVID‐19 inpatients. Though compared to the influence of SARS‐CoV‐2 infection, age and sex might have a limited effect on the overall composition of the RT microbiome. Thus, future studies should control or match these confounding factors. Lastly, our results should be extended cautiously, because our study only have less than 100 samples and cannot represent all population. In spite of these limitations, our study shed some light in the interactions between characteristics of respiratory bacterial microbiome and SARS‐CoV‐2 in COVID‐19 patients with different disease severity.
5. CONCLUSIONS
In this study, we have demonstrated that COVID‐19 disease severity can be predicted by RT microbiome compositions with high accuracy. Particularly, eight potential biomarkers can serve as indicator species to robustly predict the severity of SARS‐CoV‐2 infections. Our discovery about bacterial communities in COVID‐19 with different severity suggests that bacterial microbiome possibly plays an important role in clinical diagnosis.
AUTHOR CONTRIBUTIONS
Jiali Chen and Xiong Liu contributed equally to this article. Wei Liu, Chaojie Yang, Ruizhong Jia, Yuehua Ke, Jinpeng Guo, and Leili Jia collected the field samples and conducted the experiments. Jiali Chen, Xiong Liu, and Yong Chen conducted formal analysis. Yong Chen, Changjun Wang, Leili Jia, Xiong Liu, and Jiali Chen interpreted results and wrote the initial draft with all authors providing critical feedback and edits to subsequent revisions. All authors approved the final version of the manuscript.
CONFLICT OF INTEREST
The authors declare no conflict of interest.
ETHICS STATEMENT
This is a retrospective study. The study protocol was approved by the Ethics Committee of Chinese PLA Center for Disease Control and Prevention, and the requirement for informed consent was waived by the Ethics Committee.
Supporting information
Supporting information.
ACKNOWLEDGMENTS
The study was supported by a grant from National key research and development program (2019YFC1200500,2019YFC1200501), National Natural Science Foundation of China (12171295), Beijing Nova Program (Z181100006218107).
Chen J, Liu X, Liu W, et al. Comparison of the respiratory tract microbiome in hospitalized COVID‐19 patients with different disease severity. J Med Virol. 2022;94:5284‐5293. 10.1002/jmv.28002
Jiali Chen and Xiong Liu contributed equally to this study.
Contributor Information
Leili Jia, Email: jialeili@163.com.
Changjun Wang, Email: science2008@hotmail.com.
Yong Chen, Email: chenyonger@126.com.
DATA AVAILABILITY STATEMENT
The human metagenomics sequencing data during this study are available in the in the NCBI Sequence Read Archive (SRA) database and BioSample under accession number PRJNA780081. Other data that support the findings of this study are available from the corresponding author upon reasonable request.
REFERENCES
- 1. Chan JFW, Yuan S, Kok KH, et al. A familial cluster of pneumonia associated with the 2019 novel coronavirus indicating person‐to‐person transmission: a study of a family cluster. Lancet Lond Engl. 2020;395(10223):514‐523. 10.1016/S0140-6736(20)30154-9 [DOI] [PMC free article] [PubMed] [Google Scholar]
- 2.World Health Organization. WHO Coronavirus (COVID‐19) Dashboard: Global situation. Accessed September 13, 2021. https://covid19.who.int/
- 3. Cucinotta D, Vanelli M. WHO declares COVID‐19 a pandemic. Acta Biomedica. 2020;91:157‐160. [DOI] [PMC free article] [PubMed] [Google Scholar]
- 4. de Wit E, van Doremalen N, Falzarano D, Munster VJ. SARS and MERS: recent insights into emerging coronaviruses. Nat Rev Microbiol. 2016;14(8):523‐534. 10.1038/nrmicro.2016.81 [DOI] [PMC free article] [PubMed] [Google Scholar]
- 5. Bakaletz LO. Viral‐bacterial co‐infections in the respiratory tract. Curr Opin Microbiol. 2017;35:30‐35. 10.1016/j.mib.2016.11.003 [DOI] [PMC free article] [PubMed] [Google Scholar]
- 6. Zhou F, Yu T, Du R, et al. Clinical course and risk factors for mortality of adult inpatients with COVID‐19 in Wuhan, China: a retrospective cohort study. Lancet Lond Engl. 2020;395(10229):1054‐1062. 10.1016/S0140-6736(20)30566-3 [DOI] [PMC free article] [PubMed] [Google Scholar]
- 7. Langford BJ, So M, Raybardhan S, et al. Bacterial co‐infection and secondary infection in patients with COVID‐19: a living rapid review and meta‐analysis. Clin Microbiol Infect. 2020;26(12):1622‐1629. 10.1016/j.cmi.2020.07.016 [DOI] [PMC free article] [PubMed] [Google Scholar]
- 8. Man WH, de Steenhuijsen Piters WAA, Bogaert D. The microbiota of the respiratory tract: gatekeeper to respiratory health. Nat Rev Microbiol. 2017;15(5):259‐270. 10.1038/nrmicro.2017.14 [DOI] [PMC free article] [PubMed] [Google Scholar]
- 9. Gu S, Chen Y, Wu Z, et al. Alterations of the gut microbiota in patients with coronavirus disease 2019 or H1N1 influenza. Clin Infect Dis. 2020;71(10):2669‐2678. 10.1093/cid/ciaa709 [DOI] [PMC free article] [PubMed] [Google Scholar]
- 10. Rosas‐Salazar C, Kimura KS, Shilts MH, et al. SARS‐CoV‐2 infection and viral load are associated with the upper respiratory tract microbiome. J Allergy Clin Immunol. 2021;147(4):1226‐1233.e2. 10.1016/j.jaci.2021.02.001 [DOI] [PMC free article] [PubMed] [Google Scholar]
- 11. Merenstein C, Liang G, Whiteside SA, et al. Signatures of COVID‐19 severity and immune response in the respiratory tract microbiome. mBio. 2021;12(4):e0177721. 10.1128/mBio.01777-21 [DOI] [PMC free article] [PubMed] [Google Scholar]
- 12. Zhong H, Wang Y, Shi Z, et al. Characterization of respiratory microbial dysbiosis in hospitalized COVID‐19 patients. Cell Discov. 2021;7(1):23. 10.1038/s41421-021-00257-2 [DOI] [PMC free article] [PubMed] [Google Scholar]
- 13. Rashidi A, Ebadi M, Rehman TU, et al. Effect of COVID‐19 precautions on the gut microbiota and nosocomial infections. Gut Microbes. 2021;13(1):1‐10. 10.1080/19490976.2021.1936378 [DOI] [PMC free article] [PubMed] [Google Scholar]
- 14.National Health Commission & State Administration of Traditional Chinese Medicine. Clinical Protocols for the Diagnosis and Treatment of COVID‐19 (Trial Version 7). Published online March 3, 2020.
- 15. Marcel martin. Cutadapt removes adapter sequences from high‐throughput sequencing reads. EMBnet J. 2011;17:10‐12. [Google Scholar]
- 16. Bolyen E, Rideout JR, Dillon MR, et al. Reproducible, interactive, scalable and extensible microbiome data science using QIIME 2. Nat Biotechnol. 2019;37(8):852‐857. 10.1038/s41587-019-0209-9 [DOI] [PMC free article] [PubMed] [Google Scholar]
- 17. Wang Q, Garrity GM, Tiedje JM, Cole JR. Naive Bayesian classifier for rapid assignment of rRNA sequences into the new bacterial taxonomy. Appl Environ Microbiol. 2007;73(16):5261‐5267. 10.1128/AEM.00062-07 [DOI] [PMC free article] [PubMed] [Google Scholar]
- 18. Cole JR, Wang Q, Fish JA, et al. Ribosomal Database Project: data and tools for high throughput rRNA analysis. Nucleic Acids Res. 2014;42(Database issue):D633‐D642. 10.1093/nar/gkt1244 [DOI] [PMC free article] [PubMed] [Google Scholar]
- 19. Dhariwal A, Chong J, Habib S, King IL, Agellon LB, Xia J. MicrobiomeAnalyst: a web‐based tool for comprehensive statistical, visual and meta‐analysis of microbiome data. Nucleic Acids Res. 2017;45(W1):W180‐W188. 10.1093/nar/gkx295 [DOI] [PMC free article] [PubMed] [Google Scholar]
- 20. Chong J, Liu P, Zhou G, Xia J. Using MicrobiomeAnalyst for comprehensive statistical, functional, and meta‐analysis of microbiome data. Nat Protoc. 2020;15(3):799‐821. 10.1038/s41596-019-0264-1 [DOI] [PubMed] [Google Scholar]
- 21. Guan Y, Yang H, Han S, Feng L, Wang T, Ge J. Comparison of the gut microbiota composition between wild and captive sika deer (Cervus nippon hortulorum) from feces by high‐throughput sequencing. AMB Expr. 2017;7:212. 10.1186/s13568-017-0517-8 [DOI] [PMC free article] [PubMed] [Google Scholar]
- 22. Segata N, Izard J, Waldron L, et al. Metagenomic biomarker discovery and explanation. Genome Biol. 2011;12(6):R60. 10.1186/gb-2011-12-6-r60 [DOI] [PMC free article] [PubMed] [Google Scholar]
- 23. Murgolo N, Therien AG, Howell B, et al. SARS‐CoV‐2 tropism, entry, replication, and propagation: considerations for drug discovery and development. PLoS Pathog. 2021;17(2):e1009225. 10.1371/journal.ppat.1009225 [DOI] [PMC free article] [PubMed] [Google Scholar]
- 24. Ramanan P, Barreto JN, Osmon DR, Tosh PK. Rothia bacteremia: a 10‐year experience at Mayo Clinic, Rochester, Minnesota. J Clin Microbiol. 2014;52(9):3184‐3189. 10.1128/JCM.01270-14 [DOI] [PMC free article] [PubMed] [Google Scholar]
- 25. Lu HF, Li A, Zhang T, et al. Disordered oropharyngeal microbial communities in H7N9 patients with or without secondary bacterial lung infection. Emerg Microbes Infect. 2017;6(12):e112. 10.1038/emi.2017.101 [DOI] [PMC free article] [PubMed] [Google Scholar]
- 26. Ma S, Zhang F, Zhou F, et al. Metagenomic analysis reveals oropharyngeal microbiota alterations in patients with COVID‐19. Signal Transduct Target Ther. 2021;6(1):191. 10.1038/s41392-021-00614-3 [DOI] [PMC free article] [PubMed] [Google Scholar]
- 27. Rangel K, Chagas TPG, De‐Simone SG. Acinetobacter baumannii infections in times of COVID‐19 pandemic. Pathog Basel Switz. 2021;10(8):1006. 10.3390/pathogens10081006 [DOI] [PMC free article] [PubMed] [Google Scholar]
- 28. Feldman C, Anderson R. The role of co‐infections and secondary infections in patients with COVID‐19. Pneumonia. 2021;13:5. 10.1186/s41479-021-00083-w [DOI] [PMC free article] [PubMed] [Google Scholar]
- 29. Qin T, Wang Y, Deng J, et al. Super dominant pathobiontic bacteria in the nasopharyngeal microbiota cause secondary bacterial infection in COVID‐19 patients. Microbiol Spectr. 2022;10(3):e0195621. 10.1128/spectrum.01956-21 [DOI] [PMC free article] [PubMed] [Google Scholar]
- 30. Ezechukwu HC, Diya CA, Egoh IJ, et al. Lung microbiota dysbiosis and the implications of SARS‐CoV‐2 infection in pregnancy. Ther Adv Infect Dis. 2021;8:20499361211032452. 10.1177/20499361211032453 [DOI] [PMC free article] [PubMed] [Google Scholar]
Associated Data
This section collects any data citations, data availability statements, or supplementary materials included in this article.
Supplementary Materials
Supporting information.
Data Availability Statement
The human metagenomics sequencing data during this study are available in the in the NCBI Sequence Read Archive (SRA) database and BioSample under accession number PRJNA780081. Other data that support the findings of this study are available from the corresponding author upon reasonable request.


