Abstract
Purpose
Coronavirus disease 2019 (COVID‐19) is a recently declared worldwide pandemic. Triaging of patients into severe and non‐severe could further help in targeted management. “Potential severe patients” is a category of patients who did not have severe symptoms at their initial diagnosis, but eventually progressed to be severe patients and are easily overlooked in the early stage. This work aimed to develop and evaluate a CT‐based radiomics signature for the prediction of these potential severe COVID‐19 patients.
Methods
One hundred fifty COVID‐19 patients were enrolled and randomly divided into cross‐validation and independent test sets. First, their clinical characteristics were screened using the univariate and multivariate logistic regression step by step. Then, radiomics features were extracted from the lesions on their chest CT images. Subsequently, the inter‐ and intra‐class correlation coefficients (ICC) analysis, minimum‐redundancy maximum‐relevance (mRMR) selection, and the least absolute shrinkage and selection operator (LASSO) algorithm were used step by step for feature selection and construction of a radiomics signature. Finally, the screened clinical risk factors and constructed radiomics signature were combined for the combined model and Radiomics+Clinics nomogram construction. The predictive performance of the Radiomics and Combined models were evaluated and compared using receiver operating characteristic curve (ROC) analysis, Hosmer–Lemeshow test and Delong test.
Results
Clinical characteristics analysis resulted in the screening of five clinical risk factors. The combination of ICC, mRMR, and LASSO methods resulted in the selection of ten radiomics features, which made up of the radiomics signature. The differences in the radiomics signature between the potential severe and non‐severe groups in cross‐validation set and test sets were both p < 0.001. All Radiomics and Combined models showed a very good predictive performance with the accuracy and AUC of nearly or above 0.9. Additionally, we found no significant difference in the predictive performance between these two models.
Conclusions
A CT‐based radiomics signature for the prediction of potential severe COVID‐19 patients was constructed and evaluated. Constructed Radiomics and Combined model showed good feasibility and accuracy. The Radiomics+Clinical nomogram, acted as a useful tool, may assist clinicians to better identify potential severe cases to target their management in the COVID‐19 pandemic prevention and control.
Keywords: COVID‐19, CT radiomics, potential severe patient, prediction
1. INTRODUCTION
Coronavirus disease 2019 (COVID‐19)1 is currently a global pandemic with the number of confirmed cases crossing over 120 000 000.2 Based on the severity of the clinical symptoms, COVID‐19 patients can be divided into severe and non‐severe categories, and this triaging could further help in the targeted management. The main course of the management for non‐severe patients was isolation and general medication treatment,3 while the severe patients were the key treatment objects due to their high mortality rate and the lack of any specific treatments.4 Besides, there are some patients who did not have severe symptoms at their initial diagnosis, but eventually progressed to be severe patients.5 These “potential severe patients” are easily overlooked in the early stage of epidemic prevention and control, and usually have a poor prognosis. Therefore, it is important to predict the progress of the non‐severe patients and find an early evidence to identify the potential severe patients.
The diagnostic criterion of COVID‐19 mainly relies on real‐time reverse transcription polymerase chain reaction (RT‐PCR) test,6 while CT imaging is an effective auxiliary tool in COVID‐19 pneumonia diagnosis. In CT images, COVID‐19 pneumonia is typically manifested as ground‐glass opacity (GGO), local patchy shadows, and/or bilateral patchy shadows.7 Because of its high sensitivity, CT imaging is being used to screen COVID‐19 cases, and significant differences in CT imaging characteristics were found between different patients.8 Recently, there are some studies on CT images for grading COVID‐19 patients, but they mainly study whether the patient is currently severe 9 , 10 rather than whether it will progress to be severe patient. Besides, their research ideas mainly focused on qualitative descriptions such as GGO.11 We posit that radiomics studies,12,13 containing high‐throughput and high‐dimensional features that are obtained using quantitative analysis of image‐dependent greyscale, statistical and texture information, can be used in the prediction of the COVID‐19 disease course.14,15
In this study, we first screened the clinical characteristics of COVID‐19 patients, and then analyzed CT radiomics features through feature selection methods to construct the radiomics signature. Finally, we built a combined model by combining them together. The resultant models could help us better identify potential severe cases to target their management in the COVID‐19 pandemic prevention and control.
2. MATERIALS AND METHODS
2.1. Patients
This study was a retrospective study, which was approved by the Medical Ethics Committee of Zhongnan Hospital of Wuhan University (Approval number: 20200037). Informed consent was waived according to the CIMOS guideline. Using the Picture Archiving and Communications System (PACS), we searched for patients admitted between 20 January 2020 to 30 November 2021 in Zhongnan hospital of Wuhan University. Patients selection was based on the following criterion: (1) initial CT result was positive, which meant there were visible lesions (ground glass shadow or ground glass sign) in the images when they were admitted; (2) initial RT‐PCR result was positive, which meant that the patient has confirmed COVID‐19 infection when they were admitted; (3) initial clinical phenotyping was non‐severe and hospitalized with complete clinical data. This resulted in the selection of 150 patients. According to whether the patients have severe symptoms during their hospitalization, we obtained 74 potential severe patients (labeled as 1) and 76 non‐severe patients (labeled as 0). The detailed screening and grouping process of the patients in this study was shown in Figure S1, while the individual characteristics of the included patients is shown in Table 1.
2.2. Data flowchart
As seen in Figure 1, the data processing of this study could be divided into two parts. The first (Figure 1a) is the clinical characteristics screening, the second (Figure 1b) is the image analysis and radiomics modeling. Clinical characteristics analysis contained univariate logistic regression and multivariate logistic regression step by step, while image analysis contained image acquisition, image segmentation, feature extraction, feature reduction, and radiomics signature construction step by step. After the analysis of these two parts, the screened clinical risk factors and constructed radiomics signature were combined to construct the Combined model and Radiomics+Clinical nomogram.
FIGURE 1.
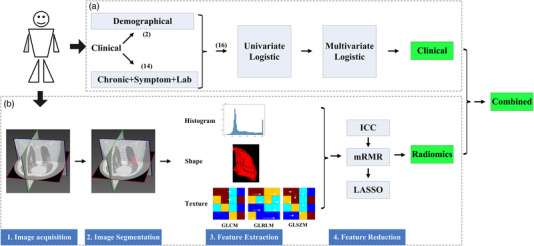
Data flowchart of this study. (a) The clinical characteristics analysis process; (b) the image features analysis and modeling process
As shown in Figure 2, the dataset of this study was first divided into a training set and an independent test set using a stratified random sampling method at a ratio of 8:2. The training set was used to build the model (including feature selection, Radiomics Modeling, and combined modeling), while the independent test set is used to evaluate the constructed models. All clinical feature screening, radiomics feature selection using minimum‐redundancy maximum‐relevance (mRMR) method, and combined model construction are directly conducted based on the complete training set (no hyperparameters need to be determined). Only in the radiomics model construction using least absolute shrinkage and selection operator (LASSO), the training set was divided into ten folds, and ten‐fold cross‐validation was performed to determine the optimal hyperparameter of the LASSO model: the penalty coefficient lambda. In this study, the constructed models were evaluated in both the complete training set and the independent test set.
FIGURE 2.
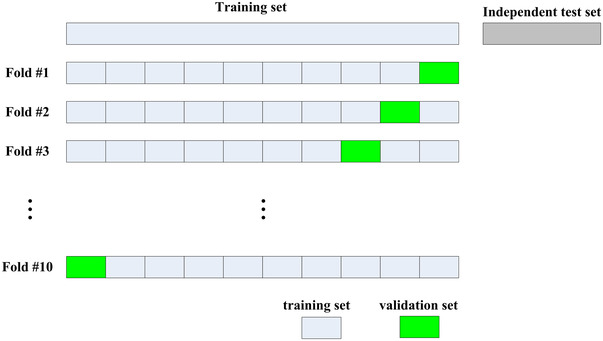
Dataset division scheme in this study
2.3. Clinical characteristics analysis
As shown in Table 1 and Figure 1a, two types of clinical characteristics were included in this study. One is the demographical characteristics which contained the age and gender, while the other is clinical records which contained chronic disease, main symptoms, and some laboratory findings. A univariate logistic regression analysis was carried out on the training set to evaluate the ability of a single variable to discriminate the potential severe patients from the non‐severe patients. The variables that were statistically significant (p < 0.05) were included in the multivariate logistic regression analysis to be further screened by a stepwise selection method.
TABLE 1.
The clinical characteristics and imaging parameters of the patients included
| Characteristics |
All subjects (n = 76) |
severe (n = 36) |
Non‐severe (n = 40) |
p‐Value |
|---|---|---|---|---|
| Demographics | ||||
| Age (years) | 53.91±18.17 | 65.19±16.06 | 43.75±13.42 | <0.001* |
| Men | 47 (61.84%) | 28 (77.78%) | 19 (47.50%) | 0.007* |
| Women | 29 (38.16%) | 8 (22.22%) | 21 (52.50%) | |
| Chronic diseases | ||||
| Hypertension | 19 (25.00%) | 18(50.00%) | 1 (2.5%) | <0.001* |
| Diabetes | 5 (6.58%) | 4(11.11%) | 1 (2.5%) | 0.294 |
| CVD | 8 (10.53%) | 5(22.22%) | 3 (0.00%) | 0.251 |
| COPD | 4(5.26%) | 4(11.11%) | 0 (0.00%) | 0.099 |
| Malignancy | 3 (3.95%) | 3(8.33%) | 0 (0.00%) | 0.203 |
| Main symptoms | ||||
| Fever | 56 (73.68%) | 24(66.67%) | 32 (80.00%) | 0.611 |
| Highest temperature (°C) | 38.00±0.98 | 37.98±1.18 | 38.02±0.78 | 0.863 |
| <37.3 | 19 (25.00%) | 11 (30.56%) | 8 (20%) | |
| 37.3 to 38.0 | 10 (13.16%) | 3 (8.33%) | 7 (17.5%) | |
| ≥38.0 | 46 (60.53%) | 21 (58.33%) | 25 (62.5%) | |
| Cough | 38 (50.0%) | 19 (52.78%) | 19 (47.5%) | 0.828 |
| Myalgia or fatigue | 47 (61.84%) | 25 (69.44%) | 22 (55%) | 0.299 |
| Headache | 7 (9.21%) | 3 (8.33%) | 4 (10%) | 0.884 |
| Diarrhea | 10 (1.32%) | 8 (22.22%) | 2(5%) | 0.06 |
| Dyspnea | 9 (1.18%) | 8 (22.22%) | 1 (2.50%) | 0.021* |
| Respiratory rate (bpm) | 20.99±4.67 | 22.06±6.08 | 20.025±2.08 | 0.072 |
| Laboratory findings | ||||
|
WBC (<3.5×10⁹/L) |
18 (23.68%) | 4 (11.11%) | 14 (35.00%) | <0.001* |
|
Lymphocyte (<1.1×10⁹/L) |
52 (68.42%) | 26 (72.22%) | 26 (65.00%) | 0.459 |
| Imaging Parameters | ||||
| Tube current(mAs) | 242.79±10.67 | 239.91±15.34 | 245.38±13.87 | 0.869 |
Notes: Data are mean ± SD, n (%)and N is the number of patients with available information. Respiratory rate represented the initial respiratory rate on admission or on the day when visiting doctor. p‐Value showed the significance of group difference between potential severe and non‐severe.
Abbreviations: COPD, chronic obstructive pulmonary disease; CVD, cardiovascular diseases; bpm, breaths per min; WBC, white blood cells.
2.4. CT imaging
Chest CT scans were performed using GE discovery 750HD scanner (GE Medical Systems, Milwaukee, WI, USA), with a reconstruction slice thickness = 1.25 mm, slice interval = 1.25 mm (filtered back projection reconstruction method), matrix size = 512 × 512, tube voltage = 120 kV and tube current 100–350 mA. Slice automatic tube current modulation technique was used, and there is no significant difference in tube current for the subjects between potential severe and non‐severe groups (Table 1). All images were then transmitted to the workstation and PACS for post‐processing.
2.5. Image processing
Before image processing, all images were first resampled into a same sampling size (1 mm*1 mm*1 mm) using the linear interpolation method. Then, the volumes of interest (VOIs) of the lesions areas in CT images were obtained using an semi‐automatic method: first automatically segmented using LK software (Lung intelligence Kit; GE Healthcare) and then validated by the radiologists through receiving a consensus. Two radiologists (R. Sun and L. Lan) completed the validation procedure for all the cases.
Feature extraction was done by using AK software (Artificial intelligence Kit; GE Healthcare). Radiomics features were calculated for the VOIs and a total of 402 features (supporting information) were obtained for each subject in the further modeling.
2.6. Feature reduction and Radiomics signature construction
As shown in Figure 1b, the inter‐ and intra‐class correlation coefficients (ICC) analysis was used to guarantee the reliability and repeatability of the image features (supporting information) and mRMR method was used to eliminate the redundant and irrelevant image features. The retained image features were used to construct the radiomics signature using LASSO method. LASSO was a linear regression method using L1 regularization, which could make the learned weights of some features 0, so as to achieve the purpose of feature sparseness and selection. In this study, LASSO method with 10‐fold cross‐validation was conducted to choose the optimized subset of features, and multivariate linear regression in LASSO method was used to construct the final model. Features with non‐zero coefficients were selected from the candidate features and were combined linearly to construct the radiomics signature.13
2.7. Combined model and Radiomics+Clinics nomogram construction
Combined model was constructed using multivariate logistic regression by combining the clinical risk factors with the radiomics signature, which was used as an independent risk factor in the Combined model. The Radiomics+Clinics nomogram transformed the Combined model into a simple and visual graph, making the results of the prediction model more prominent and of higher use value.
2.8. Model validation
The difference in the radiomics signature between the potential severe and non‐severe groups were compared using the Mann–Whitney U‐test in both training and test sets. The predictive ability of the Radiomics and Combined models were evaluated and compared using the receiver operating characteristic curve (ROC). Four ROC related metrics:16,17 area under the curve (AUC), accuracy (ACC), sensitivity and specificity were derived on both training and test sets. Hosmer–Lemeshow test was used to assess the uniformity between the observed and predicted values of the models. The calibration of the nomogram was assessed using calibration curves, which were used to compare the consistency between actual clinical observation and the nomogram‐prediction.
At last, the evaluation method of 100‐times repeated dataset randomly split was used, in which one hundred different randomly divisions were repeated on the entire dataset to obtain a couple of training set and independent test set for 100 times; then the modeling process including feature selection, model construction, and evaluation was repeated for 100 times. Finally statistical analysis on the value of each evaluation metrics obtained from 100 times dataset divisions was performed to obtain a more accurate and robust model evaluation results.
2.9. Statistics
All individual characteristic (including clinical characteristics and imaging parameters) results were reported in each group as mean ± standard value or proportion according to which they are continuous or categorical variables. Group difference comparisons for these variables were made between the potential severe group and non‐severe group, a two‐sided p < 0.05 was considered statistically significant. A chi‐square test or Fisher's exact test was used for the nominal variable, while Mann–Whitney test was used for the continuous variable with abnormal distribution.
All statistical analysis and processing were performed using R software (version3.6.1; http://www.Rproject.org). The following R packages were used: the “mRMRe” package was used to implement the mRMR algorithm, the “glmnet” was used to perform the LASSO logistic regression model, and the “pROC” package was used to construct the ROC curve.
3. RESULTS
3.1. Patients characteristics
A total of 150 patients with RT‐PCR‐confirmed COVID‐19 infection were enrolled into our study. According to our patients screening process (Figure S1), 74 of them progressed to be severe patients. The clinical characteristics of these patients are summarized in Table 1.
3.2. Clinical characteristics analysis
As shown in Figure 1a and Table 2, after the univariate and multivariate analysis between the clinical characteristics and the grouping labels, we found that age, sex, hypertension, diarrhea, and dyspnea turned out as the significant risk factors (p < 0.05) differentiating the potential severe patients, and were included in the combined model construction.
TABLE 2.
Clinical characteristics analysis for their prediction ability of potential severe patient
| Variable | Univariate analysis | Multivariate analysis | ||
|---|---|---|---|---|
| OR (95% CI) | p‐Value | OR (95% CI) | p‐Value | |
| Sex | 4.195 (1.326–13.268) | 0.015* | 19.982 (1.142–349.538) | 0.0403* |
| Hypertension | 19.8 (2.324–168.66) | 0.006* | 25.219 (0.55–1156.349) | 0.098’ |
| Diabetes | 54147942.979 (0.0, Inf) | 0.993 | ||
| CVD | 179898122.163 (0.0, Inf) | 0.993 | ||
| COPD | 54147942.978 (0.0, Inf) | 0.993 | ||
| Cancer | 19053830.527 (0.0, Inf) | 0.990 | ||
| Cough | 0.833 (0.281, 2.474) | 0.743 | ||
| Myalgia | 1.600 (0.542, 4.726) | 0.395 | ||
| Headche | 1.083 (0.141, 8.307) | 0.939 | ||
| Emesis | 3.900 (0.710, 21.417) | 0.117 | ||
| Dyspnea | 8.100 (0.902, 72.708) | 0.062 | ||
| Age | 1.115 (1.055, 1.179) | <0.001* | 1.08 (1.003–1.162) | 0.041* |
| Temperature | 0.971 (0.560, 1.683) | 0.916 | ||
| Respiratory_rate | 1.045 (0.918, 1.191) | 0.503 | ||
| WBC | 1.72(1.212‐2.441) | 0.002* | 1.881(1.083‐3.267) | 0.025* |
| Lymphocyte | 0.881 (0.461, 1.686) | 0.703 | ||
Notes: Respiratory rate represented the initial respiratory rate on admission or on the day when visiting doctor. Influence factors that were statistically significant in the univariate logistic analysis were then included in the multivariate analysis. p‐Value showed the significance of group difference between severe and non‐severe.
Abbreviations: COPD, chronic obstructive pulmonary disease; CVD, cardiovascular diseases; bpm, breaths per min; OR, odd rate; WBC, white blood cells.
3.3. Image analysis and modeling
As an example shown in Figure 3, the lesion area in CT images was semi‐automatically segmented as VOIs by the LK software and radiologists. Then, a total of 402 quantitative features was extracted from the VOIs of the chest CT images. After using ICC analysis and mRMR algorithm, 209 and 30 features were retained, respectively. As shown in Figure 1b, the retained imaging features were inputted into the LASSO model for radiomics signature construction. Ten0‐fold cross‐validation was used to determine the optimal lambda value (0.023) in the LASSO model. Ten features with non‐zero coefficients were selected for radiomics signature construction. The detailed process of feature selection and modeling using the LASSO algorithm is shown in Figure 4, and the final calculation formula of the radiomics signature was shown as follows:
FIGURE 3.
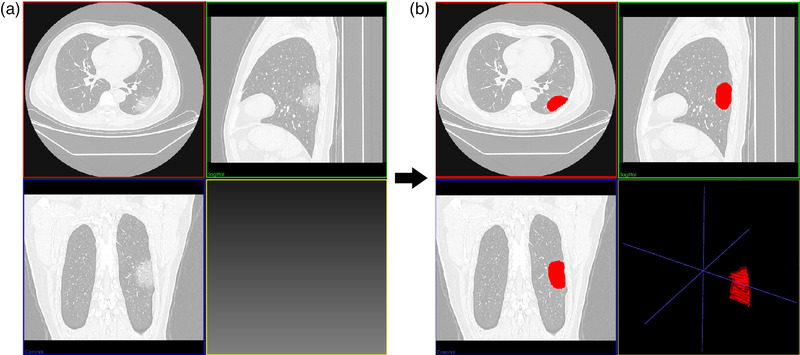
An examples of ground‐glass opacities (GGOs) and their segmentation results on CT images for one COVID‐19 severe patient. (a,b) The CT images before and after the semi‐automatical segmentation. The volumes of interest (VOIs) of lesions were represented red regions in (b)
FIGURE 4.
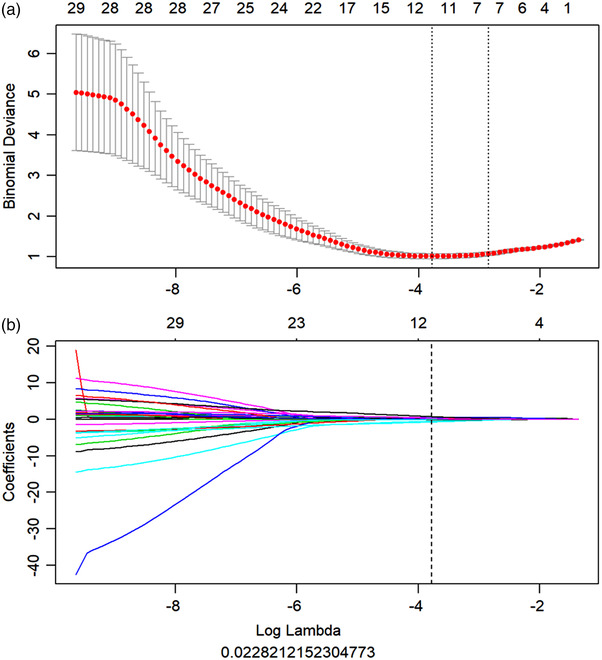
Feature selection and modeling for the radiomics signature using the least absolute shrinkage and selection operator (LASSO) algorithm. (a) The optimal tuning parameter (Lambda) in the LASSO model was selected using 10‐fold cross‐validation and the 1 standard error rule. Two lambdas (the optimal value and the value that the simplest model obtained within one standard error of the optimal value) were obtained and drawn as two vertical dashed line. The optimal Lambda value of 0.023 with log (Lambda) = −3.781was selected for modeling and 10 nonzero coefficients were chosen; (b) LASSO coefficient profiles of the features compared to the lambda values. According to the 10‐fold cross‐validation in (a), the vertical line of the optimal lambda was drawn. The eight features with non‐zero coefficients were selected for radiomics signature construction
Radscore was expressed as the score of the radiomics signature calculated by linearly weighted of all retained features’ values (Figure 5a), and could be used in the further evaluation and modeling. As seen in Figure 5b,c. The potential severe and non‐severe patients could be significantly distinguished in training set (p < 0.001) and well distinguished in test sets (p < 0.001).
FIGURE 5.
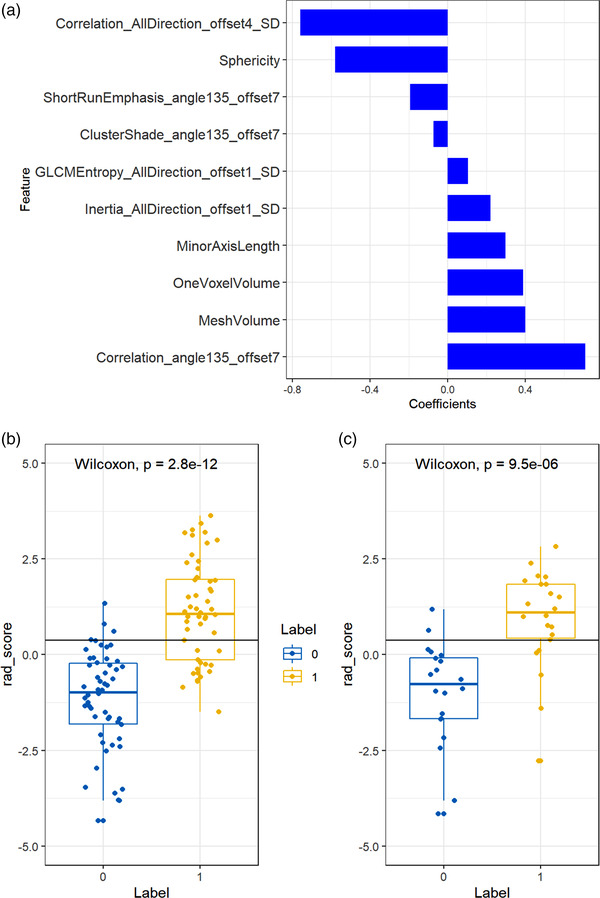
The results of radiomics signature construction and validation. (a) Histogram showing contribution of each feature to the constructed radiomics signature. (b,c) Radiomics signature distribution in training (p < 0.001) (b) and test set (p < 0.001) (c), respectively
3.4. Validation of the Radiomics models
The predictive performance of the Radiomics and Combined models were evaluated and compared using the ROC curve (Figure 6). Table 3 also showed their performance using the ROC metrics in both training and test set. Overall, Radiomics and Combined models showed a very good performance with the accuracy and AUC of nearly or above 0.9 (Figure 6 and Table 3). The Hosmer–Lemeshow test of two models also showed a good uniformity between their observed and predicted values. Additionally from the results of the Delong test, we found that there was no significant difference (p > 0.05) in the predictive performance between these two models.
FIGURE 6.
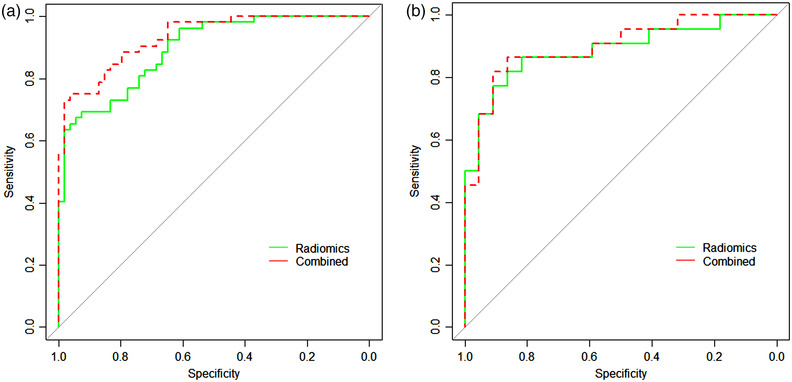
The comparison of the receiver operating characteristic curves (ROCs) for the Radiomics and Combined models. (a) For the training set, while (b) for the test set
TABLE 3.
Model performance analysis of the models using ROC metrics
| AUC (95%CI) | Accuracy | Sensitivity | Specificity | HL test | ||
|---|---|---|---|---|---|---|
| Radiomics | Training | 0.894 (0.837–0.951) | 0.811 (0.645–0.875) | 0.692 (0.587–0.840) | 0.926 (0.821–0.979) | 0.415 |
| Test | 0.886 (0.784–0.989) | 0.841 (0.585–0.941) | 0.818 (0.640–0.964) | 0.864 (0.542–0.913) | ||
| Combined | Training | 0.932 (0.889–0.976) | 0.859 (0.698–0.922) | 0.750 (0.649–0.884) | 0.963 (0.873–0.995) | 0.931 |
| Test | 0.899 (0.805–0.992) | 0.863 (0.615–0.952) | 0.818 (0.640–0.964) | 0.909 (0.589–0.940) |
Notes: The best operating point of the ROC was chosen at the point, whose Youden index is maximal. (Youden index = Sensitivity+Specificity−1). Delong test between two models: p = 0.650.
Abbreviations: AUC, area under curve; HL, Hosmer–Lemeshow test.
3.5. Radiomics+Clinical nomogram
As shown in Figure 7, the radiomics signature and five clinical risk factors (age, sex, hypertension, diarrhea, and dyspnea) were included in the Radiomics+Clinics nomogram. The total score obtained by combining the score of each risk factors could be used to quantitatively predict the probability of progression to be severe for the COVID‐19 patients who were non‐severe when they were admitted. The Hosmer–Lemeshow test (Table 3) yielded no significant difference between the predictive calibration curve and the ideal curve for potential COVID‐19 severe patients prediction with both the estimation using the nomogram and actual observation. Figure 7(b,c) exhibited a good agreement between the estimation using the nomogram and the actual observation.
FIGURE 7.
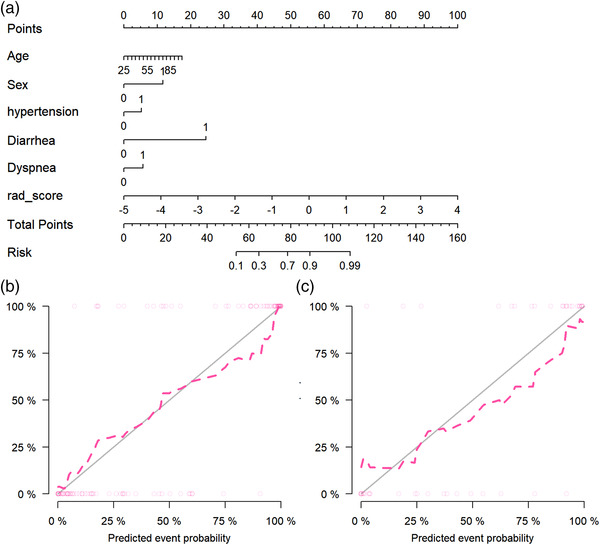
Radiomics+Clinics nomogram and its calibration curves
3.6. Evaluation of 100‐times repeated dataset randomly split
The value of each evaluation metrics obtained for each time of dataset randomly split was attached in the supplement excel file and Figure 8. As shown in Figure 8, we found that for all ROC evaluation metrics (including ACC, AUC, sensitivity, specificity, NPV, and PPV), the constructed model showed a stable and consistent evaluation result. This illustrated that the built model was robust and less affected by different data divisions.
FIGURE 8.
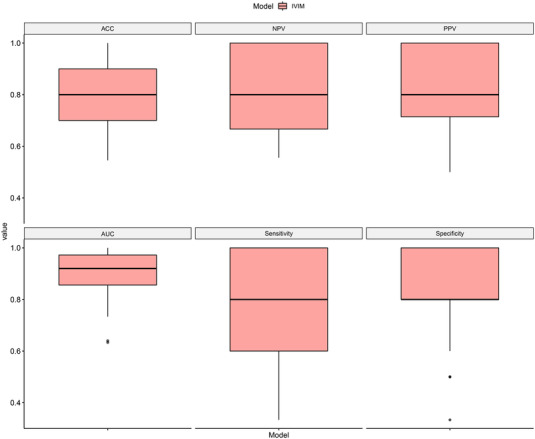
Boxplot of 100‐times repeated dataset randomly split evaluation results for the Combined model in independent test set. The details statistical results of receiver operating characteristic curve (ROC) metrics showed as follows: AUC = 0.9099±0.0856; ACC = 0.7974±0.1188; sensitivity = 0.7733±0.1910; specificity = 0.8213±0.1462; PPV = 0.8173±0.1362; NPV = 0.8106±0.1445. AUC, area under curve; ACC, accuracy; NPV, negative predicted value; PPV, positive predicted value
4. DISCUSSION
Distinction between non‐severe and severe patients in COVID‐19 is of great significance for better clinical management. “Potential severe patients” do not have severe symptoms at their initial diagnosis, but eventually progressed to be severe patients, They are easily overlooked in epidemic prevention and control and difficult to distinguish in the early stages. CT imaging is sensitive in the imaging manifestations between severe and non‐severe patients.18 In this study, we adopted advanced radiomics analysis on CT images for the distinction of these potentially severe COVID‐19 patients. The constructed model can be used as an effective auxiliary tool for screening potential severe patients in epidemic prevention and control.
Consistent with,19 we found that older men, especially those with a history of hypertension, were at high‐risk. Emesis, dyspnea, and WBC count 20 were the highly relevant clinical manifestations. This could imply that patients may progress to be severe, and these high risk factors should be noted in the clinical treatment.
For the construction of the radiomics signature, 402 candidate radiomics features were reduced to eight potential predictors by examining the predictor‐outcome association by the mRMR and the LASSO method. The mRMR method was mainly used to eliminate redundant features and achieve the screening of maximum related features at the same time. The LASSO method was not only valuable for choosing predictors on the basis of the strength of their univariable association with outcome, but also enabled the panel of selected features to be combined into a radiomics signature.21 Radiomics features, which contained many statistical, shape, and texture features, could reflect the geometrical characteristics and heterogeneity of the lesion area. Changes in the geometrical characteristics and heterogeneity of lesion area implied potential progression or improvement of the disease. After quantitative extraction and modeling, such changes can be effectively used to distinguish between potential severe and non‐severe patients.
The constructed model could well distinguish between the potential severe and non‐severe patients with the accuracy of nearly or above 0.9 in both training and test set. When a suitable threshold was selected, the model sensitivity could reach 0.9 while its specificity equaled 1.0, which means that all the non‐severe patients could be recognized and most potential severe patients were identified. The performance of the combined model which interpolated the clinical risk factors did not improve significantly, which exactly showed the contribution and importance of the constructed radiomics signature to the prediction of potential severe. In addition after multiple division of data samples, the constructed model can still obtain high and stable results, indicating that our model has good generalization ability and high clinical usability, which partly makes up the defects of low sample size for the dataset in this paper. In the field of machine learning, data determined the upper limit of the task, and models and algorithms can only approached this upper limit infinitely. In terms of data quality, we first included complete clinical data for each case, and used the same parameters of the scanning protocol and reconstruction algorithm to obtain their CT images, then used an equal number of positive and negative data matching to avoid the selection bias caused by data imbalance; but in terms of data quantity, the number of our data samples in our work was very limited compared to the works with a large number of cases, which could not be solved in a short time. We could achieve a comparable and consistent predictive result with their models by using a series of method designs. However, due to the limited data sample, the confidence and reliability of our model's predictive performance could not be as high as that of the models constructed based on thousands of cases.
Up to now, there had been many literature reports analyzing COVID‐19 based on CT images using radiomics or some other machine learning/deep learning methods, and some of them had included thousands of cases. Among these works, many researches22‐25 focused on the lesions, not used the patients as subjects. Their so‐called thousands of cases were actually thousands of lesions; many researches26‐31 built models to predict the COVID‐19 patients’ current severity status, not the potential severe risk. There were also some works32‐34 similar to our work in research ideas and methods. G. Wu et al.32 constructed a model to predict whether the patients will progress to be severe and used five cross‐country external validation sets for validation. However, they used only the traditional semantic features of the image, the CT image information in‐depth was not explored. Q. Wu et al.33 and Wang et al34 performed statistical analysis and radiomics modeling based on the first CT images and clinical data of patients at admission, to predict the “poor oucome” and “composite endpoint” of the patients, respectively. In their works, the definition of “poor outcome” is death, need for mechanical ventilation, or intensive care unit admission33 while “composite endpoint” is when patients developed respiratory failure, acute respiratory distress syndrome (ARDS), acute liver or kidney injury, or death.34 However, we thought that there was an intervention window phase for the COVID‐19 patients between they were diagnosed as severe status using clinical phenotype5 and the onset of so‐called “poor outcome” or “composite endpoint”. Therefore, the models constructed based on severity status defined using severity clinical phenotype might have greater application value in the early intervention of patients with potential severe risk, and could be a good complement to the similar research works.
Some scholars mentioned that35 the positive selection bias inherent in retrospective studies that did not include negative or equivocal CT results. The performance of a classifier was likely to be far poorer than implied in the study when inserted into a clinical workflow for COVID‐19 patients when chest CT was used prospectively. However in our opinion, (1) since there were no lesions on the images of CT‐negative patients, the images of these patients could not be analyzed using our model. Exclusion of these patients would not affect the accuracy of the model, but only affect the application scope of the model; (2) if the patients with ambiguous CT images results were used for analysis, the performance of the model might be significantly lower than reported in the paper because of the uncertainties in the CT images. Therefore, we suggested to exclude them, which might also affect the application scope of the model. Considering that35 the CT image manifestations of COVID‐19 patients were relatively typical, and 81% of 3466 patients’ CT images were found with distinct GGO. Therefore, it seemed wise to exclude these patients from the trade‐off between model application scope and prediction accuracy.
However, there are several limitations in this study. First, the sample size is relatively small and this work is a retrospective study from a single center. The lack of an external validation set is one of the biggest defects of this study. More cross‐regional or even cross‐border scientific research cooperation and data sharing should be sought to further improve the reliability and clinical usability of the constructed models. Second, only statistical, morphological, and textural features in the lesions were considered in this study. The findings can reflect the global and local minor changes in the lesions very well. However, the minor changes with the surrounding normal tissues were not considered, which might be useful to better identify severe patients. Third, patients with negative initial CT were excluded in this study. Some of them may also progress rapidly and could fall into the category of severe. This type of patients is also worthy of attention and is one of our key research objects in the future. Finally, manual segmentation might bring the interference and uncertainty of human to our model. Therefore, a lesion auto segmentation method should be considered in the future.
In conclusion, a CT‐based radiomics signature for the prediction of potential severe COVID‐19 patients was constructed and evaluated. Constructed Radiomics models showed good feasibility and accuracy. The Radiomics+Clinical nomogram, acted as a useful tool, may assist clinicians to better identify potential severe cases to target their management in the COVID‐19 pandemic prevention and control.
CONFLICT OF INTEREST
The authors declare that there is no conflict of interest that could be perceived as prejudicing the impartiality of the research reported.
Supporting information
Figure S1 information
Figure S1 Caption
ACKNOWLEDGMENTS
This work was supported in part by the National Key Research and Development Plan of China 2017YFC0108803, in part by the Applied Basic Frontier Research Foundation of Wuhan Science and Technology Bureau 2020020601012238, in part by the New Type Pneumonia Emergency Science and Technology Project of Hubei Province 2020FCA016, and in part by the Fundamental Research Funds for the Central Universities 2042020kfxg11, granted to Dr. Haibo Xu.
Xiao F, Sun R, Sun W, et al. Prediction of potential severe coronavirus disease 2019 patients based on CT radiomics: A retrospective study. Med Phys. 2022;49:5886‐5898. 10.1002/mp.15841
REFERENCES
- 1. Michelle L, Chas D, Scott L, et al. First case of 2019 novel coronavirus in the United States. N Engl J Med. 2020; 382:929‐936. 10.1056/NEJMoa2001191 [DOI] [PMC free article] [PubMed] [Google Scholar]
- 2. Weekly epidemiological update on COVID‐19—16 March 2021. World Health Organization. Accessed 25 May 2021. https://www.who.int/publications/m/item/weekly‐epidemiological‐update‐on‐covid‐19—25‐may‐2021. Published May 25, 2021. [Google Scholar]
- 3. Guan WJ, Ni ZY, Hu Y, et al. Clinical characteristics of coronavirus disease 2019 in China. N Engl J Med. 2020; 382:1708‐1720. 10.1056/NEJMoa2002032 [DOI] [PMC free article] [PubMed] [Google Scholar]
- 4. Zhou F, Yu T, Du R, et al. Clinical course and risk factors for mortality of adult inpatients with COVID‐19 in Wuhan, China: a retrospective cohort study. Lancet. 2020;395:P1054‐P1062. 10.1016/S0140-6736(20)30566-3 [DOI] [PMC free article] [PubMed] [Google Scholar]
- 5. WHO Global . Clinical management of COVID‐19interim guidance. WHO REFERENCE NUMBER: WHO/2019‐nCoV/clinical/2020.5May27, 2020.
- 6. Wang Y, Kang H, Liu X, Tong Z. Combination of RT‐qPCR testing and clinical features for diagnosis of COVID‐19 facilitates management of SARS‐CoV‐2 outbreak. J Med Virol. 2020;92:538‐539. 10.1002/jmv.25721 [DOI] [PMC free article] [PubMed] [Google Scholar]
- 7. Chung M, Bernheim A, Mei X, et al. CT imaging features of 2019 novel coronavirus (2019‐nCoV). Radiology. 2020;. 295:202‐207. 10.1148/radiol.2020200230 [DOI] [PMC free article] [PubMed] [Google Scholar]
- 8. Pan F, Ye T, Sun P, et al. Time course of lung changes on chest CT during recovery from 2019 novel coronavirus (COVID‐19) pneumonia. Radiology. 2020;. 295(3):715‐721. 10.1148/radiol.2020200370 [DOI] [PMC free article] [PubMed] [Google Scholar]
- 9. Li K, Wu J, Wu F, et al. The clinical and chest CT features associated with severe and critical COVID‐19 pneumonia. Invest Radiol. 2020;55(6):327‐331. [DOI] [PMC free article] [PubMed] [Google Scholar]
- 10. Lyu P, Liu X, Zhang R, Shi L, Gao J. The performance of chest CT in evaluating the clinical severity of COVID‐19 pneumonia: identifying critical cases based on CT characteristics. Invest Radiol. 2020;55(7):412‐421. [DOI] [PMC free article] [PubMed] [Google Scholar]
- 11. Zhao W, Zhong Z, Xie X, Yu Q, Liu J. Relation between chest CT findings and clinical conditions of coronavirus disease (COVID‐19) pneumonia: a multicenter study. AJR Am J Roentgenol. 2020;214(5):1072‐1077. [DOI] [PubMed] [Google Scholar]
- 12. Aerts HJ, Velazquez ER, Leijenaar RT, et al. Decoding tumour phenotype by noninvasive imaging using a quantitative radiomics approach. Nat Commun. 2014;5:4006. 10.1038/ncomms5006 [DOI] [PMC free article] [PubMed] [Google Scholar]
- 13. Huang Y, Liu Z, He L, et al. Radiomics signature: a potential biomarker for the prediction of disease‐free survival in early‐stage (I or II) non‐small cell lung cancer1. Radiology. 2016;281(3):947‐957. [DOI] [PubMed] [Google Scholar]
- 14. Huang Y, Liang C, He L, et al. Development and validation of a Radiomics Nomogram for preoperative prediction of lymph node metastasis in colorectal cancer. J Clin Oncol. 2016;34(18):2157‐2164. 10.1200/JCO.2015.65.9128 [DOI] [PubMed] [Google Scholar]
- 15. Hu Z, Xu C, Wei H, et al. Solitary cavitary pulmonary nodule may be a common CT finding in AIDS‐associated pulmonary cryptococcosis. Scand J Infect Dis. 2013;45(5):378‐389. 10.3109/00365548.2012.749422 [DOI] [PubMed] [Google Scholar]
- 16. Hoo ZH, Candlish J, Teare D. What is an ROC curve? Emerg Med J. 2017;34(6):357‐359. [DOI] [PubMed] [Google Scholar]
- 17. Obuchowski NA. Receiver operating characteristic curves and their use in radiology. Radiology. 2003;229(1):3‐8. [DOI] [PubMed] [Google Scholar]
- 18. Shu J, Tang Y, Cui J, et al. Clear cell renal cell carcinoma: CT‐based radiomics features for the prediction of Fuhrman grade. Eur J Radiol. 2018;109:8‐12. [DOI] [PubMed] [Google Scholar]
- 19. Liu K, Xu P, Lv W, et al. CT manifestations of coronavirus disease‐2019: a retrospective analysis of 73 cases by disease severity. Eur J Radiol 2020;126:108941. doi: 10.1016/j.ejrad.2020.108941 [DOI] [PMC free article] [PubMed] [Google Scholar]
- 20. Huang C, Wang Y, Li X, et al. Clinical features of patients infected with 2019 novel coronavirus in Wuhan, China. Lancet. 2020;395(10223):497‐506. [DOI] [PMC free article] [PubMed] [Google Scholar]
- 21. Min X, Li M, Dong D, et al., Multi‐parametric MRI‐based radiomics signature for discriminating between clinically significant and insignificant prostate cancer: cross‐validation of a machine learning method. Eur J Radiol. 2019;115:16‐21. [DOI] [PubMed] [Google Scholar]
- 22. Li W, Cao Y, Yu K, et al. Pulmonary lesion subtypes recognition of COVID‐19 from radiomics data with three‐dimensional texture characterization in computed tomography images. Biomed Eng Online. 2021;20(1):123. 10.1186/s12938-021-00961-w [DOI] [PMC free article] [PubMed] [Google Scholar]
- 23. Qiu J, Peng S, Yin J, et al. A radiomics signature to quantitatively analyze COVID‐19‐infected pulmonary lesions. Interdiscip Sci. 2021;13(1):61‐72. 10.1007/s12539-020-00410-7 [DOI] [PMC free article] [PubMed] [Google Scholar]
- 24. Chen H, Zeng M, Wang X, et al. A CT‐based radiomics nomogram for predicting prognosis of coronavirus disease 2019 (COVID‐19) radiomics nomogram predicting COVID‐19. Br J Radiol. 2021;94(1117):20200634. 10.1259/bjr.20200634 [DOI] [PMC free article] [PubMed] [Google Scholar]
- 25. Xu Z, Zhao L, Yang G, et al. Severity assessment of COVID‐19 using a CT‐based radiomics model. Stem Cells Int. 2021;2021:2263469. 10.1155/2021/2263469 [DOI] [PMC free article] [PubMed] [Google Scholar] [Retracted]
- 26. Li L, Wang L, Zeng F, et al. Development and multicenter validation of a CT‐based radiomics signature for predicting severe COVID‐19 pneumonia. Eur Radiol. 2021;31(10):7901‐7912. 10.1007/s00330-021-07727-x [DOI] [PMC free article] [PubMed] [Google Scholar]
- 27.Xie Z, Sun H, Wang J, et al. A novel CT‐based radiomics in the distinction of severity of coronavirus disease 2019 (COVID‐19) pneumonia. BMC Infect Dis. 2021;21:608. 10.1186/s12879-021-06331-0 [DOI] [PMC free article] [PubMed] [Google Scholar]
- 28. Purkayastha S, Xiao Y, Jiao Z, et al. Machine learning‐based prediction of COVID‐19 severity and progression to critical illness using CT imaging and clinical data. Korean J Radiol. 2021;22(7):1213‐1224. 10.3348/kjr.2020.1104 [DOI] [PMC free article] [PubMed] [Google Scholar]
- 29. Li C, Dong D, Li L, et al. Classification of severe and critical Covid‐19 using deep learning and radiomics. IEEE J Biomed Health Inform. 2020;24(12):3585‐3594. 10.1109/JBHI.2020.3036722 [DOI] [PMC free article] [PubMed] [Google Scholar]
- 30. Xiong F, Wang Y, You T, et al. The clinical classification of patients with COVID‐19 pneumonia was predicted by Radiomics using chest CT. Medicine. 2021;100(12):e25307. 10.1097/MD.0000000000025307 [DOI] [PMC free article] [PubMed] [Google Scholar]
- 31. Shi H, Xu Z, Cheng G, et al. CT‐based radiomic nomogram for predicting the severity of patients with COVID‐19. Eur J Med Res. 2022;27(1):13. 10.1186/s40001-022-00634-x [DOI] [PMC free article] [PubMed] [Google Scholar]
- 32. Wu G, Yang P, Xie Y, et al. Development of a clinical decision support system for severity risk prediction and triage of COVID‐19 patients at hospital admission: an international multicentre study. Eur Respir J. 2020;56(2):2001104. 10.1183/13993003.01104-2020 [DOI] [PMC free article] [PubMed] [Google Scholar]
- 33. Wu Q, Wang S, Li L, et al. Radiomics analysis of computed tomography helps predict poor prognostic outcome in COVID‐19. Theranostics. 2020;10(16):7231‐7244. 10.7150/thno.46428 [DOI] [PMC free article] [PubMed] [Google Scholar]
- 34. Wang D, Huang C, Bao S, et al. Study on the prognosis predictive model of COVID‐19 patients based on CT radiomics. Sci Rep. 2021;11(1):11591. 10.1038/s41598-021-90991-0 [DOI] [PMC free article] [PubMed] [Google Scholar]
- 35. Adams HJA, Kwee TC, Yakar D, et al. Chest CT imaging signature of coronavirus disease 2019 infection: in pursuit of the scientific evidence. Chest. 2020;158(5):1885‐1895. [DOI] [PMC free article] [PubMed] [Google Scholar]
Associated Data
This section collects any data citations, data availability statements, or supplementary materials included in this article.
Supplementary Materials
Figure S1 information
Figure S1 Caption


