

Abstract
Since the outbreak of COVID‐19 in December 2019, the severe acute respiratory syndrome coronavirus 2 (SARS CoV‐2) has spread worldwide. This study summarized the transmission mechanisms of COVID‐19 and their main influencing factors, such as airflow patterns, air temperature, relative humidity, and social distancing. The transmission characteristics in existing cases are providing more and more evidence that SARS CoV‐2 can be transmitted through the air. This investigation reviewed probabilistic and deterministic research methods, such as the Wells–Riley equation, the dose‐response model, the Monte‐Carlo model, computational fluid dynamics (CFD) with the Eulerian method, CFD with the Lagrangian method, and the experimental approach, that have been used for studying the airborne transmission mechanism. The Wells–Riley equation and dose‐response model are typically used for the assessment of the average infection risk. Only in combination with the Eulerian method or the Lagrangian method can these two methods obtain the spatial distribution of airborne particles' concentration and infection risk. In contrast with the Eulerian and Lagrangian methods, the Monte‐Carlo model is suitable for studying the infection risk when the behavior of individuals is highly random. Although researchers tend to use numerical methods to study the airborne transmission mechanism of COVID‐19, an experimental approach could often provide stronger evidence to prove the possibility of airborne transmission than a simple numerical model. All in all, the reviewed methods are helpful in the study of the airborne transmission mechanism of COVID‐19 and epidemic prevention and control.
Keywords: airborne transmission, dose‐response model, Eulerian method, experimental approach, Lagrangian method, Monte‐Carlo model, SARS CoV‐2, ventilation, Wells–Riley equation
Practical implication.
The summarized transmission mechanisms of COVID‐19 and their main influencing factors could help people understand the characteristics of the COVID‐19 virus and take self‐protection measures.
More evidence indicated that SARS CoV‐2 can be transmitted through the air.
The reviewed probabilistic and deterministic research methods are helpful in the study of the airborne transmission mechanism of COVID‐19 and epidemic prevention and control.
1. INTRODUCTION
In the past 20 years, human beings have suffered from three highly contagious coronaviruses diseases: severe acute respiratory syndrome (SARS), Middle East respiratory syndrome (MERS), and COVID‐19. 1 Although the viruses that cause the three diseases are all coronaviruses, they have clear genetic differences. In contrast with the SARS and MERS viruses, the SARS‐CoV‐2 virus that causes COVID‐19 has strong transmission characteristics, and there are no obvious symptoms in the incubation period. 2 According to the latest real‐time statistics from 1 December 2021, COVID‐19 has caused a cumulative global total of 263 million confirmed cases and more than 5 million deaths. According to WHO, the COVID‐19 virus (SARS‐CoV‐2) is transmitted through large droplets, airborne particles, and surface contact, as shown in Figure 1.
FIGURE 1.
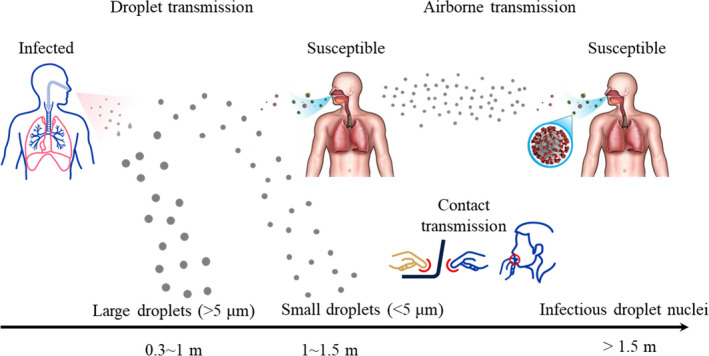
COVID‐19 transmission mechanisms 9
Droplet transmission refers to the direct inhalation of the virus exhaled by an infected person when a susceptible person is close to the infected person, as illustrated in Figure 1. Airborne transmission means the inhalation of small aerosol droplets exhaled by an infected person who is meters or tens of meters away. Contact transmission is the contact deposition of viruses on the surface of an object. Although WHO has suggested three possible transmission paths for SARS‐CoV‐2, 3 there are still many controversial theories about the airborne transmission of COVID‐19. Given the growing evidence 4 , 5 that SARS CoV‐2 could be transmitted through the air 6 , 7 and that the virus in small aerosol particles can survive in the air for hours, it is important to study the airborne transmission mechanism. 8
The aerodynamic diameter of SARS‐CoV‐2 is approximately 120 nm (0.12 μm). 10 , 11 , 12 The virus cannot survive on its own; it requires a coating of proteins, such as respiratory droplets generated by human beings. The Centers for Disease Control and Prevention, USA (CDC) 13 has confirmed that SARS‐CoV‐2 can be transmitted by respiratory droplets produced by the coughing, sneezing, talking, or breathing of an infected person. Large respiratory droplets (>5 μm) can only remain in the air for a short time, but their horizontal travel distance is affected by the velocity of exhaled air. 14 The horizontal travel distance of most large respiratory droplets is less than 1 m. 14 , 15 The droplets will then deposit on the surface of an object due to gravity. Studies have shown that small aerosol droplets (<5 μm) can survive in the air for periods of 3 h to 3 days 16 and travel long distances. 16 , 17 , 18 According to measurements by Liu et al., 19 the SARS‐CoV‐2 aerosol diameter is concentrated in the ranges of 0.25–1.0 and ≥2.5 μm. Meanwhile, Nissen et al. 20 detected viral RNA in ventilation exhaust filters that were located at least 50 m from the vent openings of a patient room. These findings provide evidence that SARS‑CoV‑2 may be dispersed and potentially transmitted by aerosols directly or through ventilation systems.
Many factors, such as the ventilation system, air temperature, relative humidity, and social distancing, would affect the airborne transmission of SARS CoV‐2, especially in enclosed indoor spaces. Since people spend almost 90% of their time in enclosed indoor environments, 21 virus aerosols need to be rapidly discharged from indoor spaces. To effectively control the spread of COVID‐19, it is essential to understand how SARS CoV‐2 is transmitted in the airborne mode.
Studies of SARS CoV‐2 airborne transmission have employed various means, such as probabilistic approaches (Wells–Riley equation, dose‐response model, Monte‐Carlo model, etc.) and deterministic solutions (Eulerian method, Lagrangian method, etc.). In the past 2 years, several review articles have been published on the airborne transmission of SARS‐CoV‐2 in indoor environments. For example, Elsaid et al. 22 reviewed the impact of heating, ventilation, and air conditioning (HVAC) systems on the airborne transmission of SARS‐CoV‐2. Shen et al. 23 reviewed the proportion of infected people in different indoor environments since the outbreak of the epidemic and the use of the Wells–Riley equation to evaluate the probability of airborne infection. Noorimotlagh et al. 24 summarized the available studies on the possible airborne transmission of SARS‐CoV‐2. Agarwal et al. 25 reviewed control measures and sustainable preventive solutions that could be used to improve indoor air quality during the COVID‐19 pandemic. However, no reviews have been published on the research methods to study the indoor airborne transmission of the COVID‐19 virus. This paper seeks to fill the gap through an overview of research methods, models, and some of their recent applications.
First, this review examines the evidence for airborne transmission of COVID‐19 in enclosed indoor spaces. Next, this paper presents an overview of the research methods for exploring airborne transmission. Finally, the prediction and mitigation of airborne transmission of COVID‐19 in enclosed indoor spaces are discussed.
2. EVIDENCE OF COVID‐19 TRANSMISSION IN ENCLOSED INDOOR SPACES
The news media have reported numerous cases of possible COVID‐19 transmission in enclosed indoor spaces, such as buildings, hospitals, airplanes, and restaurants. The cases that may involve the airborne transmission of COVID‐19 mentioned in the scientific literature are summarized below.
Li et al. 26 analyzed an outbreak involving three non‐associated families in Restaurant X in Guangzhou, China. People at two neighboring tables became infected with COVID‐19. Figure 2 shows the simulated dispersion of fine droplets exhaled by the index patient, and the location of families B and C in the dispersion zone.
FIGURE 2.
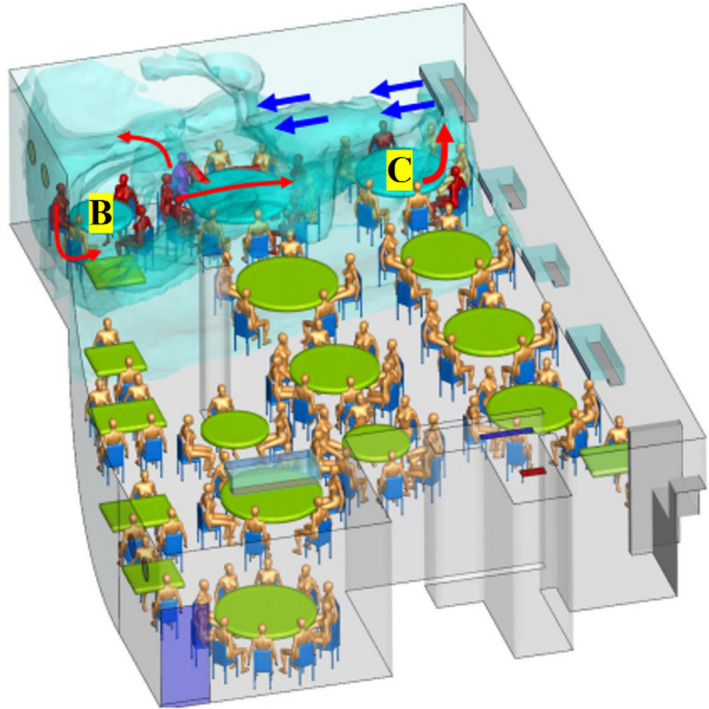
Simulated dispersion of fine droplets exhaled by index patient (magenta‐blue), B and C refer to the table of family B & C 26
Pung et al. 27 analyzed a cluster of COVID‐19 cases in Singapore. After a company conference in a confined space, six of the participants tested positive for COVID‐19. Another cluster of infections consisted of six people who were infected by an asymptomatic COVID‐19 patient in a karaoke bar, a confined space of less than 20 m2 with many occupants and poor ventilation. 28 They suggested that the chance of COVID‐19 transmission was high in a relatively confined space. Meanwhile, after a rehearsal on March 10, 2020, of the Skagit Valley Chorale, 53 of the 61 members in attendance were confirmed or strongly suspected to have contracted COVID‐19, and two died. 29 They found that transmission by the aerosol route is likely; it appears unlikely that either fomite or ballistic droplet transmission could explain a substantial fraction of the cases.
Chen et al. 30 reported transmission on a flight from Singapore to Hangzhou, China, on January 24, 2020. One passenger did not wear a mask properly while he was sitting next to two COVID‐19 patients inside the airplane. The authors found that COVID‐19 transmission could occur in airplanes. Another transmission occurred on a flight from London to Hanoi on March 2, 2020. 31 A total of 16 people in the business‐class cabin were infected by a COVID‐19 patient in the same cabin. A transmission also occurred on a flight from Tel Aviv to Frankfurt on March 9, 2020. 32 Among the 102 passengers, there were 10 confirmed cases of infection. Among those cases, seven patients were part of the same tour group and had not been wearing masks. The seven patients infected at least two other people on this flight who sat within two rows of the seven patients and did not wear masks. Other cases include a flight from Boston to Hong Kong on which two flight attendants were likely infected by passengers in the same cabin 33 ; a flight from Sydney to Perth on March 19, 2020, with a total of 19 confirmed cases related to the flight 34 ; a flight from Milan to Seoul on March 31, 2020, with seven passengers infected 35 ; and a flight from Dubai to Auckland on September 29, 2020, with four passengers infected. 36
Shen et al. 37 examined a COVID‐19 outbreak on a bus in Zhejiang province, China, in which 24 of 68 passengers were infected. They found that the airborne spread of COVID‐19 was likely to have contributed to the high attack rate on the bus. Another COVID‐19 outbreak event occurred during bus trips of an index patient in Hunan Province, China, 38 which suggested potential airborne transmission of COVID‐19 inside the bus. Airborne infection cases were also observed on cruise ships 39 and in elevators. 40
Table 1 summarizes the spread of COVID‐19 in different settings. Although primary spread could be through large droplets in the vicinity of an infected individual, airborne transmission of COVID‐19 cannot be ruled out. Transmission likely by the aerosol route was found in the considerable reviewed cases. This review examines the evidence for airborne transmission of COVID‐19 in enclosed indoor spaces. Therefore, it is important to further review the influence of COVID‐19 airborne transmission and the research methods for exploring airborne transmission.
TABLE 1.
Summary of the spread of COVID‐19 in different settings
| Type of indoor space | Space description | Primary cases | Secondary cases | Potential transmission mechanism | Ref. |
|---|---|---|---|---|---|
| Building | Restaurant | 1 | 9 | Aerosol transmission due to poor ventilation | 26 |
| Building | Company conference | 1 | 6 | All kinds of possible transmission mechanisms | 27 |
| Building | Karaoke room | 1 | 6 | Dense population and poor ventilation | 28 |
| Building | Weekly rehearsal | 1 | 53 | Transmission likely by the aerosol route | 29 |
| Flight | Singapore – Hangzhou | 15 | 1 | Improper mask wearing and proximity to two infected individuals | 30 |
| Flight | London – Hanoi | 1 | 15 | No masks | 31 |
| Flight | Boston – Hong Kong | 2 | 2 | All kinds of possible transmission mechanisms | 33 |
| Flight | Tel Aviv – Frankfurt | 7 | 2 | Within two rows of the seven patients and no masks | 32 |
| Flight | Sydney – Perth | 11 | 11 | Aerosol transmission likely | 34 |
| Flight | Milan – Seoul | 7 | 2 | Infected in the restroom or through contact with surfaces used by infected individual | 35 |
| Flight | Dubai – Auckland | 3 | 4 | Within four rows of each other | 36 |
| Bus | 100‐min round trip | 1 | 24 | Airborne spread likely | 37 |
| Bus | 2.5‐ and 1‐h trips | 1 | 10 | Potential airborne transmission | 38 |
| Cruise ship | The diamond princess | 1 | 712 | Closed environment and contact | 39 |
| Elevator | – | 1 | 1 | In same elevator | 40 |
Primary cases are defined as individuals who are symptomatic or asymptomatic COVID‐19 patients. Secondary cases are defined as individuals who contracted the illness through exposure to a primary case.
3. DOMINANT INFLUENCER OF COVID‐19 TRANSMISSION
Previous studies 22 , 23 , 24 found that multiple parameters, such as the ventilation system, 41 , 42 , 43 air temperature, relative humidity, and social distancing. 43 would affect the airborne transmission of SARS CoV‐2. These factors add complexity to the processes of understanding the airborne transmission mechanism of COVID‐19 and assessing the infection risk. This information is essential for epidemic prevention and control. Therefore, the influence of these factors on the transmission of the SARS‐CoV‐2 should be addressed.
3.1. Ventilation system
Different ventilation systems may have different effects on airborne transmission. Ventilation rate, airflow direction, and air distribution or airflow pattern are three important factors that affect the ventilation effect. 44 , 45 Melikov 1 demonstrated that personalized ventilation (PV) was much more effective than mixing ventilation, and a higher ventilation rate could effectively reduce airborne transmission. Mechanical ventilation was found to be far superior to natural ventilation. 46 In the area of mechanical ventilation, displacement ventilation was designed to supply clean air to the lower part of a room and remove polluted air at or near ceiling level. Since the virus sources are human beings, who are also heat sources, displacement ventilation was determined to be the most effective system for reducing the exposure risk through thermal plumes. In contrast, mixing ventilation was found to mix the indoor air evenly without providing any clean space. 45 The airflow pattern would influence the transmission path of the virus, and the air supply rate would directly affect the average infection risk. Since each ventilation system has its own specific requirements defined by national and international regulatory bodies based on the different ventilation objectives, WHO 44 provided a roadmap to determine the ventilation rate in different situations to deal with COVID‐19.
Zemouri et al. 47 studied the effect of indoor air quality on the transmission of different infectious diseases, and their results indicated that the worse the indoor air quality was, the higher the airborne transmission probability would be. Furthermore, a study from Bisag et al. 17 demonstrated a high correlation between transmission of SARS‐CoV‐2 through aerosol microdroplets and poor ventilation. Bhagat et al. 45 reported that long exposure time and decreased turbulence levels in the indoor environment may be the causes of a higher infection rate indoors than outdoors. The use of a good ventilation system to improve air quality was effective in mitigating the airborne transmission of COVID‐19. 17
3.2. Air temperature and relative humidity
Existing experimental data shows that the activity of SARS‐CoV‐2 decreases with an increase in temperature. 48 Chin et al. 49 found that SARS‐CoV‐2 can survive for 14 days at 4°C, 1 day at 37°C, and only 30 min at 56°C. Furthermore, Newell 50 reported that COVID‐19 transmission efficiency was very high when the temperature ranged from 10 to 21.1°C.
A person is more susceptible to infection at low relative humidity, between 10% and 20%. 51 Virus activity does not change significantly in moderate humidity (40%–60%). 52 However, the infection risk becomes moderate when the relative humidity is high, in the range of 70%–80%. 53 As the humidity increases, the probability of infection changes from high to moderate. In addition, experiments over the past 60 years have indicated that the activity of viral‐pathogen‐carrying droplets is negatively related to ambient humidity and dryness‐enhanced virus spreading. 54 Moreover, the size of the particles was found to be positively related to the humidity of the air and negatively related to the air temperature. This is because of the hygroscopic growth effect 55 and evaporation vaporization. Larger particles tend to deposit on the ground due to gravity, which leads to contact transmission.
Indoor air temperature and relative humidity in offices are usually controlled at 20.3–26.7°C and 20%–60%, respectively. 56 Although these ranges are not ideal for virus survival, they do allow viruses to survive for a long time.
3.3. Social distancing
To reduce the COVID‐19 transmission through the air, the US CDC proposed 6‐ft or 2‐m “social distancing” between people. 57 Numerous researchers 58 , 59 , 60 , 61 , 62 , 63 have studied social distancing between infected and susceptible individuals as shown in Figure 3. However, this social distancing was defined with static ambient air, which is not realistic. Furthermore, indoor environments usually cannot guarantee the required safe social distance. The safety of social distancing is determined by many factors.
FIGURE 3.
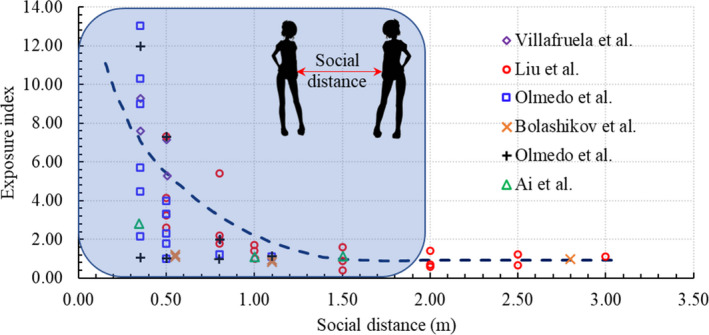
Relationship between exposure and the social distancing between infected and susceptible individuals 58 , 59 , 60 , 61 , 62 , 63
For example, the necessary social distance is closely related to ventilation, since the airflow can transport droplets over long distances in indoor spaces. Indoor ventilation is highly associated with the risk of respiratory infectious diseases. 64 Muthusamy et al. 65 found that without air conditioning in the room, particles spread mainly in the streamwise direction of the exhalation. However, with air conditioning, increased contaminant spread in the lateral direction was observed. The transmission path was found to be highly influenced by the relative positioning of the particle source and the ventilation supply. Sun and Zhai 66 reported that the infection risk of COVID‐19 in public buses was the highest among all types of public vehicles due to the lower air distribution effectiveness, lower fresh air supply rate, and higher occupancy density. Adequate ventilation is necessary to reduce the risk of infection, such as for SARS 67 in enclosed indoor spaces.
In addition, social distancing has been defined for persons who are standing still, without considering the potential aerodynamic effects of a person's movements, such as walking. The swinging motion of legs and hands can create a complex mixing process. The wakes generated by walking can be more than 6 m long, and it can take 30–60 s for these fields to return to their original state after the movement has ceased. Studies have clearly demonstrated the potential for people's movements to influence flow fields and airborne transmission in enclosed spaces. 68 Bhattacharya et al. 69 analyzed the effects of human movement on indoor airflow patterns. They found that walking has a non‐negligible effect on airflow and that the effect can continue for up to 10 s after the moving body has passed. Therefore, both the temporal and geometric distances that a healthy individual should maintain from an infected person should be based on smaller droplets under flowing air. 70
Furthermore, social distancing can be influenced by other intervention measures, such as the wearing of face masks. Deng and Chen 71 measured and simulated the mass of droplets inhaled by a susceptible manikin wearing a mask with different degrees of social distancing. They found that the distance can be reduced to 0.5 m when people wear masks. Pendar and Páscoa 72 found that wearing a face mask and bending the head during a sneeze as a protective action reduced the contamination area to one‐third and three‐quarters, respectively, of the area that was observed when these measures were not taken. A “safe” social distancing is highly dependent on multiple factors. Wearing masks could reduce the risk of infection and shorten the necessary social distance.
4. STUDIES OF AIRBORNE COVID‐19 TRANSMISSION IN INDOOR SPACES
Since the airborne transmission is possible in indoor spaces as reviewed above, many studies have sought to assess SARS‐CoV‐2 infection risk quantitatively. The research approaches used can be classified as probabilistic methods 73 and deterministic methods.
4.1. Probabilistic methods
4.1.1. Wells–Riley equation
The Wells–Riley equation was first proposed by Riley et al. 74 in 1978 for studying the airborne spread of measles. The Equation (1) assumes that the virus is uniformly distributed indoors in a steady‐state environment. Quanta, q, is the hypothetical infectious dose unit proposed by Wells 75 and is used to signify the strength of the infection produced by an infected individual. The number of quanta is a key parameter that varies with the type of virus. The quanta cannot be obtained in the early stage of an infectious disease outbreak and are usually backward calculated from epidemiological studies. 76 Once the quanta are known, the probability of infection risk, P, can be determined from
| (1) |
where C is the number of infected individuals, S the number of susceptible people, I the number of infectors, q the quanta released by an infector (h−1), p the breathing rate of each susceptible person (m3/h) with p = 0.3 m3/h for a person who is sitting or engaging in light activity, t the exposure time (h), and Q the ventilation rate of fresh air (m3/h).
Some researchers have further modified the Wells–Riley equation for other situations. For example, Zemouri et al. 47 extended the Wells–Riley equation by adding a respiratory protection factor to estimate the infection risks in dental clinics, as expressed by Equation (2). Since the epidemiologic data for SARS‐CoV‐1 and SARS‐CoV‐2 are similar, 16 the number of quanta for SARS‐CoV‐1 can also be used for SARS‐CoV‐2.
| (2) |
where ηe and ηr are the exhalation filtration efficiency and respiration filtration efficiency, respectively.
Liu et al. 77 further modified the Wells–Riley equation to evaluate the infection risk in an unsteady environment. The corresponding results can effectively guide the determination of local epidemic prevention and control measures in public spaces. To consider the actual non‐uniform virus distribution in an indoor space, some researchers proposed a combination of the Wells–Riley equation with a multiple‐box model 78 or a multiple‐zone model, 79 experimental measurements using a tracer gas, or a computational fluid dynamics (CFD) model. 80 , 81 , 82 This method is helpful to fully understand the infection risk of different locations in indoor space, formulate corresponding prevention and control measures and prevent the spread of COVID‐19. Note that, experimental measurements and CFD numerical simulations can provide more accurate results than multiple‐box and multiple‐zone models, but they are time‐consuming.
Although the Wells–Riley equation has some shortcomings, its ability to rapidly evaluate infection risk makes it an important tool during the COVID‐19 epidemic.
4.1.2. Dose‐response model
The dose‐response model was originally used to quantitatively evaluate the responses of animals exposed to different doses of chemical toxins, drugs, radiation, etc. In 1996, Nicas 83 was the first to use the model to assess the probability of airborne tuberculosis infection, as shown in Equation (3).
| (3) |
where G represents the number of airborne‐transmitted virus particles released by a signal infector per unit time and β the fraction of the infectious viruses deposited in the lungs. The other parameters are the same as those in the Wells–Riley equation. In addition, the dose‐response model assumes that the airborne virus particles are well‐mixed under steady‐state conditions. If the G times β is replaced by quanta, q, Equation (3) is the same as Equation (1). The exponential dose‐response model assumes that a susceptible person would be infected when one virus particle is deposited in the lungs. Since it is difficult to assess the human infectious dose experimentally, Armstrong and Haas 84 experimented on animals and then studied the spatial distribution of infection risk through a near field‐far field model 85 which was a recognized preventive exposure assessment tool.
For the Wells–Riley equation in Section 4.1.1, the quanta value was backward calculated under the assumption that all infection cases are caused by airborne transmission, and no transmission mechanism (airborne, droplet, or contact transmission) was identified as dominant. In contrast, the dose‐response model could be used to explicitly consider all transmission mechanisms. 73 In addition, this review only provides the original formulas of the Wells–Riley equation and the dose‐response model. Readers can find other evolution formulas from the review of these two methods. 73
4.1.3. Monte‐Carlo model
The dispersion of an aerosol and the behavior of individuals affect their exposure to the virus. The dispersion of the aerosol is influenced mainly by the airflow, and the behavior of individuals is highly random. These factors can be addressed with the Monte‐Carlo model, which uses the stochastic character of the parameters and is also known as random sampling or the statistical test method. The Monte‐Carlo model described by Vuorinen et al. 86 is used as an example to demonstrate the principles of this method as shown in Figure 4. It assesses the random movement of people and the number concentration of aerosols c (m−3) = c (x, y, t) by solving the Equation (4) and diffusion Equation (5), respectively.
| (4) |
| (5) |
where N, N 0, N in, and N out, represents the total indoor population, initial indoor population, number of people entering at random, and number of people leaving at random, respectively, U i , t and U i , t + 1 represents the walking speed with the direction of person i at t and t + 1 moments, respectively, R 1, R 2, R 3 represents the random variable generated by the Monte‐Carlo model, t represents time (s), D the diffusion constant that would vary depending on the environment, 87 S the aerosol source term, −c/τ the sink term (ventilation or vertical surfaces, e.g., are modeled as a sink term), and τ(s) the removal timescale.
FIGURE 4.
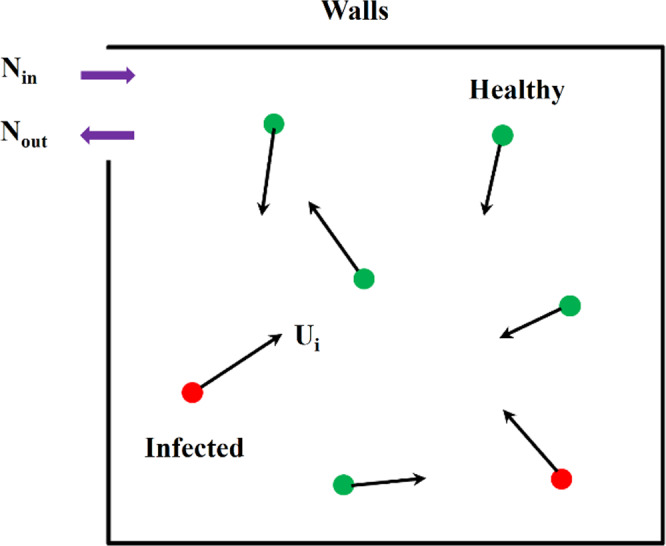
Schematic diagram of Monte‐Carlo model
In 2020, Vuorinen et al. 86 first proposed the above Monte‐Carlo model for studying the indoor exposure risk for susceptible individuals in motion sharing the same space with different numbers of individuals and different speeds of movement. Their results indicated that the developed Monte‐Carlo model could quantitatively provide the duration of exposure to virus‐containing aerosols. Although few studies have been published on this newly proposed method to date, it is useful in the study of virus airborne transmission in large spaces with randomly moving people, such as railway station waiting halls, airport waiting halls, shopping malls, and gymnasiums.
With the exception of an investigation by Vuorinen et al. 86 , most researchers 88 , 89 , 90 have utilized the Monte‐Carlo model to study the spread of epidemics. For example, Maltezos and Georgakopoulou 88 sought to determine the effective reproductive number in the spread of an epidemic using the Monte‐Carlo model. It should be noted that the effective reproductive number refers to the average number of secondary infections caused by a single infected person during the transmission period of the virus. This number could provide a better understanding of the fundamental mechanisms of the spread of COVID‐19.
4.2. Deterministic approaches
The probabilistic methods introduce great uncertainty to the study of airborne infectious disease transmission in buildings. Meanwhile, CFD and experimental measurements are popular deterministic tools for studying the transport of airborne particles in indoor spaces. CFD simulates particle transport by means of the Eulerian and Lagrangian models. 91 , 92 Experimental methods generate particles that mimic real‐world virus transmission.
4.2.1. CFD with the Eulerian model
The Eulerian model assumes that particles are a continuum and obtains whole‐field information directly by solving the following scalar transport equation:
| (6) |
where Φ represents the scalar parameter; t represents the time, xj represents the Cartesian coordinate, ρ represents the air density, Vi represents the air velocity, ΓΦ represents the diffusion coefficient, and SΦ represents the virus source released by the infector.
Arefi et al. 93 used the Eulerian model to study airborne particle transmission and adsorption in the human alveolus. Ho 94 investigated the impact of social distancing, ventilation mode, and face coverings on the probability of infection, and the results showed that this model was helpful for comparing and analyzing virus transmission in different scenarios. Lu et al. 95 evaluated the infection probability in hospital wards under stratum ventilation modes, and the numerical simulation results were in good agreement with the experimental results. Vuorinen et al. 86 studied the possibility of airborne transmission and the evolution of airborne particles' spatial concentration distribution over time. According to their results, a clear quantitative exposure risk with the change in time can be assessed in different public indoor environments. Srivastava et al. 96 assessed the probability of SARS‐CoV‐2 infection in an enclosed indoor environment using the Wells–Riley equation and evaluated the performance of an air‐cleaning device. They found the Eulerian model to be a good tool for predicting the spatial distribution of airborne particles. Our review concluded that the Eulerian model, in combination with the Wells–Riley equation, is suitable for the prediction of the spatial distribution of airborne particles and assessment of infection risk.
4.2.2. CFD with the Lagrangian model
The Lagrangian model 97 , 98 determines the trajectories of individual particles using Equation (7) in accordance with Newton's law:
| (7) |
where represents the particle velocity, FD the drag force coefficient, the air velocity, and g the gravitational acceleration; ρp and ρa are the particle density and air density, respectively; and is the Brownian motion force.
Recent studies have attempted to use CFD simulations with the Lagrangian model directly to predict the risk of infection for different purposes. For example, Ren et al. 99 investigated the removal efficiency of different ventilation strategies for a prefabricated double‐patient ward. Some researchers have also explored the role of the ventilation system in virus transmission in different indoor spaces with mechanical and natural ventilation. 100 , 101 , 102 Borro et al. 103 optimized an HVAC system by installing a local exhaust ventilation system to decrease the possibility of SARS‐CoV‐2 infection based on predicted infection risk results. Zhou and Ji 2 studied the effects of coughing and talking, as well as different social distances, on the infection risk in fever clinics. Feng et al. 55 investigated the impact of relative humidity and ambient wind on the effectiveness of 6‐ft social distancing in decreasing the infection risk. Liu et al. 104 investigated airborne particle exposure in elevators. Li et al. 105 used the Lagrangian method to evaluate the impact of the speed, slope, and direction of an escalator on the spread of droplets. All these studies indicated that the Lagrangian model could be used to assess the risk of exposure to airborne particles.
The Eulerian and Lagrangian models are usually coupled with numerical calculations of the flow field. Hence, accurate prediction of airflow and turbulence is very important in calculating the transmission and deposition of a virus. The available CFD numerical models include direct numerical simulation (DNS), large‐eddy simulation (LES), Reynolds‐averaged Navier–Stokes equation simulation (RANS) with turbulence models, and detached‐eddy simulation (DES). To evaluate the impact of turbulence on virus transmission, some researchers have used high‐resolution LES to study indoor air turbulence, 86 turbulence generated by people's movements, 106 or the airflow generated during coughing and sneezing. 72 These researchers have sought to capture the flow characteristics and analyze the flow principle. To explore the geometric characteristics of buccal/nasal passages on virus transmission and the effects of the diffusion characteristics of salivary droplets, Fontes et al. 107 used DES to accurately capture large‐scale separation flow. Their results showed that the exposure risk level caused by the diffusion characteristics of salivary droplets was highly dependent on fluid dynamics, which may vary due to human physiological factors. For the RANS method, many of the available turbulence models are suitable for different scenarios. For example, Zhang and Chen 97 adopted the modified ‐f model to improve accuracy when calculating particle deposition on a surface. Dbouk and Drikakis 108 studied the transport, diffusion, and evaporation of salivary particles caused by human coughing with and without 109 face masks, using the k‐ω turbulence model. 110 Busco et al. 111 employed the realizable k‐epsilon model to evaluate the effect of sneezing on transmission. Moreover, the RNG k‐ε model 112 has been widely used to study transmission in indoor environments with ventilation. All the above studies have demonstrated the importance of the numerical calculation of the flow field to the Eulerian and Lagrangian models for accurate exploration of virus transmission in the region of interest.
4.2.3. Experimental approaches
Experimental investigations of the airborne transmission mechanism have used substitutes for virus‐laden particles. For example, Zhou and Ji 2 studied the particle diffusion trajectory and its spatial concentration distribution in a typical fever clinic for different situations: patient sitting and patient lying in bed. Instead of aerosol particles, they used di‐ethyl‐hexyl‐sebacate (DEHS) droplets with diameters ranging from 0.3 to 10 μm which is a good representation of most bioaerosols. Lieber et al. 113 experimentally studied the evaporation characteristics of saliva droplets and their airborne lifetime to explore the airborne transmission of SARS‐CoV‐2. Meanwhile, by releasing particles produced by sandalwood combustion rather than real virus‐laden particles, Kong et al. 114 evaluated the performance of a ventilation system against the exposure of healthcare workers to SARS‐CoV‐2 through a series of experiments. Li et al. 115 sought to analyze the airborne exposure mechanism of the virus in an aircraft cabin experimentally. They evaluated the exposure to virus‐laden particles by releasing DEHS droplets in different locations in the cabin. The results of the above experiments indicated that the experimental approach of using virus‐laden particle substitutes, such as DEHS droplets or particles produced by sandalwood combustion, is suitable for studying the airborne transmission mechanism of the virus.
Other types of experimental studies have also been conducted on virus transmission. For example, Li et al. 116 used an active bacterial agent to study the spatial concentration distribution and airborne transmission of a respiratory droplet aerosol. Their experimental study also explored the effects of the ventilation rate and droplet aerosol production rate on infectious disease control. Nissen et al. 20 analyzed the possibility of the airborne transmission of SARS‐CoV‐2 by means of various sampling methods. To study the ability of SARS‐CoV‐2 to transmit aerosols in hamsters, Sia et al. 4 placed a donor (COVID‐19 inoculated) hamster and a healthy hamster in two adjacent stainless steel wired cages respectively as shown in Figure 5. As a result, they extracted the virus from the healthy hamsters. Richard et al. 5 performed a similar experiment using ferrets and obtained similar results. Their research showed that SARS‐CoV‐2 can spread through the air.
FIGURE 5.
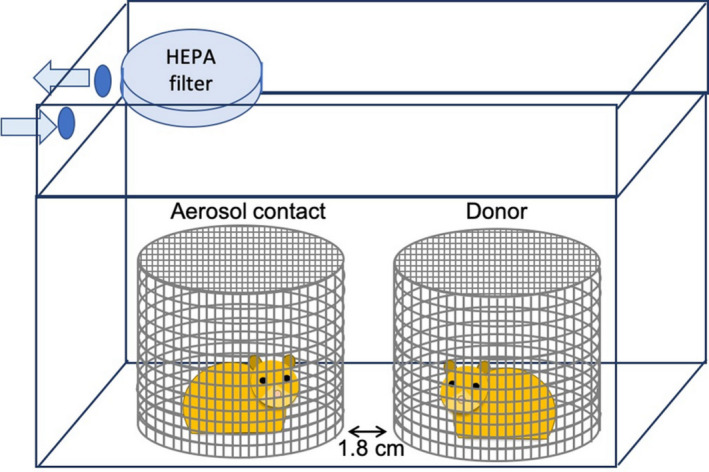
Experimental setup: the donor (COVID‐19 inoculated) hamster and the healthy hamster in two adjacent stainless steel wired cages 4
5. DISCUSSION
Although the mentioned probabilistic and deterministic methods can help to study the airborne transmission of the virus, these methods have their unique advantages and disadvantages (Table 2).
TABLE 2.
The pros and cons of different research methods
| Methods | Pros | Cons |
|---|---|---|
| Wells–Riley equation |
|
|
| Dose‐response model |
|
|
| Monte Carlo model 86 |
|
|
| Eulerian method |
|
|
| Lagrangian method |
|
|
| Experimental approach |
|
|
5.1. Probabilistic methods
5.1.1. Wells–Riley equation
In the Wells–Riley equation, the backward‐calculated quanta generation rate assumes that all infections occur through an airborne transmission mechanism. However, the actual paths of infection may also include non‐direct contact and droplet transmission. Therefore, the best way to account for these two paths in the Wells–Riley equation, to make the results more accurate and persuasive, should be explored further. For example, the proportion coefficient of airborne transmission in the process of COVID‐19 transmission could be determined and added to the Wells–Riley equation.
Although there have been numerous changes, 47 , 77 such as Equation (2), to the Wells–Riley equation to expand its scope of application, the modified Wells–Riley equation is still not suitable for all scenarios. Hence, more applicable and flexible models need to be developed.
Since the quanta generation rate used in the Wells–Riley equation is typically backward calculated from an outbreak case based on the well‐mixed assumption, the effects of the outbreak case's spatial geometry, airflow pattern, and patient locations are not excluded but are implicitly included in this quanta value. 73 When that quanta generation rate is used for a new scenario, the spatial geometry and airflow pattern of the new space and the patient locations in the new space are different from those in the outbreak case, which will lead to errors. Therefore, how best to consider the effects of these factors in the Wells–Riley equation is worth further investigation. For instance, the influence factors of the outbreak case and the new space could be added to the Wells–Riley equation.
5.1.2. Dose‐response model
The quanta value used in the dose‐response model is usually determined through experimental infections. However, for the animal experiments, the accuracy of interspecies extrapolation of infectivity needs to be further improved.
5.1.3. Monte‐Carlo model
The newly developed Monte‐Carlo model assumes that the released aerosol is evenly mixed in a space of one cubic meter surrounding the human body and ignores the aerosol release process. The reasonableness of this assumption and whether it applies to a spatial range of any scale are worthy of further discussion. In addition, few studies have used this new proposed model to study the airborne transmission of COVID‐19 to date, and therefore the accuracy of the model needs to be further verified.
5.2. Deterministic approaches
5.2.1. Eulerian model and Lagrangian method
Eulerian model and Lagrangian method are two usually used models under CFD methods for predicting airborne particle transmission in enclosed spaces. The Eulerian model can predict the spatial distribution of viruses throughout the whole field, but it cannot track the trajectories of individual particles. In contrast, the Lagrangian method can not only track particles but also predict the spatial distribution of the virus and track evaporating droplets. 110 However, because the original intent of the Lagrangian method was to calculate the distribution of discrete particles, the converted spatial distribution of pollutants is usually discontinuous. Therefore, most researchers prefer to use these two methods simultaneously, which is more troublesome. For example, Arefi et al. 93 used the Eulerian model to study the fine nanoparticles which are transmitted through the air, and the Lagrangian method to study the coarse nanoparticles which would be affected by Brownian motion, gravity, drag force, particle buoyancy, and so on. Although the Eulerian model is usually used to study the transmission of particles and ignores the influence of gravity, it is also possible to include the effect of gravity in the model. 117 In addition, tracking particles and predicting the spatial distribution of the virus simultaneously using the Lagrangian method would require the release of a sufficient number of particles and refinement of the mesh to minimize discontinuities in the spatial distribution of the virus.
For the simulation of a steady‐state scenario, the computation time required by the Eulerian method is typically less than that for the Lagrangian method. This is because the Eulerian method only needs to solve one additional scalar differential equation, while the Lagrangian method needs to track the trajectories of a large number of particles used to weaken the characteristics of the discontinuous spatial distribution of the particle concentration. 92 For simulation of an unsteady‐state scenario, the computation time needed by the Eulerian method is typically greater than that for the Lagrangian method. In contrast with the steady‐state scenario simulation, the Eulerian method needs a small‐time step to solve the state equation and the scalar differential equation. However, the increase in calculation time when the Lagrangian method is used is mainly determined by the transient simulation time of the state equation. 92 To increase the numerical simulation speed of the state equation and scalar differential equation, future studies could adopt the fast fluid dynamics method. 118
In Section 4.2, the Lagrange method is considered as a deterministic method. However, when the random component of turbulence is considered in the Lagrange method, this method will no longer be a complete deterministic method.
5.2.2. Experimental approaches
Although some scholars have confirmed the possibility of airborne transmission of COVID‐19 through animal experiments, 4 , 5 whether the results obtained from such experiments are applicable to the airborne transmission of COVID‐19 between humans is worthy of further exploration. In addition, future studies could address the accuracy of interspecies extrapolation of airborne transmission possibility.
This paper only reviewed the main papers that have focused on the airborne transmission of COVID‐19 in indoor environments. Up to now, almost all the papers have focused on cause‐effect problems that predict the spatial distribution of indoor pollutants and the infection probability for susceptible populations on the premise that the type of HVAC system and the locations of infected persons are known. Future studies could explore effect‐cause problems 119 , 120 that would inversely identify the locations of infected persons 121 , 122 from the measured known parameters.
6. CONCLUSION
This paper summarized the possible transmission mechanisms of COVID‐19 and their main influencing factors. Next, the paper reviewed the widely used probabilistic and deterministic methods for predicting the airborne transmission of SARS‐CoV‐2. The probabilistic methods include the Wells–Riley equation, the dose‐response model, and the Monte‐Carlo model, while the Eulerian method, Lagrangian method, and experimental approach are all deterministic methods.
The transmission mechanisms of SARS CoV‐2 include droplet transmission, close contact transmission, and airborne transmission. There are many parameters, such as the HVAC system, air temperature, air humidity, and social distancing, that can significantly affect the airborne transmission of SARS CoV‐2 in the indoor environment.
The Wells–Riley equation and the dose‐response model are both based on the assumption of a well‐mixed air pattern. It can only provide an average infection risk possibility, which could cause a large error. Combining these two methods with the Eulerian method or Lagrangian method can provide more detailed information about the spatial distribution of pollutants and local infection risk. 77 , 96
Both the Eulerian method and Lagrangian method can be used to assess the spatial distribution of airborne particles’ concentration, but only the Lagrangian method is suitable for determining the trajectories of individual particles. The spatial distribution of the airborne particles’ concentration can be used to assess the local infection risk, and the trajectories of particles are helpful in understanding the spatial transmission characteristics of the virus. Thus, both pieces of information are beneficial for epidemic prevention and control. However, the spatial distribution of the airborne particles' concentration obtained by the Lagrangian method is usually discontinuous. The best option is to use these two methods at the same time 93 for different purposes.
Compared with the Eulerian and Lagrangian methods, the Monte‐Carlo model is suitable for assessing the local infection risk with the random motion of individuals. Since this model makes many assumptions, its accuracy needs to be further verified.
Although researchers tended to study the airborne transmission mechanism of COVID‐19 by numerical calculation due to the high cost and long duration (typically) of experiments, an experimental approach could often provide stronger evidence to prove the possibility of airborne transmission than numerical calculations. In addition, the experimental approach can elucidate the airborne transmission mechanism and determine the possibility of airborne transmission of COVID‐19.
All in all, different methods have their unique characteristics. Only by selecting appropriate methods for specific purposes can we effectively prevent epidemic diseases.
AUTHOR CONTRIBUTION
Xingwang Zhao: Investigation, methodology, visualization, data curation & analysis, writing ‐ review & editing. Sumei Liu: Investigation, methodology, visualization, data curation & analysis, writing ‐ review & editing. Yonggao Yin: Review. Tengfei (Tim) Zhang: Review. Qingyan Chen: Advisor, review & editing.
PEER REVIEW
The peer review history for this article is available at https://publons.com/publon/10.1111/ina.13056.
ACKNOWLEDGEMENTS
This study was partially supported by Jiangsu Planned Projects for Postdoctoral Research Funds through Grant No. 2021K069A, by the National Natural Science Foundation of China (NSFC) through Grant No. 52108084, and by the China Postdoctoral Science Foundation through Grant No. 2020M680886.
Zhao X, Liu S, Yin Y, Zhang T(, Chen Q. Airborne transmission of COVID‐19 virus in enclosed spaces: An overview of research methods. Indoor Air. 2022;32:e13056. doi: 10.1111/ina.13056
Xingwang Zhao and Sumei Liu contributed equally to this work and should be considered co‐first authors.
DATA AVAILABILITY STATEMENT
The data that support the findings of this study are available from the corresponding author upon reasonable request.
REFERENCES
- 1. Melikov AK. COVID‐19: reduction of airborne transmission needs paradigm shift in ventilation. Build Environ. 2020;186:107336. [DOI] [PMC free article] [PubMed] [Google Scholar]
- 2. Zhou Y, Ji S. Experimental and numerical study on the transport of droplet aerosols generated by occupants in a fever clinic. Build Environ. 2021;187:107402. [DOI] [PMC free article] [PubMed] [Google Scholar]
- 3. WHO . Novel coronavirus (2019‐nCoV) situation report. 2020. Accessed July 10, 2020. https://www.who.int/docs/default‐source/coronaviruse/situation‐reports/20200211‐sitrep‐22‐ncov.pdf
- 4. Sia SF, Yan LM, Chin A, et al. Pathogenesis and transmission of SARS‐CoV‐2 in golden hamsters. Nature. 2020;583(7818):834‐838. [DOI] [PMC free article] [PubMed] [Google Scholar]
- 5. Richard M, Kok A, Meulder DD, et al. SARS‐CoV‐2 is transmitted via contact and via the air between ferrets. Nat Commun. 2020;11(1):3496. [DOI] [PMC free article] [PubMed] [Google Scholar]
- 6. Hadei M, Hopke PK, Jonidi A, Shahsavani A. A letter about the airborne transmission of SARS‐CoV‐2 based on the current evidence. Aerosol Air Qual Res. 2020;20(5):911‐914. [Google Scholar]
- 7. Asadi S, Bouvier N, Wexler AS, Ristenpart WD. The coronavirus pandemic and aerosols: does COVID‐19 transmit via expiratory particles? Aerosol Sci Technol. 2020;54(6):635‐638. [DOI] [PMC free article] [PubMed] [Google Scholar]
- 8. Morawska L, Cao J. Airborne transmission of SARS‐CoV‐2: The world should face the reality. Environ Int. 2020;139:105730. [DOI] [PMC free article] [PubMed] [Google Scholar]
- 9. WHO . Modes of Transmission of Virus Causing COVID‐19: Implications for IPC Precaution Recommendations. 2020. Accessed May 9, 2020. https://www.who.int/news‐room/commentaries/detail/modes‐of‐transmission‐of‐virus‐causing‐covid‐19‐implications‐for‐ipc‐precaution‐recommendations
- 10. U.S. CDC . Coronaviruses. Updated February 15, Accessed April 01, 2020. https://www.cdc.gov/coronavirus/types.html
- 11. Encyclopaedia Britannica . Coronavirus. Accessed April 01, 2020. https://www.britannica.com/science/coronavirus‐virus‐group
- 12. Lim YX, Ng YL, Tam JP, Liu DX. Human coronaviruses: a review of virus‐host interactions. Diseases. 2016;4:26. [DOI] [PMC free article] [PubMed] [Google Scholar]
- 13. U.S. CDC . COVID‐19. https://www.cdc.gov/coronavirus/2019‐ncov/faq.html#Spread
- 14. Xie X, Li Y, Chwang ATY, Ho PL, Seto WH. How far droplets can move in indoor environments‐revisiting the Wells evaporation‐falling curve. Indoor Air. 2007;17(3):211‐225. [DOI] [PubMed] [Google Scholar]
- 15. Lu J, Gu J, Li K, et al. COVID‐19 outbreak associated with air conditioning in restaurant, Guangzhou, China, 2020. Emerg Infect Dis. 2020;26(7):1628‐1631. [DOI] [PMC free article] [PubMed] [Google Scholar]
- 16. Doremalen NV, Bushmaker T, Morris DH, et al. Aerosol and surface stability of SARS‐CoV‐2 as compared with SARS‐CoV‐1. N Engl J Med. 2020;382(16):1564‐1567. [DOI] [PMC free article] [PubMed] [Google Scholar]
- 17. Bisag A, Isabelli P, Laurita R, et al. Cold atmospheric plasma inactivation of aerosolized microdroplets containing bacteria and purified SARS‐CoV‐2 RNA to contrast airborne indoor transmission. Plasma Processes Polym. 2020;17(10):2000154. [Google Scholar]
- 18. Somsen GA, van Rijn C, Kooij S, Bem RA, Bonn D. Small droplet aerosols in poorly ventilated spaces and SARS‐CoV‐2 transmission. Lancet Respir Med. 2020;8(7):658‐659. [DOI] [PMC free article] [PubMed] [Google Scholar]
- 19. Liu Y, Ning Z, Chen Y, et al. Aerodynamic analysis of SARS‐CoV‐2 in two Wuhan hospitals. Nature. 2020;582:557‐560. [DOI] [PubMed] [Google Scholar]
- 20. Nissen K, Krambrich J, Akaberi D, et al. Long‐distance airborne dispersal of SARS‐CoV‐2 in COVID‐19 wards. Sci Rep. 2020;10:19589. [DOI] [PMC free article] [PubMed] [Google Scholar]
- 21. Klepeis NE, Nelson WC, Ott WR, et al. The National Human Activity Pattern Survey (NHAPS): a resource for assessing exposure to environmental pollutants. J Expo Anal Environ Epidemiol. 2001;11(3):231‐252. [DOI] [PubMed] [Google Scholar]
- 22. Elsaid AM, Mohamed HA, Abdelaziz GB, Ahmed MS. A critical review of heating, ventilation, and air conditioning (HVAC) systems within the context of a global SARS‐CoV‐2 epidemic. Process Saf Environ Prot. 2021;155:230‐261. [DOI] [PMC free article] [PubMed] [Google Scholar]
- 23. Shen J, Kong M, Dong B, Birnkrant MJ, Zhang J. Airborne transmission of SARS‐CoV‐2 in indoor environments: a comprehensive review. Sci Technol Built Environ. 2021;27:1331‐1367. [Google Scholar]
- 24. Noorimotlagh Z, Jaafarzadeh N, Martínez SS, Mirzaee SA. A systematic review of possible airborne transmission of the COVID‐19 virus (SARS‐CoV‐2) in the indoor air environment. Environ Res. 2021;193:110612. [DOI] [PMC free article] [PubMed] [Google Scholar]
- 25. Agarwal N, Meena CS, Raj BP, et al. Indoor air quality improvement in COVID‐19 pandemic: review. Sustain Cities Soc. 2021;70:102942. [DOI] [PMC free article] [PubMed] [Google Scholar]
- 26. Li Y, Qian H, Hang J, et al. Probable airborne transmission of SARS‐CoV‐2 in a poorly ventilated restaurant. Build Environ. 2021;196(5):107788. [DOI] [PMC free article] [PubMed] [Google Scholar]
- 27. Pung R, Chiew CJ, Young BE, et al. Investigation of three clusters of COVID‐19 in Singapore: Implications for surveillance and response measures. Lancet. 2020;395(10229):1039‐1046. [DOI] [PMC free article] [PubMed] [Google Scholar]
- 28. Liu X, Wu J, Liu M, et al. Presymptomatic transmission of COVID‐19 in a cluster of cases occurred in confined space: a case report. 2020.
- 29. Miller SL, Nazaroff WW, Jimenez JL, et al. Transmission of SARS‐CoV‐2 by inhalation of respiratory aerosol in the Skagit Valley Chorale superspreading event. Indoor Air. 2021;31(2):314‐323. [DOI] [PMC free article] [PubMed] [Google Scholar]
- 30. Chen J, He H, Cheng W, et al. Potential transmission of SARS‐CoV‐2 on a flight from Singapore to Hangzhou, China: an epidemiological investigation. Travel Med Infect Dis. 2020;36:101816. [DOI] [PMC free article] [PubMed] [Google Scholar]
- 31. Khanh NC, Thai PQ, Quach HL, et al. Transmission of SARS‐CoV 2 during long‐haul flight. Emerg Infect Dis. 2020;26(11):2617‐2624. [DOI] [PMC free article] [PubMed] [Google Scholar]
- 32. Hoehl S, Karaca O, Kohmer N, et al. Assessment of SARS‐CoV‐2 transmission on an international flight and among a tourist group. JAMA Network Open. 2020;3(8):e2018044. [DOI] [PMC free article] [PubMed] [Google Scholar]
- 33. Choi EM, Chu D, Cheng P, et al. In‐flight transmission of SARS‐CoV‐2. Emerg Infect Dis. 2020;26(11):2713‐2716. [DOI] [PMC free article] [PubMed] [Google Scholar]
- 34. Speake H, Phillips A, Chong T, et al. Flight‐associated transmission of severe acute respiratory syndrome coronavirus 2 corroborated by whole‐genome sequencing. Emerg Infect Dis. 2020;26(12):2872‐2880. [DOI] [PMC free article] [PubMed] [Google Scholar]
- 35. Bae S, Shin H, Koo H, Lee SW, Yang JM, Yon DK. Asymptomatic transmission of SARS‐CoV‐2 on evacuation flight. Emerg Infect Dis. 2020;26(11):2705‐2708. [DOI] [PMC free article] [PubMed] [Google Scholar]
- 36. Swadi T, Geoghegan JL, Devine T, et al. A case study of extended in‐flight transmission of SARS‐CoV‐2 en route to Aotearoa New Zealand. 2020.
- 37. Shen Y, Li C, Dong H, et al. Community outbreak investigation of SARS‐CoV‐2 transmission among bus riders in eastern China. JAMA Intern Med. 2020;180(12):1665‐1671. [DOI] [PMC free article] [PubMed] [Google Scholar]
- 38. Luo K, Lei Z, Hai Z, et al. Transmission of SARS‐CoV‐2 in public transportation vehicles: a case study in Hunan Province, China. Open Forum Infect Dis. 2020;7(10):ofaa430. [DOI] [PMC free article] [PubMed] [Google Scholar]
- 39. Moriarty LF, Plucinski MM, Marston BJ, et al. Public health responses to COVID‐19 outbreaks on cruise ships—worldwide, February–March 2020. Morb Mortal Wkly Rep. 2020;69(12):347‐352. [DOI] [PMC free article] [PubMed] [Google Scholar]
- 40. Xie C, Zhao H, Li K, et al. The evidence of indirect transmission of SARS‐CoV‐2 reported in Guangzhou, China. BMC Public Health. 2020;20(1):1‐9. [DOI] [PMC free article] [PubMed] [Google Scholar]
- 41. Ding J, Yu CW, Cao S. HVAC systems for environmental control to minimize the COVID‐19 infection. Indoor Built Environ. 2020;29(9):1195‐1201. [Google Scholar]
- 42. Guo M, Xu P, Xiao T, He R, Dai M, Miller SL. Review and comparison of HVAC operation guidelines in different countries during the COVID‐19 pandemic. Build Environ. 2021;187:107368. [DOI] [PMC free article] [PubMed] [Google Scholar]
- 43. Chen W, Zhang N, Wei J, Yen H‐L, Li Y. Short‐range airborne route dominates exposure of respiratory infection during close contact. Build Environ. 2020;176:106859. [Google Scholar]
- 44. WHO . Roadmap to improve and ensure good indoor ventilation in the context of COVID‐19. ISBN 978‐92‐4‐002129‐7.
- 45. Bhagat RK, Wykes MSD, Dalziel SB, Linden PF. Effects of ventilation on the indoor spread of COVID‐19. J Fluid Mech. 2020;903:F1. [DOI] [PMC free article] [PubMed] [Google Scholar]
- 46. Buonanno G, Stabile L, Morawska L. Estimation of airborne viral emission: Quanta emission rate of SARS‐CoV‐2 for infection risk assessment. Environ Int. 2020;141:105794. [DOI] [PMC free article] [PubMed] [Google Scholar]
- 47. Zemouri C, Awad SF, Volgenant CMC, Crielaard W, Laheij AMGA, de Soet JJ. Modeling of the transmission of coronaviruses, measles virus, influenza virus, Mycobacterium tuberculosis, and Legionella pneumophila in dental clinics. J Dent Res. 2020;99(10):1192‐1198. [DOI] [PMC free article] [PubMed] [Google Scholar]
- 48. Yao M, Zhang L, Ma J, Zhou L. On airborne transmission and control of SARS‐CoV‐2. Sci Total Environ. 2020;731:139178. [DOI] [PMC free article] [PubMed] [Google Scholar]
- 49. Chin AWH, Chu JTS, Perera MRA, et al. Stability of SARS‐CoV‐2 in different environmental conditions. Lancet Microbe. 2020;1(1):e10. [DOI] [PMC free article] [PubMed] [Google Scholar]
- 50. Newell T. Linking Outdoor Air Temperature and SARS‐CoV‐2 Transmission in the US Using a Two Parameter Transmission Model. 2020.
- 51. Salah B, Xuan ATD, Fouilladieu JL, Lockhart A, Regnard J. Nasal mucociliary transport IN healthy subjects IS slower when breathing dry air. Eur Respir J. 1988;1(9):852‐855. [PubMed] [Google Scholar]
- 52. ASHRAE . ASHRAE position document on infectious aerosols. Approved by ASHRAE Board of Directors, April 14, 2020.
- 53. Hayashi M, Yanagi U, Azuma K, et al. Measures against COVID concerning Summer Indoor Environment in Japan. Jpn Archit Rev. 2020;3(4):423‐434. [Google Scholar]
- 54. Ahlawat A, Wiedensohler A, Mishra SK. An overview on the role of relative humidity in airborne transmission of SARS‐CoV‐2 in indoor environments. Aerosol Air Qual Res. 2020;20(9):1856‐1861. [Google Scholar]
- 55. Feng Y, Marchal T, Sperry T, Yi H. Influence of wind and relative humidity on the social distancing effectiveness to prevent COVID‐19 airborne transmission: a numerical study. J Aerosol Sci. 2020;147:105585. [DOI] [PMC free article] [PubMed] [Google Scholar]
- 56. ASHRAE . ASHRAE Handbook – HVAC Applications (SI). American Society of Heating, Refrigerating and Air Conditioning Engineers; 2011. [Google Scholar]
- 57. Centers for Disease Control and Prevention . Social Distancing. Accessed July 15, 2020. https://www.cdc.gov/coronavirus/2019‐ncov/prevent‐getting‐sick/social‐distancing.html
- 58. Villafruela JM, Olmedo I, Jose JFS. Influence of human breathing modes on airborne cross infection risk. Build Environ. 2016;106:340‐351. [Google Scholar]
- 59. Liu L, Li Y, Nielsen PV, Wei J, Jensen RL. Short‐range airborne transmission of expiratory droplets between two people. Indoor Air. 2016;27(2):452‐462. [DOI] [PubMed] [Google Scholar]
- 60. Olmedo I, Nielsen PV, Adana MR, Jensen RL. The risk of airborne cross infection in a room with vertical low‐velocity ventilation. Indoor Air. 2013;23:62‐73. [DOI] [PubMed] [Google Scholar]
- 61. Olmedo I, Nielsen PV, Adana MR, Jensen RL, Grzelecki P. Distribution of exhaled contaminants and personal exposure in a room using three different air distribution strategies. Indoor Air. 2012;22:64‐76. [DOI] [PubMed] [Google Scholar]
- 62. Bolashikov ZD, Melikov AK, Kierat W, Popiołek Z, Brand M. Exposure of health care workers and occupants to coughed airborne pathogens in a double‐bed hospital patient room with overhead mixing ventilation. HVAC R Res. 2012;18(4):602‐615. [Google Scholar]
- 63. Ai ZT, Hashimoto K, Melikov AK. Influence of pulmonary ventilation rate and breathing cycle period on the risk of cross‐infection. Indoor Air. 2019;6(29):993‐1004. [DOI] [PubMed] [Google Scholar]
- 64. Yang J, Sekhar SC, Cheong KWD, Raphael B. Performance evaluation of a novel personalized ventilation–personalized exhaust system for airborne infection control. Indoor Air. 2015;25(2):176‐187. [DOI] [PubMed] [Google Scholar]
- 65. Muthusamy J, Haq S, Akhtar S, Alzoubi MA, Shamim T, Alvarado J. Implication of coughing dynamics on safe social distancing in an indoor environment—a numerical perspective. Build Environ. 2021;206:108280. [DOI] [PMC free article] [PubMed] [Google Scholar]
- 66. Sun C, Zhai Z. The efficacy of social distance and ventilation effectiveness in preventing COVID‐19 transmission. Sustain Cities Soc. 2020;62:102390. [DOI] [PMC free article] [PubMed] [Google Scholar]
- 67. Jiang Y, Zhao B, Li X, Yang X, Zhang Z, Zhang Y. Investigating a safe ventilation rate for the prevention of indoor SARS transmission: an attempt based on a simulation approach. Build Simul. 2009;2(4):281‐289. [DOI] [PMC free article] [PubMed] [Google Scholar]
- 68. Hang J, Li Y, Jin R. The influence of human walking on the flow and airborne transmission in a six‐bed isolation room: tracer gas simulation. Build Environ. 2014;77:119‐134. [DOI] [PMC free article] [PubMed] [Google Scholar]
- 69. Bhattacharya A, Pantelic J, Ghahramani A, Mousavi ES. Three‐dimensional analysis of the effect of human movement on indoor airflow patterns. Indoor Air. 2021;31(2):587‐601. [DOI] [PubMed] [Google Scholar]
- 70. Das SK, Alam J, Plumari S, Greco V. Transmission of airborne virus through sneezed and coughed droplets. Phys Fluids. 2020;32(9):097102. [DOI] [PMC free article] [PubMed] [Google Scholar]
- 71. Deng Z, Chen Q. What is suitable social distancing for people wearing face masks during the COVID‐19 pandemic? Indoor Air. 2021;32:e12935. [DOI] [PMC free article] [PubMed] [Google Scholar]
- 72. Pendar MR, Páscoa JC. Numerical modeling of the distribution of virus carrying saliva droplets during sneeze and cough. Phys Fluids. 2020;32(8):083305. [DOI] [PMC free article] [PubMed] [Google Scholar]
- 73. To G, Chao C. Review and comparison between the Wells–Riley and dose‐response approaches to risk assessment of infectious respiratory diseases. Indoor Air. 2009;20(1):2‐16. [DOI] [PMC free article] [PubMed] [Google Scholar]
- 74. Riley EC, Murphy G, Riley RL. Airborne spread of measles in a suburban elementary school. Am J Epidemiol. 1978;107:421‐432. [DOI] [PubMed] [Google Scholar]
- 75. Wells WF. Airborne Contagion and Air Hygiene. Cambridge University Press; 1955:117‐122. [Google Scholar]
- 76. Dai H, Zhao B. Association of the infection probability of COVID‐19 with ventilation rates in confined spaces. Build Simul. 2020;13:1321‐1327. [DOI] [PMC free article] [PubMed] [Google Scholar]
- 77. Liu Z, Li R, Wu Y, Ju R, Gao N. Numerical study on the effect of diner divider on the airborne transmission of diseases in canteens. Energy Build. 2021;248(9):111171. [Google Scholar]
- 78. Ko G, Burge HA, Nardell EA, Thompson KM. Estimation of tuberculosis risk and incidence under upper room ultraviolet germicidal irradiation in a waiting room in a hypothetical scenario. Risk Anal. 2001;21:657‐673. [DOI] [PubMed] [Google Scholar]
- 79. Ko G, Thompson KM, Nardell EA. Estimation of tuberculosis risk on a commercial airliner. Risk Anal. 2004;24:379‐388. [DOI] [PubMed] [Google Scholar]
- 80. Gao NP, Niu JL, Perino M, Heiselberg P. The airborne transmission of infection between flats in high‐rise residential buildings: tracer gas simulation. Build Environ. 2008;43:1805‐1817. [DOI] [PMC free article] [PubMed] [Google Scholar]
- 81. Tung YC, Hu SC. Infection risk of indoor airborne transmission of diseases in multiple spaces. Archit Sci Rev. 2008;51:14‐20. [Google Scholar]
- 82. Guo Y, Qian H, Sun Z, et al. Assessing and controlling infection risk with Wells–Riley model and spatial flow impact factor (SFIF). Sustain Cities Soc. 2021;67(17):102719. [DOI] [PMC free article] [PubMed] [Google Scholar]
- 83. Nicas M. An analytical framework for relating dose, risk, and incidence: an application to occupational tuberculosis infection. Risk Anal. 1996;16:527‐538. [DOI] [PubMed] [Google Scholar]
- 84. Armstrong TW, Haas CN. A quantitative microbial risk assessment model for Legionnaire’s disease: animal model selection and dose‐response modeling. Risk Anal. 2007;27:1581‐1596. [DOI] [PubMed] [Google Scholar]
- 85. Armstrong TW, Haas CN. Quantitative microbial risk assessment model for Legionnaire’s disease: assessment of human exposures for selected spa outbreaks. J Occup Environ Hyg. 2007;4:634‐646. [DOI] [PubMed] [Google Scholar]
- 86. Vuorinen V, Aarnio M, Alava M, et al. Modelling aerosol transport and virus exposure with numerical simulations in relation to Sars‐CoV‐2 transmission by inhalation indoors. Saf Sci. 2020;130:104866. [DOI] [PMC free article] [PubMed] [Google Scholar]
- 87. Foat T, Drodge J, Nally J, Parker S. A relationship for the diffusion coefficient in eddy diffusion based indoor dispersion modelling. Build Environ. 2020;169:106591. [Google Scholar]
- 88. Maltezos S, Georgakopoulou A. Novel approach for Monte Carlo simulation of the new COVID‐19 spread dynamics. Infect Genet Evol. 2021;92:104896. [DOI] [PMC free article] [PubMed] [Google Scholar]
- 89. Amaro JE, Dudouet J, Orce JN. Global analysis of the COVID‐19 pandemic using simple epidemiological models. Appl Math Model. 2021;90:995‐1008. [DOI] [PMC free article] [PubMed] [Google Scholar]
- 90. Triambak S, Mahapatra DP. A random walk Monte Carlo simulation study of COVID‐19‐like infection spread. Phys A Stat Mech Appl. 2021;574:126014. [DOI] [PMC free article] [PubMed] [Google Scholar]
- 91. Lai ACK, Chen FZ. Comparison of a new Eulerian model with a modified Lagrangian approach for particle distribution and deposition indoors. Atmos Environ. 2007;41:5249‐5256. [DOI] [PMC free article] [PubMed] [Google Scholar]
- 92. Zhang Z, Chen Q. Comparison of the Eulerian and Lagrangian methods for predicting particle transport in enclosed spaces. Atmos Environ. 2007;41:5236‐5248. [Google Scholar]
- 93. Arefi SMA, Yang CWT, Sin DD, Feng JJ. Simulation of nanoparticle transport and adsorption in a microfluidic lung‐on‐a‐chip device. Biomicrofluidics. 2020;14(4):044117. [DOI] [PMC free article] [PubMed] [Google Scholar]
- 94. Ho CK. Modeling airborne pathogen transport and transmission risks of SARS‐CoV‐2. Appl Math Model. 2021;95:297‐319. [DOI] [PMC free article] [PubMed] [Google Scholar]
- 95. Lu Y, Oladokun M, Lin JZ. Reducing the exposure risk in hospital wards by applying stratum ventilation system. Build Environ. 2020;183:107204. [Google Scholar]
- 96. Srivastava S, Zhao X, Manay A, Chen Q. Effective ventilation and air disinfection system for reducing coronavirus disease 2019 (COVID‐19) infection risk in office buildings. Sustain Cities Soc. 2021;75:103408. [DOI] [PMC free article] [PubMed] [Google Scholar]
- 97. Zhang Z, Chen Q. Prediction of particle deposition onto indoor surfaces by CFD with a modified Lagrangian method. Atmos Environ. 2009;43(2):319‐328. [Google Scholar]
- 98. Chen C, Liu W, Lin CH, Chen Q. Accelerating the Lagrangian method for modeling transient particle transport in indoor environments. Aerosol Sci Technol. 2015;49(5):351‐361. [Google Scholar]
- 99. Ren J, Wang Y, Liu Q, Liu Y. Numerical study of three ventilation strategies in a prefabricated COVID‐19 inpatient ward. Build Environ. 2021;188:107467. [DOI] [PMC free article] [PubMed] [Google Scholar]
- 100. Ahmadzadeh M, Farokhi E, Shams M. Investigating the effect of air conditioning on the distribution and transmission of COVID‐19 virus particles. J Clean Prod. 2021;316:128147. [DOI] [PMC free article] [PubMed] [Google Scholar]
- 101. Ahmadzadeh M, Shams M. Passenger exposure to respiratory aerosols in a train cabin: effects of window, injection source, output flow location. Sustain Cities Soc. 2021;75:103280. [DOI] [PMC free article] [PubMed] [Google Scholar]
- 102. Cui F, Geng X, Zervaki O, et al. Transport and fate of virus‐laden particles in a supermarket: recommendations for risk reduction of COVID‐19 spreading. J Environ Eng. 2021;147(4):04021007. [Google Scholar]
- 103. Borro L, Mazzei L, Raponi M, Piscitelli P, Miani A, Secinaro A. The role of air conditioning in the diffusion of SARS‐CoV‐2 in indoor environments: a first computational fluid dynamic model, based on investigations performed at the Vatican State Children's hospital. Environ Res. 2021;193:110343. [DOI] [PMC free article] [PubMed] [Google Scholar]
- 104. Liu S, Zhao X, Nichols SR, et al. Evaluation of airborne particle exposure for riding elevators. Build Environ. 2021;207:108543. [DOI] [PMC free article] [PubMed] [Google Scholar]
- 105. Li Z, Zhang X, Wu T, Zhu L, Qin J, Yang X. Effects of slope and speed of escalator on the dispersion of cough‐generated droplets from a passenger. Phys Fluids. 2021;33(4):041701. [DOI] [PMC free article] [PubMed] [Google Scholar]
- 106. Khosronejad A, Santoni C, Flora K, et al. Fluid dynamics simulations show that facial masks can suppress the spread of COVID‐19 in indoor environments. AIP Adv. 2020;10:125109. [Google Scholar]
- 107. Fontes D, Reyes J, Ahmed K, Kinzel M. A study of fluid dynamics and human physiology factors driving droplet dispersion from a human sneeze. Phys Fluids. 2020;32:111904. [DOI] [PMC free article] [PubMed] [Google Scholar]
- 108. Dbouk T, Drikakis D. On respiratory droplets and face masks. Phys Fluids. 2020;32:063303. [DOI] [PMC free article] [PubMed] [Google Scholar]
- 109. Dbouk T, Drikakis D. On coughing and airborne droplet transmission to humans. Phys Fluids. 2020;32:053310. [DOI] [PMC free article] [PubMed] [Google Scholar]
- 110. D'Alessandro V, Falone M, Giammichele L, Ricci R. Eulerian‐Lagrangian modeling of cough droplets irradiated by ultraviolet‐C light in relation to SARS‐CoV‐2 transmission. Phys Fluids. 2021;33(3):031905. [DOI] [PMC free article] [PubMed] [Google Scholar]
- 111. Busco G, Yang SR, Seo J, Hassan YA. Sneezing and asymptomatic virus transmission. Phys Fluids. 2020;32:073309. [DOI] [PMC free article] [PubMed] [Google Scholar]
- 112. Abuhegazy M, Talaat K, Anderoglu O, Poroseva SV. Numerical investigation of aerosol transport in a classroom with relevance to COVID‐19. Phys Fluids. 2020;32:103311. [DOI] [PMC free article] [PubMed] [Google Scholar]
- 113. Lieber C, Melekidis S, Koch R, Bauer HJ. Insights into the evaporation characteristics of saliva droplets and aerosols: levitation experiments and numerical modeling. J Aerosol Sci. 2021;154:105760. [DOI] [PMC free article] [PubMed] [Google Scholar]
- 114. Kong X, Guo C, Lin Z, et al. Experimental study on the control effect of different ventilation systems on fine particles in a simulated hospital ward. Sustain Cities Soc. 2021;73:103102. [DOI] [PMC free article] [PubMed] [Google Scholar]
- 115. Li X, Zhang TT, Fan M, et al. Experimental evaluation of particle exposure at different seats in a single‐aisle aircraft cabin. Build Environ. 2021;202(11):108049. [DOI] [PMC free article] [PubMed] [Google Scholar]
- 116. Li Y, Wu C, Cao G, Guan D, Zhan C. Transmission characteristics of respiratory droplets aerosol in indoor environment: an experimental study. Int J Environ Health Res. 2021;4:1‐12. [DOI] [PubMed] [Google Scholar]
- 117. Parker S, Nally J, Foat T, Preston S. Refinement and testing of the drift‐flux model for indoor aerosol dispersion and deposition modelling. J Aerosol Sci. 2010;41(10):921‐934. [Google Scholar]
- 118. Zuo W, Chen Q. Simulations of air distribution in buildings by FFD on GPU. HVAC R Res. 2010;16(6):785‐798. [Google Scholar]
- 119. Chen Q, Zhai Z, You X, Zhang T. Inverse Design Methods for the Built Environment. Routledge; 2017. [Google Scholar]
- 120. Zhao X, Shi Z, Chen Q. Inverse design of an indoor environment using a filter‐based topology method with experimental verification. Indoor Air. 2020;30(5):1039‐1051. [DOI] [PubMed] [Google Scholar]
- 121. Zhang TF, Chen Q. Identification of contaminant sources in enclosed environments by inverse CFD modeling. Indoor Air. 2007;17(3):167‐177. [DOI] [PubMed] [Google Scholar]
- 122. Zhai Z, Liu X, Wang H, Li Y, Liu J. Experimental verification of tracking algorithm for dynamically‐releasing single indoor contaminant. Build Simul. 2012;5(1):5‐14. [DOI] [PMC free article] [PubMed] [Google Scholar]
Associated Data
This section collects any data citations, data availability statements, or supplementary materials included in this article.
Data Availability Statement
The data that support the findings of this study are available from the corresponding author upon reasonable request.