

Abstract
Polymerase chain reaction (PCR) and antigen tests have been used extensively for screening during the severe acute respiratory syndrome coronavirus 2 pandemics. However, the real‐world sensitivity and specificity of the two testing procedures in the field have not yet been estimated without assuming that the PCR constitutes a gold standard test. We use latent class models to estimate the in situ performance of both tests using data from the Danish national registries. We find that the specificity of both tests is very high (>99.7%), while the sensitivities are 95.7% (95% confidence interval [CI]: 92.8%–98.4%) and 53.8% (95% CI: 49.8%–57.9%) for the PCR and antigen tests, respectively. These findings have implications for the use of confirmatory PCR tests following a positive antigen test result: we estimate that serial testing is counterproductive at higher prevalence levels.
Keywords: biostatistics and bioinformatics, epidemiology, SARS coronavirus, test statistics, virus classification
1. INTRODUCTION
Diagnostic testing procedures are crucial to the control of infectious diseases in terms of identifying infectious individuals and estimating the spread of infection. This is particularly true for diseases such as severe acute respiratory syndrome coronavirus 2 (SARS‐CoV‐2), which spread rapidly due partly to asymptomatic individuals. 1 However, it is essential to consider the diagnostic performance of these procedures, including potential effects related to the sampling procedure and accuracy of reporting results, when considering their utility within a disease control program. This requires information on the diagnostic sensitivity and specificity of each of the available tests in a real‐world setting.
There are several challenges involved with providing these estimates. First, analytical sensitivity and specificity estimated under tightly controlled conditions in a laboratory setting may not be representative of the performance in the field, 2 where challenges not directly related to the laboratory procedure such as contamination within the submitted sample might occur. Second, any reference test against which a new diagnostic test is evaluated may itself be imperfect. This necessitates using latent class models (LCMs) to analyze paired testing data to provide unbiased estimates of sensitivity and specificity for both tests being evaluated in the absence of a “gold standard” test. In this context, the term latent refers to the unobserved true state of the individual being tested, rather than a latent infection. These models work by formulating a mathematical expression (a likelihood), for the observed test results with the diagnostic test parameters to be estimated. LCM based on the Hui–Walter paradigm was proposed over 40 years ago 3 and has since become widely used for evaluating diagnostic tests within the veterinary literature. 4 , 5 , 6 , 7 More recently, LCM has also begun to be used within the human medical field. 8 , 9 The LCM is fit to a table of frequencies for each test type, result, and population group. To ensure identifiability of the model, more than two groups are needed with differing prevalence. LCM is typically fit using Bayesian methods so that prior information can be incorporated to further improve identifiability.
A previous study has used field data to evaluate the diagnostic performance of antigen tests but did so assuming that the polymerase chain reaction (PCR) test constituted a gold standard. 10 A further study used LCM to assess the performance of antigen testing using laboratory samples, 11 but this was not based on field data, which provides a more realistic estimate of the performance of diagnostic tests from the perspective of disease control programs. A third meta‐analysis study reanalyzed previously published data using Bayesian methods. 12 A previous study estimated PCR test diagnostic sensitivity and specificity from Ethiopia in a clinical setting. 13 However, to our knowledge, no previous studies have applied LCM to nationwide mass‐scale data to provide estimates of SARS‐CoV‐2 antigen and PCR diagnostic test performance. This paper addresses this gap by using LCM to evaluate the in situ sensitivity and specificity of PCR tests and antigen tests performed during the SARS‐CoV‐2 epidemic in the Danish population between February and June 2021.
2. MATERIALS AND METHODS
2.1. Test terminology
Throughout this paper, the term “PCR test” refers to the entire process of sample collection in the field, analysis of the sample using a nucleic acid amplification test procedure (which is predominantly real‐time [RT]‐PCR in Denmark), and reporting of the result via the national database, to distinguish this concept from the RT‐PCR test itself. Similarly, “antigen test” refers to the entire process including sampling and potentially imperfect use of the various test kits that have been used in Denmark. The estimates thus refer to diagnostic performance in a real‐world setting, in contrast to analytical performance under laboratory conditions. Our analysis follows the STARD‐BLCM reporting guidelines. 14
2.2. Data
The data were extracted from the centralized Danish national registries. Close to 55M tests (PCR + antigen) were recorded during the period, from which we created a subset of test pairs where a PCR test was followed by an antigen test within 10 h. On the basis of observed prevalence in parishes, these pairs were then grouped into prevalence categories as well as a vaccinated category. For more information regarding the data extraction and processing, see Supporting Information: Appendix B.
2.3. Statistical modeling
A two‐test, four‐group LCM was fitted to the frequencies of test pairs. The model assumed constant specificity across all four groups but allowed for varying sensitivity between the partially/fully vaccinated group and the three unvaccinated groups. The model was fit within a Bayesian framework using minimally informative Beta(1,1) priors for the prevalence and weakly information Beta(2,1) priors for the sensitivity and specificity. We employed Monte Carlo integration to obtain a posterior estimate of the false positives/negatives in the serial testing scheme for a varying prevalence between 0.01% and 4%. For more details on the models, see Supporting Information: Appendix C.
3. RESULTS
3.1. Descriptive statistics
A total of 239 221 test pairs (an antigen test taken within 10 h after being sampled for PCR testing) were available from 222 805 individuals. We used the observed prevalence from test results not included in the study to determine high‐/medium‐/low‐prevalence values such that these groups were balanced. Among the study population, 77 439 pairs were from people living in high‐prevalence parishes, 62 837 were from medium‐prevalence parishes, and 57 992 were from low‐prevalence parishes. The vaccinated group had 40 953 test pairs. We assume that each test pair was performed on separate samples for antigen and PCR testing from the same individual, however, a small number of pairs registered with the same date/time stamp (n = 360) may have been based on the same sample. The frequencies for each combination of test results are presented in Table 1, while Figure 1 shows the age distributions of the high‐/medium‐/low‐prevalence groups.
Table 1.
Frequencies for the four groups, three (unvaccinated) prevalence based and one vaccinated, of PCR → antigen test data between February 1st, 2021 and June 30th, 2021 for a 10‐h delay between tests
| Subpopulation | PCR result | Antigen result | Frequency |
|---|---|---|---|
| High prevalence | Positive | Positive | 1030 |
| Positive | Negative | 988 | |
| Negative | Positive | 83 | |
| Negative | Negative | 75 338 | |
| Total | 77 439 | ||
| Medium prevalence | Positive | Positive | 557 |
| Positive | Negative | 585 | |
| Negative | Positive | 83 | |
| Negative | Negative | 61 612 | |
| Total | 62 837 | ||
| Low prevalence | Positive | Positive | 269 |
| Positive | Negative | 311 | |
| Negative | Positive | 52 | |
| Negative | Negative | 57 360 | |
| Total | 57 992 | ||
| Vaccinated | Positive | Positive | 151 |
| Positive | Negative | 180 | |
| Negative | Positive | 27 | |
| Negative | Negative | 40 595 | |
| Total | 40 953 | ||
| Grand total | 239 221 |
Note: A total of 239 221 pairs from 222 805 unique individuals were extracted from a pool of ≈55M tests. The population of Denmark is ≈6M.
Abbreviation: PCR, polymerase chain reaction.
Figure 1.
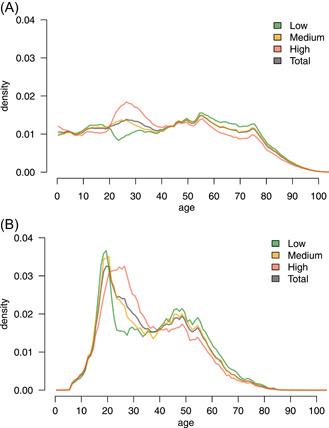
Age distribution across prevalence groups. (A) Age distribution among the full population in each group. The medium‐prevalence group (yellow) follows the total population (gray) to some extent. (B) Age distribution among the tests included in the study. This is skewed towards younger individuals, which is partially due to the heavy use of antigen testing in primary schools, high schools, and universities.
The medium‐prevalence group shows similar age characteristics to the full population, whereas the high‐/low‐prevalence groups have an over/under‐representation of 20–40‐year‐old individuals and an under‐/overrepresentation of >55‐year‐old individuals, respectively.
The high‐prevalence demographics align with 20–40‐year‐olds being the main source of positive tests during May and June 2021. The demographics of individuals taking the test combination PCR → antigen generally follow that of the population taking antigen tests, with some additional sex bias (see Supporting Information: Appendix). Overall, the frequency of antigen testing shifted towards younger individuals for both males and females, possibly reflecting that antigen tests have been used in Denmark to screen for SARS‐CoV‐2 in schools. The demography of the population taking PCR tests is less skewed towards younger individuals, with a higher rate for females than males.
The distribution of time intervals between a positive PCR sample and a subsequent antigen test is independent of the result of the antigen test (Figure 2). There was a slightly longer interval on average between a negative PCR sample and a negative antigen test compared to that between a negative PCR sample and a positive antigen test. However, a Kolmogorov–Smirnov test did not show a significant difference (p = 0.370). There was, however, a significant (p < 0.001) reduction in time intervals following a positive PCR test compared to that following a negative PCR test, regardless of the antigen test result (Figure 2), indicating that individuals are more likely to have a positive PCR sample are more likely to take an antigen test shortly after their PCR test.
Figure 2.
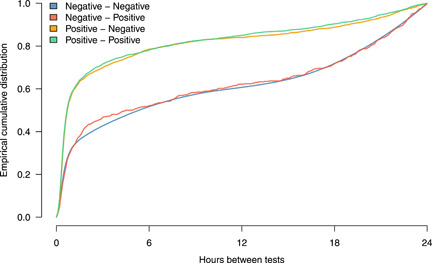
Distributions of time intervals (up to 24 h) between PCR and antigen tests (in hours). The legend describes the test outcomes (PCR – antigen). Note that a positive result from a PCR sample is followed more rapidly by an antigen test than is the case for a negative result from a PCR sample. PCR, polymerase chain reaction.
3.2. Statistical results
Frequencies for the combinations of paired test results for each group are shown in Table 1. The Hui–Walter model was fit to these to obtain effective sample sizes above 1000 for all parameters. Results are presented in Table 2. The specificity of PCR sampling was estimated as 99.85% (95% confidence interval, CI: [99.73; 99.97]), and the specificity of antigen testing was estimated as 99.93% (95% CI: [99.91; 99.96]). The corresponding sensitivity estimates for unvaccinated individuals were 95.68% (95% CI: [92.79; 98.43]) for PCR and 53.82% (95% CI: [49.83; 57.93]) for antigen testing. The corresponding sensitivity estimates for vaccinated individuals were 97.44% (95% CI: [91.55; 100]) for PCR and 56.01% (95% CI: [44.50; 69.84]) for antigen testing, that is, credible intervals overlap between vaccinated and unvaccinated individuals for both tests.
Table 2.
LCM estimates (in %) from the model data
| Test | Parameter | Median | 2.5% | 97.5% |
|---|---|---|---|---|
| Antigen | Se | 53.82 | 49.83 | 57.93 |
| Se (vaccinated) | 56.01 | 44.50 | 69.84 | |
| Sp | 99.93 | 99.91 | 99.96 | |
| PCR | Se | 95.68 | 92.79 | 98.43 |
| Se (vaccinated) | 97.44 | 91.55 | 100.00 | |
| Sp | 99.85 | 99.73 | 99.97 | |
| Serial | Se | 51.48 | 47.37 | 55.96 |
| Se (vaccinated) | 54.22 | 42.69 | 68.35 | |
| Sp | 100.00 | 100.00 | 100.00 |
Note: The median estimates show that the specificity is close to 100% for all types of tests. Sensitivities are estimated for the low/medium/high groups combined and the vaccinated group separately. These are around 96%–97% for PCR and 54%–56% for antigen tests for a 10‐h delay. The serial testing scheme assumes that a PCR sample is taken as a follow‐up to a positive antigen test, with the overall result considered positive if both tests are positive. The 100.00% figures for specificity are due to rounding, but evidently suggest a near‐perfect specificity for serial testing.
Abbreviations: LCM, latent class model; PCR, polymerase chain reaction.
Although not of direct interest for this study, the prevalence estimates corresponding to each group are provided in the Supporting Information Appendix (Supporting Information: Table 7). As expected, the estimates for the three unvaccinated groups are highest for the high‐prevalence group and lowest for the low‐prevalence group. The low‐prevalence unvaccinated group credible interval overlaps with that of the vaccinated group, indicating a similar prevalence between these two groups.
Supporting Information: Appendix A shows results for varying the maximum allowable time between PCR testing and antigen testing (time lag). The sensitivity for both antigen and PCR tests was estimated consistently for all time lags with 95% CI overlapping across the range of lag values. Similarly, the specificity of both procedures was estimated consistently across varying time lag values.
3.3. Implications for serial testing
For serial testing, the estimated overall specificity is 100%, while the sensitivity is 51.48% (95% CI: [47.37; 55.96]), see Table 2.
During the study period, there were 35 530 positive antigen samples in Denmark from a total of 32 789 084 tests and 109 922 positive PCR samples from a total of 22 052 829 tests. Applying the Rogan–Gladen estimator, 15 we found a corrected prevalence of 0.0916% based on antigen tests and 0.4121% based on PCR tests. Of the 35 530 positive antigen tests, 28 366 (80%) were followed by a confirmatory PCR sample within 3 days, of which 11 985 of the PCR tests were negative, thus releasing these individuals from quarantine. We, therefore, adopted 80% as a reference for how many positive antigen tests would be followed (and potentially superseded) by a PCR sample in the scenarios of varying prevalence.
Table 3 shows the estimated total number of test result cases (and 95% credible limits) of false positives/negatives for antigen testing alone compared with serial testing. The number of false positives at the national level is around 21–22 000 for a prevalence between 0.01% and 4%. As Table 3 shows, the serial testing scheme effectively reduces the number of false positives. However, as the prevalence increases, so does the number of false negatives. Since the sensitivity of serial testing is lower compared to antigen testing alone, the rate of increase in false negatives for serial testing is higher. Table 3 presents the estimated increase in false negatives between antigen and serial testing, as well as the decrease in false positives. The balance favors the serial testing scheme when the prevalence is low as the number of eliminated false positives exceeds the expected increase in false negatives. However, a higher prevalence of ≈3% favors antigen testing alone, since the median number of false negatives outweighs the false positives in this scenario. These results show that the implicit tradeoff between sensitivity and specificity in serial testing should be taken into account when using this strategy during a disease outbreak.
Table 3.
Estimated false‐positive (FP) and false‐negative (FN) cases for 32 789 084 tests and per 10 000 individuals for both antigen testing alone and serial (antigen → PCR) testing for varying prevalence p
| FP | FN | ||||||||||||
|---|---|---|---|---|---|---|---|---|---|---|---|---|---|
| Cases in Denmark | Cases per 10 000 | Cases in Denmark | Cases per 10 000 | ||||||||||
| Test | p | Median | 2.5% | 97.5% | Median | 2.5% | 97.5% | Median | 2.5% | 97.5% | Median | 2.5% | 97.5% |
| Antigen | 0.01% | 22 098 | 13 311 | 31 015 | 6.74 | 4.07 | 9.47 | 1514 | 1379 | 1645 | 0.46 | 0.42 | 0.5 |
| Antigen | 0.1% | 22 078 | 13 332 | 31 020 | 6.73 | 4.09 | 9.48 | 15 141 | 13 794 | 16 450 | 4.62 | 4.21 | 5.02 |
| Antigen | 0.4% | 22 011 | 13 259 | 30 894 | 6.71 | 4.05 | 9.43 | 60 564 | 55 177 | 65 800 | 18.47 | 16.83 | 20.07 |
| Antigen | 1% | 21 879 | 13 179 | 30 708 | 6.67 | 4.02 | 9.37 | 151 410 | 137 941 | 164 499 | 46.18 | 42.07 | 50.17 |
| Antigen | 2% | 21 658 | 13 046 | 30 398 | 6.61 | 3.99 | 9.28 | 302 820 | 275 883 | 328 998 | 92.35 | 84.14 | 100.34 |
| Antigen | 3% | 21 437 | 12 913 | 30 088 | 6.54 | 3.94 | 9.18 | 454 230 | 413 824 | 493 497 | 138.53 | 126.21 | 150.51 |
| Antigen | 4% | 21 216 | 12 780 | 29 778 | 6.47 | 3.90 | 9.08 | 605 640 | 551 766 | 657 996 | 184.71 | 168.28 | 200.68 |
| Serial | 0.01% | 32 | 3 | 65 | 0.01 | 0.00 | 0.02 | 1591 | 1444 | 1726 | 0.49 | 0.44 | 0.53 |
| Serial | 0.1% | 32 | 3 | 65 | 0.01 | 0.00 | 0.02 | 15 909 | 14 439 | 17 258 | 4.85 | 4.4 | 5.26 |
| Serial | 0.4% | 32 | 3 | 65 | 0.01 | 0.00 | 0.02 | 63 635 | 57 756 | 69 033 | 19.41 | 17.61 | 21.05 |
| Serial | 1% | 32 | 3 | 64 | 0.01 | 0.00 | 0.02 | 159 088 | 144 391 | 172 582 | 48.52 | 44.04 | 52.63 |
| Serial | 2% | 31 | 3 | 64 | 0.01 | 0.00 | 0.02 | 318 175 | 288 782 | 345 163 | 97.04 | 88.07 | 105.27 |
| Serial | 3% | 31 | 3 | 63 | 0.01 | 0.00 | 0.02 | 477 263 | 433 174 | 517 745 | 145.56 | 132.11 | 157.9 |
| Serial | 4% | 31 | 3 | 62 | 0.01 | 0.00 | 0.02 | 636 351 | 577 565 | 690 326 | 194.07 | 176.15 | 210.54 |
| Change | 0.01% | 22 076 | 13 378 | 31 068 | 6.73 | 4.08 | 9.48 | 76 | 26 | 125 | 0.02 | 0.01 | 0.04 |
| Change | 0.1% | 22 056 | 13 366 | 31 040 | 6.73 | 4.08 | 9.47 | 763 | 263 | 1253 | 0.23 | 0.08 | 0.38 |
| Change | 0.4% | 21 990 | 13 326 | 30 947 | 6.71 | 4.06 | 9.44 | 3054 | 1050 | 5012 | 0.93 | 0.32 | 1.53 |
| Change | 1% | 21 857 | 13 246 | 30 761 | 6.67 | 4.04 | 9.38 | 7634 | 2626 | 12 530 | 2.33 | 0.8 | 3.82 |
| Change | 2% | 21 636 | 13 112 | 30 450 | 6.6 | 4 | 9.29 | 15 269 | 5252 | 25 059 | 4.66 | 1.6 | 7.64 |
| Change | 3% | 21 416 | 12 978 | 30 139 | 6.53 | 3.96 | 9.19 | 22 903 | 7878 | 37 589 | 6.99 | 2.4 | 11.46 |
| Change | 4% | 21 195 | 12 844 | 29 829 | 6.46 | 3.92 | 9.1 | 30 538 | 10 504 | 50 118 | 9.31 | 3.2 | 15.29 |
Note: Serial testing essentially reduces the FP cases to near zero while increasing the FN rates, while increasing the FNs with rising prevalence. The “change” shows the difference between antigen alone and serial testing. The decrease in FPs balances the FNs at a 3% prevalence.
Abbreviation: PCR, polymerase chain reaction.
4. DISCUSSION
To the best of our knowledge, no previous studies have used LCM to assess the diagnostic performance of PCR and antigen testing for SARS‐CoV‐2 in the field. We combined the Danish national registry data with appropriate models to obtain unbiased estimates of the sensitivity and specificity of PCR and antigen testing. Note that in this paper, we refer to a “test” as the entire process of sampling and processing samples to obtain a result. Hence, the results are not comparable to analytical laboratory sensitivities and specificities, since bias may be introduced from several sources which we cannot distinguish between. The study period is selected to reflect a period when tests were freely available on a mass scale in Denmark. As such, no limitation on test availability is assumed.
Specificity was estimated as 99.85% (95% CI: [99.73; 99.97]) for PCR and 99.93% (95% CI: [99.91; 99.96]) for antigen testing. These estimates are in line with the clinical performance of the antigen test kits used in Denmark (see Supporting Information: Table 8), with narrow 95% credible intervals due to the high number of true negatives. The sensitivity was estimated as 95.68% (95% CI: [92.79; 98.43]) for PCR and 53.82% (95% CI: [49.83; 57.93]) for antigen testing. These estimates have wider credible bands due to the relatively low number of true positives in Denmark during this time. The model allowed the sensitivity for the group of vaccinated individuals to differ from that of unvaccinated individuals. The 95% credible intervals overlapped, implying no evidence for a difference in diagnostic test performance due to the vaccination status of the individual, but these findings should be considered in light of a relatively low number of vaccinated individuals in our study and a correspondingly wide 95% CI for the sensitivity estimate. Despite these limitations, our results show that the sensitivity of PCR testing in Denmark is relatively high (i.e., over 91.5% in the lower end of the credible interval, and potentially as high as 100% for vaccinated individuals). However, our results emphasize that the PCR test should not be considered a gold standard, but rather a well‐performing, but imperfect test, when evaluating the performance of other tests.
Compared to previous results, 10 we found a similar, although marginally higher, specificity for antigen testing. This increase is most likely due to false‐negative PCR results being erroneously attributed to false‐positive antigen tests. However, our estimate of sensitivity (53.82%) is substantially lower than their value (68.9%). There are multiple possible reasons for this discrepancy. First, our data was not collected under a research protocol, that is, under more controlled conditions than expected from field data, which might increase the diagnostic test performance. Furthermore, the study by Jakobsen et al. 10 used data collected on December 26th, 2020, and out of their 4697 sampled individuals, 705 (15%) reported symptoms, while 3008 (64%) reported no symptoms. For the symptomatic group, the sensitivity climbed to 78.8% versus 49.2% for the group without symptoms. On the basis of a voluntary questionnaire when booking a PCR test in Denmark, 10.0% reported that they “showed COVID‐19 symptoms.” Between February and March 2021, the group of self‐reported symptoms ranged from 4.7% to 7.2%. As such, the proportion of individuals with symptoms in the field data is lower than in the previous study, which may negatively impact the overall sensitivity of antigen tests.
A serial testing scheme was employed in Denmark to reduce the number of false positives when screening with antigen tests. Our study highlights the cost of this strategy in terms of increased false negatives and shows that the expected number of false negatives has increased during the study period due to the serial testing scheme. As demonstrated, this depends on the true prevalence, with the reduction of false positives balancing out the increase of false negatives at a prevalence of 3%. Under the scenarios, we examined the increase in false negatives for a prevalence between 0.01% and 0.04% is expected to be between 763 and 3054, see Table 3. The corresponding reduction in false positives is expected to be between 22 056 and 21 990. This implies a tradeoff between 29:1 (prevalence at 0.01%) to 7:1 (prevalence at 0.04%) in favor of reducing false positives. A serial testing strategy is, therefore, justifiable during periods of low prevalence, but decision‐makers should consider this implicit tradeoff when prevalence is high.
The study period covers the 5‐month period from February 1st to June 30th, 2021. Antigen tests were rolled out in 2021, with daily tests increasing rapidly by February. During this period, females were overrepresented in the PCR → antigen data, which is partially due to frequent PCR testing being used to screen the female‐dominated population of healthcare professionals. There is also a bias towards younger individuals, which is partly caused by the application of antigen screening in educational institutions. As such, the study period covers a period of increasing test numbers and an initially low incidence that increased during the study period and peaked around the end of May. During this period, mass vaccination began with the oldest age groups and others with a high risk of hospitalization, continuing with younger and less vulnerable groups. From March 2021, the national lockdown transitioned to reopening schools and shops, following increased social activity. This highlights that the study period covers a time during the pandemic when multiple factors influenced the incidence rates. An important factor in this period was the shift towards younger generations as the main driver of infections. The Hui‐Walter model paradigm requires the use of multiple groups with differing prevalence, but identical specificity and sensitivity. To maximize the ability of the model to extract information from the data, we artificially stratified the test pairs based on the observed prevalence in the parish of residence.
As with all LCM, we must consider the implicit meaning of the latent class that we are estimating. 14 The definition of this latent class is tied to the statistical concepts inherent to the LCM and represents the underlying “true state” on which the test results can be considered to be conditionally independent. 16 However, the “true state” in the LCM sense may not perfectly match the biological definition of “infected” or “infectious.” This is because RT‐PCR tests detect viral RNA, while antigen tests detect viral antigen. Therefore, the latent state implicitly defined by the LCM is “presence of viral RNA and antigens in the samples” rather than “individual is infected with virus.” It is, therefore, possible that part of the reason for the estimated imperfect sensitivity of the PCR test based on the LCM is due to the detection of either early‐stage or late‐stage infection corresponding to detectable levels of viral RNA, but the absence of viral antigens, which may be considered by the LCM as a “true negative.” Additionally, it is also important to highlight the self‐selection bias caused by nonrandom sampling of individuals for testing. It is uncommon for an individual to take an antigen test within 10 h following a PCR test, and we cannot expect these individuals to be representative of the general population. The true interpretation of the prevalence estimates presented here is, therefore: “the 5‐month average prevalence of virus shedding among the individuals in each of the subgroups, who took an antigen test within 10 h of a PCR test.” There is also a strong temporal confounding of these estimates due to the gradual roll‐out of vaccines in Denmark – the vaccinated group is predominantly represented by tests taken later in the time series when the prevalence is expectedly lower. It may be tempting to compare prevalence estimates from the unvaccinated groups to that of the vaccinated groups. However, there is substantial temporal bias in terms of the proportion of individuals vaccinated over this time period, 17 so vaccination status is therefore confounded with the underlying temporal trends of disease burden in the general population. Furthermore, the official policy on testing varied during the study period. We, therefore, note that the prevalence estimates for each of the four groups should not be interpreted as the prevalence of either clinical disease or SARS‐CoV‐2 infection in these groups. Although we do not consider the prevalence estimates to be directly useful, they are necessary parameters within the Hui–Walter framework and we, therefore, report them as advised by the STARD‐BLCM reporting guidelines. 14
There are additional assumptions and limitations associated with this study. The data were collected as test pairs where an antigen test was taken within 10 h of a PCR test. The usual response time for the PCR sample over this time period was between 10 and 36 h, with a mean of 14 h, implying that the PCR result would usually be unknown before taking the antigen test. The antigen test is therefore assumed independent of the PCR test, conditional on the latent disease state of the individual. A small number of individuals may have known their PCR result before having an antigen test, which may have affected their decision to take an antigen test. However, this would be rare, and our sensitivity analysis limiting the maximum time between tests produces similar results. Another important assumption is that the individuals included in the LCM analysis are representative of the expected test sensitivity and specificity. This means that we should have no reason to suspect a higher or lower sensitivity or specificity for individuals getting both tests within 10 h compared to individuals who take only a single test. In reality, it may be the case that the data include a higher proportion of individuals with clinical disease than is true of the general population: as such we might overestimate the sensitivity of both tests. However, we see no reason that the specificity estimates should be in any way biased by our selection criteria, whereas we anticipated the prevalence estimates to be heavily biased because we expect individuals taking both tests to have an increased probability of testing positive. This is the reason that our results show far higher prevalence estimates than the general prevalence reported in Denmark over this period. Crucially, the bias in prevalence estimates does not impact our estimates for sensitivity and specificity due to the fundamental properties of the LCM. It should also be recognized that our estimates are based on data from Denmark between February and July 2021: findings may differ in other studies based on different data, particularly if the fundamental properties of test procedures differ over time. Finally, we emphasize that our results refer to overall diagnostic sensitivity and specificity in the field, thus including potential sources of error that are extraneous to the tests themselves such as sample contamination, mislabelling, and misreporting of results. These estimates of diagnostic sensitivity and specificity are highly relevant when evaluating screening tests in terms of the overall effectiveness within a disease control program.
5. CONCLUSION
Our results show that the in situ diagnostic specificity of antigen and PCR testing was ≈100% for both tests and that the diagnostic sensitivity was ≈54% and ≈96%, respectively, as used in the Danish national control program for SARS‐CoV‐2 between February and July 2021. These numbers imply that confirmatory testing based on PCR following positive antigen tests increases the number of overall false‐negative results. When the prevalence is low (<1%), a small increase in false negatives may be tolerated due to the relatively large reduction in false positives, but when the prevalence is high (>3%), the increase in false negatives exceeds the reduction in false positives. The imperfect performance of PCR testing in the field should therefore be accounted for when considering COVID‐19 testing policies.
AUTHOR CONTRIBUTIONS
Jacob Stærk‐Østergaard and Matthew J. Denwood processed and analyzed the data. Jacob Stærk‐Østergaard, Carsten Kirkeby, Lasse E. Christiansen, and Matthew J. Denwood conceptualized and formulated ideas. Jacob Stærk‐Østergaard, Carsten Kirkeby, and Matthew J. Denwood wrote the initial draft. Michael A. Andersen, Camilla H. Møller, and Marianne Voldstedlund contributed specific sections of the text. All authors reviewed and approved the final version of the manuscript.
CONFLICT OF INTEREST
The authors declare no conflict of interest.
ETHICS STATEMENT
This study was carried out exclusively using existing data contained within the Danish national data registries. Individual‐level data were processed within the secure computing environment provided by the Danish Health Data Authority and were aggregated before being extracted in the form of the results presented, which do not contain individual‐level data of any kind. Therefore, this study does not require ethical approval under Danish law or consideration under the European General Data Protection Regulation.
Supporting information
Supplementary information.
Supplementary information.
Supplementary information.
ACKNOWLEDGMENT
The authors received funding from (statens serum institut) concurrently with undertaking this study.
Stærk‐Østergaard J, Kirkeby C, Christiansen LE, et al. Evaluation of diagnostic test procedures for SARS‐CoV‐2 using latent class models. J Med Virol. 2022;94:4754‐4761. 10.1002/jmv.27943
DATA AVAILABILITY STATEMENT
The data that support the findings of this study are available in the Supporting Information of this article.
REFERENCES
- 1. World Health Organization . Recommendations for national SARS‐COV‐2 testing strategies and diagnostic capacities: interim guidance (Tech. Rep.); 2021.
- 2. Jansen MD, Guarracino M, Carson M, et al. Field evaluation of diagnostic test sensitivity and specificity for salmonid alphavirus (SAV) infection and pancreas disease (PD) in farmed Atlantic salmon (Salmo salar l.) in Norway using Bayesian latent class analysis. Front Vet Sci. 2019;6:419. [DOI] [PMC free article] [PubMed] [Google Scholar]
- 3. Hui SL, Walter SD. Estimating the error rates of diagnostic tests. Biometrics. 1980;36:167‐171. [PubMed] [Google Scholar]
- 4. Bonde M, Toft N, Thomsen PT, Sørensen JT. Evaluation of sensitivity and specificity of routine meat inspection of danish slaughter pigs using latent class analysis. Prev Vet Med. 2010;94(3‐4):165‐169. [DOI] [PubMed] [Google Scholar]
- 5. Rydevik G, Innocent GT, McKendrick IJ. Evaluating diagnostic tests with near‐perfect specificity: use of a Hui–Walter approach when designing a trial of a diva test for bovine tuberculosis. Front Vet Sci. 2018;5:192. [DOI] [PMC free article] [PubMed] [Google Scholar]
- 6. Elsohaby I, Mahmmod YS, Mweu MM, et al. Accuracy of PCR, mycobacterial culture and interferon‐γ assays for detection of Mycobacterium bovis in blood and milk samples from Egyptian dairy cows using Bayesian modelling. Prev Vet Med. 2020;181:105054. [DOI] [PubMed] [Google Scholar]
- 7. Cheung A, Dufour S, Jones G, et al. Bayesian latent class analysis when the reference test is imperfect. Rev Sci Tech. 2021;40:271‐286. [DOI] [PubMed] [Google Scholar]
- 8. Hartnack S, Eusebi P, Kostoulas P. Bayesian latent class models to estimate diagnostic test accuracies of COVID‐19 tests. J Med Virol. 2021;93(2):639‐640. [DOI] [PMC free article] [PubMed] [Google Scholar]
- 9. Hadgu A, Dendukuri N, Wang L. Evaluation of screening tests for detecting Chlamydia trachomatis: bias associated with the patient‐infected‐status algorithm. Epidemiology. 2012;23(1):72‐82. http://www.jstor.org/stable/23214179 [DOI] [PubMed] [Google Scholar]
- 10. Jakobsen KK, Jensen JS, Todsen T, et al. Detection of SARS‐COV‐2 infection by rapid antigen test in comparison with RT‐PCR in a public setting. medRxiv. 2021;1(22):21250042. 10.1101/2021.01.22.21250042 [DOI] [Google Scholar]
- 11. Saeed S, O'Brein SF, Abe K, et al. Severe acute respiratory syndrome coronavirus 2 (SARS‐COV‐2) seroprevalence: Navigating the absence of a gold standard. PLOS ONE. 2021;16(9):e0257743. 10.1371/.journal.pone.0257743 [DOI] [PMC free article] [PubMed] [Google Scholar]
- 12. Kostoulas P, Eusebi P, Hartnack S. Diagnostic accuracy estimates for COVID‐19 real‐time polymerase chain reaction and lateral flow immunoassay tests with Bayesian latent‐class models. Am J Epidemiol. 2021;190(8):1689‐1695. [DOI] [PMC free article] [PubMed] [Google Scholar]
- 13. Sisay A, Abera A, Dufera B, et al. Diagnostic accuracy of three commercially available one step RT‐PCR assays for the detection of SARS‐CoV‐2 in resource limited settings. PLoS One. 2022;17:e0262178. [DOI] [PMC free article] [PubMed] [Google Scholar]
- 14. Kostoulas P, Nielsen SS, Branscum AJ, et al. STARD‐BLCM: standards for the reporting of diagnostic accuracy studies that use Bayesian latent class models. Prev Vet Med. 2017;138:37‐47. [DOI] [PubMed] [Google Scholar]
- 15. Rogan WJ, Gladen B. Estimating prevalence from the results of a screening test. Am J Epidemiol. 1978;107:71‐76. [DOI] [PubMed] [Google Scholar]
- 16. Toft N, Jørgensen E, Højsgaard S. Diagnosing diagnostic tests: evaluating the assumptions underlying the estimation of sensitivity and specificity in the absence of a gold standard. Prev Vet Med. 2005;68:19‐33. [DOI] [PubMed] [Google Scholar]
- 17. SSI , “Covid‐19 dashboard.” Accessed August 24, 2021. https://experience.arcgis.com/experience/1c7ff08f6cef4e2784df7532d16312f1.
Associated Data
This section collects any data citations, data availability statements, or supplementary materials included in this article.
Supplementary Materials
Supplementary information.
Supplementary information.
Supplementary information.
Data Availability Statement
The data that support the findings of this study are available in the Supporting Information of this article.