

Abstract
The ongoing global COVID‐19 pandemic, caused by the SARS‐CoV‐2 virus, has resulted in significant loss of life since December 2019. Timely and precise virus detection has been proven as an effective solution to reduce the spread of the virus and to track the epidemic. Rapid antigen diagnostics has played a significant role in the frontline of COVID‐19 testing because of its convenience, low cost, and high accuracy. Herein, different types of recently innovated in‐lab and commercial antigen diagnostic technologies with emphasis on the strengths and limitations of these technologies including the limit of detection, sensitivity, specificity, affordability, and usability are systematically reviewed. The perspectives of assay development are looked into.
Keywords: antigen tests, COVID-19, in vitro diagnostics, immnuoassays
Antigen test kits play important roles in the frontline of COVID‐19 testing because of their convenience, low cost, and high accuracy. Herein, different types of recently innovated in‐lab and commercial antigen diagnostic technologies with emphasis on the strengths and limitations of these technologies including the limit of detection, sensitivity, specificity, affordability, and usability are systematically reviewed.
1. Introduction
The SARS‐CoV‐2 virus‐caused COVID‐19 pandemic has resulted in an unprecedented public health disaster and devastating economic damage. SARS‐CoV‐2 infection can cause acute damage to various organs,[ 1, 2, 3 ] particularly the lungs,[ 2, 3, 4 ] and can be fatal in the elderly and those who with heart or lung conditions, weakened immune systems, obesity, or diabetes. Long‐lasting sequelae symptoms including dyspnea, depression, muscle weakness, mobility impairment, etc. in survivors have also been recorded in longitudinal cohort studies.[ 5, 6 ] Since the outbreak of the COVID‐19 pandemic in December 2019, dozens of variants with distinct strain clades have arisen globally (Figure 1a), seven of which were labeled and classified as variants of concern or interest by World Health Organization (WHO)[ 7 ] as of April 12, 2022 (Figure 1b). Despite the recent development of COVID‐19 vaccines,[ 8, 9 ] the lower‐than‐expected vaccination rates,[ 10, 11 ] fast waning vaccine effectiveness,[ 12 ] and ascending demand of booster doses[ 13, 14 ] make the progression of the pandemic difficult to predict. Furthermore, despite their effectiveness in reducing the rates of severe diseases and mortality, none of the available vaccinations have been demonstrated to be effective in stopping the spread of COVID‐19. Therefore, timely detection of COVID‐19 is extremely important for monitoring the scale of infection and for ensuring early treatment.
Figure 1.
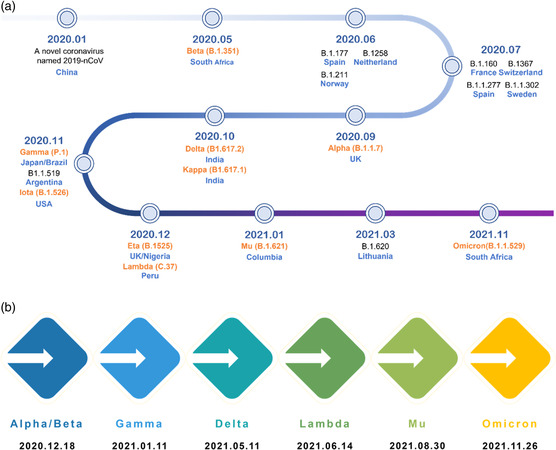
Timeline of the emergence of SARS‐CoV‐2 variants and those of greater concern.[ 116 ] a) Timeline of the emergence of SARS‐CoV‐2 variants. All variants are presented with corresponding first‐identified date, pango lineage, and first‐identified location, ten of which (labeled in orange) have been named by WHO using letters of the Greek Alphabet as of December 2021. b) Date of designation of variants of concern by WHO.
This perspective focuses on the antigen test because it offers distinct advantages over other diagnostic approaches such as the nucleic acid (NA) test and the antibody test. NA tests in general employ polymerase chain reaction (PCR) technology, requiring repetitive temperature control steps for signal amplification, and thus are time‐consuming and instrument dependent.[ 15 ] In contrast, antigen tests are quick and in expensive, with some of them simple to operate, making them suitable for the purposes of use in‐home, at the point of care (POC), and even self‐testing.[ 16 ] So far antigen tests have been broadly used and proven to be able to greatly alleviate the testing demands when PCR resources are saturated due to prematurely relaxing lockdown measures in many countries.[ 17 ] In addition, antigen tests are effective in detecting asymptomatic infections and provide valid results prior to symptom onset for symptomatic infections, which is in contrast to antibody tests that are 1–2 weeks delayed in response (Figure 2 ).
Figure 2.
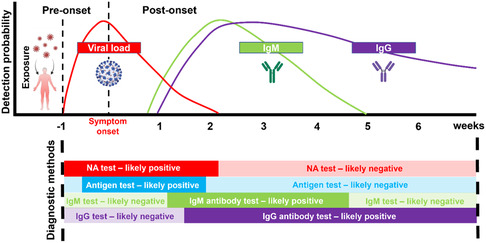
Estimated viral load and immune responses before and after symptom onset[ 106, 117, 118, 119 ] and appropriate diagnostic methods at different phases of infection. This figure was created with BioRender.com.
The omicron variant has become the prevalent strain in most nations since the start of year 3 of the COVID‐19 pandemic. It was fortunate that the measured case fatality rate had fallen considerably, most likely due to the protection of vaccination and the efficacy of new antiviral drugs. As the public is weary and longs for a return to normal, many countries have lifted the lockdown ignoring the fact that omicron is a highly transmissible variant with an average relative R 0 (basic reproduction number) to Delta as 2.5.[ 18 ] As a result, the number of infected people soared, quickly overwhelming the NA testing capacity at many places. Under such backgrounds, commercial antigen test kits especially self‐testing kits were approved for emergency use around the world. More recently excess mortality rate was used to evaluate the damage to the community by Omicron,[ 19, 20 ] highlighting the importance of tighter pandemic control and more frequent testing of potential viral exposure. Up to the date of this manuscript in preparation, more than 1000 commercial antigen test kits have been available in Europe and the United States. We have performed a thorough review of these commercial kits devoting attention to their targets and testing principles, statistically comparing their performance and application scenarios, hoping to guide the choice and use of antigen tests and more importantly to direct future development of pandemic control policy and testing technology.
2. Targets of SARS‐CoV‐2 Antigen Detection
The genome size of SARS‐CoV‐2 is 29.6 kilobase, which only shares 79.0% sequence identity to SARS‐CoV[ 21 ] and thus contributes to the unique pathogenicity of SARS‐CoV‐2.[ 22 ] The SARS‐CoV‐2 contains 16 nonstructural proteins (NSP), 9 other accessory factors, and 4 structural proteins.[ 23 ] Four structural proteins, including spike (S), envelope (E), membrane (M), nucleocapsid (N), are composed of 1273, 75, 222, and 419 amino acids, respectively.[ 24 ] The S protein of SARS‐CoV‐2 is a trimeric glycoprotein consisting of two subunits (S1 and S2) upon cleavage by the host protease, responsible for attachment and fusion of viral and cellular membranes through angiotensin‐converting enzyme 2 (ACE2) of the host cells, respectively[ 25 ] (Figure 3 ). The important physiological role and abundance of S protein potentiate a good target in antigen diagnostic tests. However, it was soon realized that the S protein contains mutation hotspots. These mutations even caused significant changes of the overall protein structure[ 26, 27 ] that are in turn responsible for altered antigenic properties. Taken together, it is not practical to develop an anti‐S antibody‐based antigen test kit that could be applied to detect all variants from Alpha to Omicron and the next new variants (Figure 3). To date, most COVID‐19 test kits, especially commercial ones, target the N protein, which is the most conserved protein among all four structural proteins and is more abundant than the E and M proteins[ 28 ] (Table 1 ).
Figure 3.
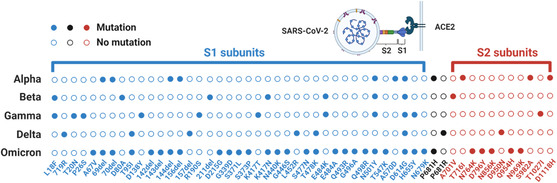
Mutations of S proteins in different SARS‐CoV‐2 variants. Mutations are called in reference to Wuhan‐Hu‐1 (NCBI Reference Sequence: NC 045512.2).[ 120, 121 ] S1 and S2 subunits are labeled in blue and red, respectively.
Table 1.
Mutated amino acid count of Omicron variant (BA.1) by comparing with Wuhan‐Hu‐1 (NCBI Reference Sequence: NC 045512.2) reference sequence.[ 120, 121 ]
| Structural proteins | Mutational counts [amino acid] | Mutation rates [normalized by length] |
|---|---|---|
| Spike (S) | 32 | 2.51% |
| Envelope (E) | 1 | 1.33% |
| Membrane (M) | 3 | 1.35% |
| Nucleocapsid (N) | 4 | 0.95% |
3. Principles of SARS‐CoV‐2 Antigen Tests
Based on the testing principles, the existing Sars‐CoV‐2 antigen tests can be categorized into lateral flow assay (LFA), enzyme‐linked immunosorbent assay (ELISA), chemiluminescence assay (CLIA), electrochemical assay, and surface plasmon resonance (SPR) assay (Figure 4 ).
Figure 4.
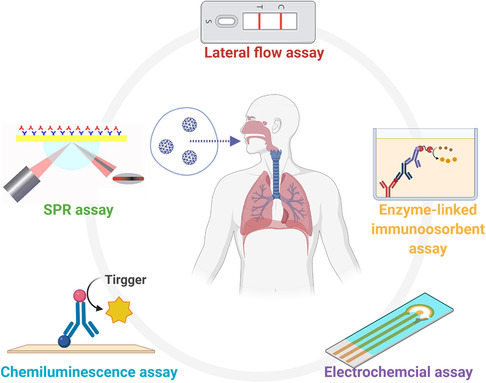
Common SARS‐CoV‐2 viral antigen diagnostic methods based on different mechanisms. This figure was created with BioRender.com.
4. Lateral Flow Assay (LFA)
LFA is a multilayered paper‐like substrate with functional components including a sample well, a conjugate pad, and a nitrocellulose membrane featured with testing and control lines (Figure 5 ). In a typical LFA test, buffer solution contains lysing components (i.e., Triton X‐100) to decompose the viruses in a collected sample down to small antigen fragments (Figure 5 Step 1), which reduces steric hindrance of target antigen sites and thus facilitates subsequent antigen binding. Sample solution is added to the sample pad and flows toward the conjugated pad (Figure 5 Step 2), where gold nanoparticles conjugated to a specific COVID‐19 antibody (Ab 1) are embedded. The antigens in a positive sample bind to the Ab‐1‐conjugated nanoparticles and form complexes (Figure 5 Step 3), which continue to migrate and are immobilized by another antibody (Ab 2) at the test line (Figure 5 Step 4). An irrelevant antibody pair is often employed with one conjugated to gold nanoparticles and the other at the control line (Figure 4 Step 5 and 6).
Figure 5.
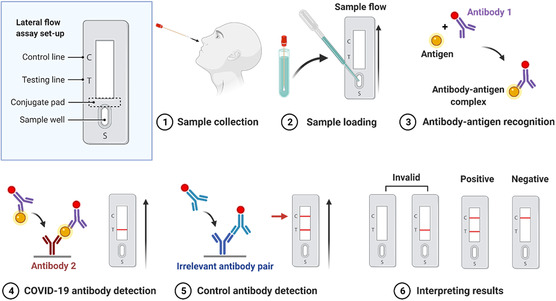
Schematic of testing workflow and mechanism of a typical LFA, created with BioRender.com.
The limit of detection (LoD) of LFAs are reported to be around 103–104 viral copies mL−1 (equivalent to a Ct value in the range of 20–30 in qPCR assay),[ 29, 30, 31 ] which is considered to be a viral load with relatively low risk of transmission.[ 32 ] Fluorescent dyes are also commonly used for higher sensitivity of LFAs.[ 33 ] SARS‐CoV‐2 LFA is valuable as an alternative solution to NA testing for large‐scale screening due to its easy operation, low cost, and fast readout. Its accuracy has also been recognized by certain regions in the implementation of public health and travel policies.[ 34, 35, 36 ] The major disadvantage of LFA lies in its relative low sensitivity compared with NA testing. In addition, color appearance and intensity is based on subjective perception and thus a significant difference in test sensitivity was found between professional and self‐trained users.[ 37 ] Smartphones[ 38, 39, 40 ] and artificial intelligence[ 41, 42 ] have been employed to overcome this limitation by improving result interpretation and data collection.
5. Enzyme‐Linked Immunosorbent Assay (ELISA)
ELISA is a common assay in analytical biochemistry, first described by Engvall and Perlmann in 1971,[ 43 ] particularly for soluble protein targets like peptides,[ 44 ] antibodies,[ 45 ] and hormones.[ 46 ] ELISA detects analyte through a specific antigen–antibody interaction and a subsequent color or fluorescence signal generated from enzyme–substrate reaction[ 47 ] (Figure 6 ). The sandwich ELISA method is particularly suitable for the detection of unconcentrated targets in solution and is therefore the most widely used ELISA method for detection of COVID‐19 antigens.[ 48 ] ELISA test can either qualitatively or quantitatively identify viral copies on the scale of 103 viral copies mL−1.[ 48 ] Such sensitivity is close to the PCR‐based NA tests[ 48 ] and better than typical LFAs.[ 49 ] Moreover, the signal intensities(absorbance or fluorescence) of ELISA are well correlated with the concentrations of the analyte.[ 50, 51 ] Thus, it has been used as a standard tool for antibody screening[ 52, 53 ] and methodology evaluation.[ 54, 55 ] Nevertheless, the excellent LoD and sensitivity of ELISA are equipment dependent requiring a fluorescent/color signal reader,[ 56 ] which inevitably increases the complexity of operation and time to result (typically 1−5 h[ 57 ]), restricting its application in point of care testing (POCT) scenarios.[ 55 ]
Figure 6.
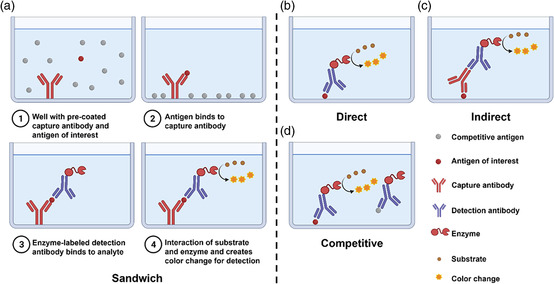
Basic setup and procedures of sandwich ELISA and principles of direct, indirect, and competitive ELISAs. This figure was created with BioRender.com.
6. ChemiLuminescent Immunoassay (CLIA)
Chemiluminesence makes use of a special type of chemical reaction, in which when the intermediates return from their excited state to their stable ground state, a photon is released and can be detected by the luminescent signal instrument.[ 58, 59 ] Based on such a mechanism, chemiluminescence immunoassays (CLIA) is developed for quantitative antigen detection.[ 59 ] In a typical CLIA, magnetic beads coated with anti‐COVID‐19 antibodies (Ab1) (Figure 7a) can specifically bind to SARS‐CoV‐2 viral antigens in clinical samples (Figure 7b). The viral antigen then binds to another antibody (Ab2) conjugated with either lumninophore markers (such as acridinium and ruthenium esters) or enzyme markers (such as alkaline phosphatase and horseradish peroxidase with luminol)[ 60 ] and later forms an Ab 1‐antigen‐Ab 2 immune complex (Figure 7c ).The light emission is often times initiated by adding the pretrigger and/or trigger solutions (Figure 7d ). SARS‐CoV‐2 antigens could be calibrated by the intensity of luminescence.[ 61 ] The compatibility of multiplex tests for various biomarkers and the potential for high‐throughput automation are two of CLIA's primary advantages over traditional LFA.[ 62, 63 ] CLIA may also be adaptable to a variety of test formats and is fast in data collecting with minimum noise interference.[ 30 ]
Figure 7.
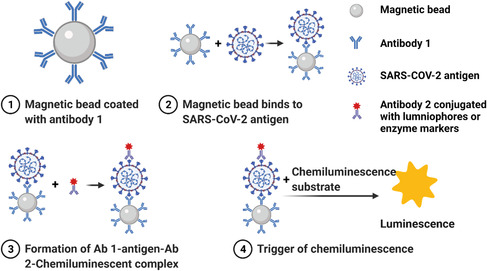
Mechanistic illustration of CLIA detecting SARS‐CoV‐2 antigen. This figure was created with BioRender.com.
7. Electrochemical Assay
In recent years, electrochemical sensors have been rapidly developed for detection of biological markers. Electrochemical signals can be classified as voltametric, impedimetric, and amperometric (Figure 8 ). The electrical signals generated by the redox reactions between their recognition groups and target molecules on the electrode surface[ 40, 64 ] (Figure 8) endow electrochemical sensors high specificity and sensitivity, advantages of both chemical reaction and electrochemical conduction.[ 40 . 49 ] Unlike LFA and ELISA employing multiple antibodies, the electrochemical sensor‐based platform requires no complex labeling reagent.[ 34, 65 ] This technology has been used in detection of COVID‐19 antigen with great performance manifested by low LoD and high specificity.[ 35 ] Electrochemical sensors that are capable of distinguishing various forms of SARS‐CoV‐2 spike proteins have been reported.[ 66 ] Compared with traditional ELISA and NA tests, electrochemical sensors have much faster readouts (within a few minutes) and lower manufacturing costs,[ 37, 67 ] Furthermore, electrochemical assays can be easily integrated with digital analysis and big data collection using cloud‐connected mobile apps.[ 68, 69, 70 ] Other advantages of the electrochemical assay include portability, less reagent consumption, and less preprocessing, with all well suited for POCT.[ 71, 72 ] Taken together, the electrochemical sensor‐based platform is promising not only for COVID diagnosis but also for the detection of many other disease biomarkers.[ 67 ]
Figure 8.
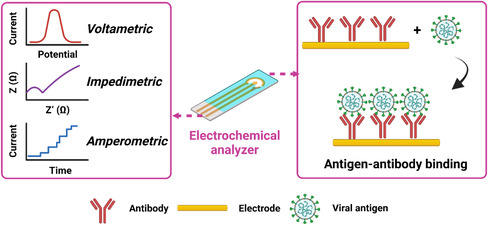
Principles of electrochemical techniques used for the detection of SARS‐CoV‐2 viral antigens. Inputs of antigen–antibody binding can be output in forms of voltametric, impedimetric, and amperometric signals via an electrochemical analyzer. This figure was created with BioRender.com.
8. Surface Plasmon Resonance (SPR) Assay
The SPR assay enables rapid measurements of kinetics and affinity of bimolecular binding in real‐time and quantitative fashion.[ 73 ] It is based on the electromagnetic resonance of the collective oscillations of free electrons occurring at a plasmonic metallic interface(i.e., a thin gold film)[ 74 ] (Figure 9a). This resonance intensity signal varies with the extent of the absorption of target molecules to ligands grafted onto the interface, which can be accurately detected and then converted to the quantification of molecules of interest[ 75 ] (Figure 9b). The SPR test can transform tiny amounts of viral antigen into sensitive electrical signals, allowing for in situ and dynamic detection of virus presence and concentration.[ 76 ] The SPR assay, in contrast to sophisticated and expensive NA assays, is a relatively simple and low‐cost procedure.[ 77 ] In comparison with LFAs, the SPR assay provides superior LoD and sensitivity,[ 78 ] which can be as low as 100 viral particles mL−1.[ 79 ] This sensitivity is sufficient to classify most clinical samples, given that the median viral load for SARS‐CoV‐2 in nasal specimens was around 6 × 10⁶ copies mL−1.[ 80 ] Briefly, as an antigen detection technology, the SPR assay has good simplicity and sensitivity and can be used as an effective alternative screening method to NA tests in evaluating large numbers of samples.[ 81 ] However, its relatively high equipment dependence and reliance on fine processing of agents are currently prohibitive to POCT scenarios and in‐home use.[ 82 ]
Figure 9.
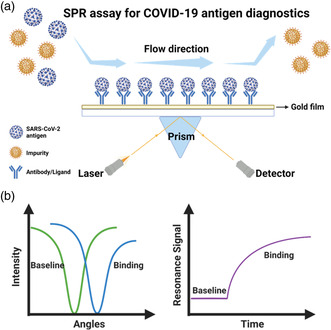
SPR setup for detection of COVID‐19 antigen. a) Schematic of SPR workflows. The antigens of interest are captured by antibodies bound to the gold substrate and can be detected by the change of laser signals. b) Sensorgram of an SPR measurement. Binding of antigen and antibody triggers shifts of laser intensity and resonance signal. This figure was created with BioRender.com.
9. Commercial COVID Antigen Test Kits in Western Countries
The outbreak of COVID‐19 has ushered in a period of rapid market expansion in the diagnostics industry. The global market for COVID‐19 diagnostic services was valued at $60.3 billion in 2020, with an estimated compound annual growth rate (CAGR) of > 15% during 2021–2027.[ 83 ] Compared with the gold standard NA tests, antigen tests have much simpler operation and faster readout, with more flexible facility and operator requirements. Therefore, the development of novel commercial COVID‐19 antigen detection technology to supplement molecular testing is of great significance.
Here we summarized the commercial antigen test kits in the American and European markets. From October 2020 to April 2022, 48 antigen diagnostic tests for SARS‐CoV‐2, from 28 manufacturers, were granted Emergency Use Authorization (EUAs) by Food and Drug Administration (FDA) (Table 2 ). Among them, 32 test kits are classical LFAs providing visual readouts, accounting for two‐thirds of all tests with EUAs. The remaining tests that require additional instruments to aid in the reading include ten fluorescence LFA test kits, four CLIA test kits, one electrochemical assay, and one SPR assay. The simplicity and rapidity of LFAs may be important reasons as to why they are favored by in vitro diagnostics (IVD) companies. In addition, 47 test kits target N protein, and there are only two products targeting RBD domains of S protein, including 1 N/S hybrid test kit. This is most likely due to the fact that S protein is less abundant and more prone to mutations under selective pressure than N protein.[ 84 ] More importantly, many commercial test kits have satisfactory sensitivities (>90%) and specificities (>95%), with a considerable number of kits even claiming 100% specificity, and most test kits can provide results within 30 min.
Table 2.
Commercial COVID‐19 antigen tests issued with U.S. FDA EUAs as of April 6, 2022
| Product namea) | Entity | Date EUA issued or last updated | Mechanism | Target | Readout | PPA+NPA | Authorized settings | Effective time |
|---|---|---|---|---|---|---|---|---|
| Pilot COVID‐19 At‐Home Test | SD Biosensor, Inc. | 04/04/2022 | LFA | N protein | Visual | 95.3%/100% | Home, H, M, W | 20–30 min |
| iHealth COVID‐19 Antigen Rapid Test | iHealth Labs, Inc. | 04/04/2022 | LFA | N protein | Visual | 94.3%/98.1% | Home, H, M, W | 15–30 min |
| BinaxNOW COVID‐19 Antigen Self Test | Abbott Diagnostics Scarborough, Inc. | 04/04/2022 | LFA | N protein | Visual | 84.6%/98.5% | Home, H, M, W | 15–30 min |
| MaximBioClearDetect COVID‐19 Antigen Home Test | Maxim Biomedical, Inc. | 03/30/2022 | LFA | N protein | Visual | 86.9%/98.9% | Home, H, M, W | 15–30 min |
| iHealth COVID–19 Antigen Rapid Test | iHealth Labs, Inc. | 03/29/2022 | LFA | N protein | Visual | 94.3%/98.1% | Home, H, M, W | 15–30 min |
| BD Veritor At‐Home COVID–19 Test | Becton, Dickinson and Company | 03/25/2022 | LFA | N protein | Digital | 84.6%/99.8% | Home, H, M, W | >20 min |
| CareStart COVID‐19 Antigen Home Test | Access Bio, Inc. | 03/25/2022 | LFA | N protein | Visual | 87.0%/98.0% | Home, H, M, W | 10–15 min |
| CelltrionDiaTrust COVID‐19 Ag Home Test | Celltrion USA, Inc. | 03/23/2022 | LFA | N & S protein | Visual | 86.7%/99.8% | Home, H, M, W | 15–20 min |
| CLINITEST Rapid COVID‐19 Antigen Self–Test | Siemens Healthineers | 03/23/2022 | LFA | N protein | Visual | 86.5%/99.3% | Home, H, M, W | 15‐20 min |
| Ellume COVID–19 Home Test | Ellume Limited | 03/18/2022 | LFA (fluorescence) | N protein | Digital | 96.0%/100% | Home, H, M, W | 15 min |
| INDICAID COVID‐19 Rapid Antigen At‐Home Test | PHASE Scientific International, Ltd. | 03/16/2022 | LFA | N protein | Visual | 81.7%/99.4% | Home, H, M, W | 20–25 min |
| Atellica IM SARS‐CoV‐2 Antigen (CoV2Ag) | Siemens Healthcare Diagnostics, Inc. | 03/11/2022 | CLIA | N protein | Digital | 85.1%/100% | H, M | >24 min |
| ADVIA Centaur SARS‐CoV‐2 Antigen (CoV2Ag) | Siemens Healthcare Diagnostics, Inc. | 03/11/2022 | CLIA | N protein | Digital | 85.1%/100% | H, M | >24 min |
| Clip COVID Rapid Antigen Test | Luminostics, Inc. | 03/04/2022 | LFA (fluorescence) | N protein | Digital | 96.9%/100% | H, M, W | >30 min |
| SCoV‐2 Ag Detect Rapid Test | InBios International, Inc. | 03/03/2022 | LFA | N protein | Visual | 86.7%/100% | Home, H, M, W | 20–25 min |
| SCoV‐2 Ag Detect Rapid Self‐Test | InBios International, Inc. | 03/03/2022 | LFA | N protein | Visual | 85.7%/100% | H, M, W | 20–25 min |
| ASSURE‐100 Rapid COVID‐19 Test | Oceanit Foundry LLC | 02/28/2022 | LFA | N protein | Visual | 89.0%/100% | H, M, W | 20–30 min |
| INDICAID COVID‐19 Rapid Antigen Test | PHASE Scientific International, Ltd. | 02/22/2022 | LFA | N protein | Visual | 86.7%/97.2% | H, M, W | 20–25 min |
| Flowflex COVID‐19 Antigen Home Test | ACON Laboratories, Inc | 02/18/2022 | LFA | N protein | Visual | 92.0%/100% | Home, H, M, W | 15–30 min |
| LumiraDx SARS‐CoV‐2 Ag Test | LumiraDx UK Ltd. | 02/17/2022 | LFA | N protein | Digital | 97.6%/96.6% | H, M, W | ~12 min |
| LIAISON SARS‐CoV‐2 Ag | DiaSorin, Inc. | 02/16/2022 | CLIA | N protein | Digital | 84.4%/99.5% | H, M | 120‐180 min |
| BinaxNOW COVID‐19 Ag Card | Abbott Diagnostics Scarborough, Inc. | 02/04/2022 | LFA | N protein | Visual | 84.6%/98.5% | Home, H, M, W | 15–30 min |
| BinaxNOW COVID‐19 Ag Card Home Test | Abbott Diagnostics Scarborough, Inc. | 02/04/2022 | LFA | N protein | Visual | 84.0%/98.3% | H, M, W | 15–30 min |
| Nano‐Check COVID‐19 Antigen Test | Nano‐Ditech Corp. | 02/01/2022 | LFA | N protein | Visual | 90.3%/100% | H, M, W | 15–20 min |
| InteliSwab COVID‐19 Rapid Test Rx | OraSure Technologies, Inc. | 01/27/2022 | LFA | N protein | Visual | 85.0%/98.0% | Home, H, M, W | 30–40 min |
| InteliSwab COVID‐19 Rapid Test | OraSure Technologies, Inc. | 01/27/2022 | LFA | N protein | Visual | 85.0%/98.0% | Home, H, M, W | 30–40 min |
| InteliSwab COVID‐19 Rapid Test Pro | OraSure Technologies, Inc. | 01/27/2022 | LFA | N protein | Visual | 85.0%/98.0% | Home, H, M, W | 30–40 min |
| iHealth COVID‐19 Antigen Rapid Test Pro | iHealth Labs, Inc. | 01/14/2022 | LFA | N protein | Visual | 88.2%/100% | H, M, W | 15–30 min |
| Simoa SARS‐CoV‐2 N Protein Antigen Test | Quanterix Corporation | 12/21/2021 | LFA | N protein | Visual | 83.9%/99.9% | H, M | 10–20 min |
| Sienna‐Clarity COVID‐19 Antigen Rapid Test Cassette | Salofa Oy | 12/17/2021 | LFA | N protein | Visual | 87.5%/98.9% | H, M, W | 10–20 min |
| BD Veritor System for Rapid Detection of SARS‐CoV‐2 | Becton, Dickinson and Company | 12/10/2021 | LFA (fluorescence) | N protein | Digital | 84.0% /100% | H, M, W | 15–20 min |
| CareStart COVID‐19 Antigen Test | Access Bio, Inc. | 12/02/2021 | LFA | N protein | Visual | 93.4%/99.3% | H, M, W | 10–15 min |
| GenBody COVID‐19 Ag | GenBody Inc. | 11/17/2021 | LFA | N protein | Visual | 91.1%/100% | H, M, W | 15–20 min |
| VITROS Immunodiagnostic Products SARS‐CoV‐2 Antigen Reagent Pack | Ortho Clinical Diagnostics, Inc. | 11/16/2021 | CLIA | N protein | Digital | 80.0%/100% | H, M | >48 min |
| QuickVue SARS Antigen Test | Quidel Corporation | 11/09/2021 | LFA | N protein | Visual | 96.8%/99.1% | H, M, W | 10–15 min |
| Status COVID‐19/Flu A&B | Princeton BioMeditech Corp. | 10/27/2021 | LFA | N protein | Visual | 93.1%/100% | H, M, W | 15–20 min |
| QuickVue At‐Home OTC COVID‐19 Test | Quidel Corporation | 10/21/2021 | LFA | N protein | Visual | 83.5%/99.2% | Home, H, M, W | 10–15 min |
| SPERA COVID‐19 Ag Test | Xtrava Health | 10/12/2021 | LFA | N protein | Visual | 91.8%/96.9% | H, M, W | 15‐30 min |
| NIDS COVID‐19 Antigen Rapid Test Kit | ANP Technologies, Inc | 09/24/2021 | LFA | N protein | Visual | 95.1%/97.0% | H, M, W | 15–30 min |
| CelltrionDiaTrust COVID‐19 Ag Rapid Test | Celltrion USA, Inc. | 09/01/2021 | LFA | N protein | Visual | 93.3%/99.0% | H, M, W | 15–20 min |
| QIAreach SARS‐CoV‐2 Antigen | QIAGEN GmbH | 08/05/2021 | LFA (fluorescence) | N protein | Digital | 85.0%/99.1% | H, M | 2–15 min |
| ellume.lab COVID Antigen Test | Ellume Limited | 07/08/2021 | LFA (fluorescence) | N protein | Digital | 81.8%/100% | H, M, W | 3–15 min |
| Sofia SARS Antigen FIA | Quidel Corporation | 06/11/2021 | LFA (fluorescence) | N protein | Digital | 96.7%/100% | H, M, W | ~15 min |
| Omnia SARS‐CoV‐2 Antigen Test | Qorvo Biotechnologies, LLC. | 04/13/2021 | SPR assay | N protein | Digital | 89.5%/100% | H, M | 15–20 min |
| BD Veritor System for Rapid Detection of SARS‐CoV‐2 & Flu A+B | Becton, Dickinson and Company | 03/24/2021 | LFA (fluorescence) | N protein | Digital | 86.7%/99.5% | H, M, W | 15–20 min |
| QuickVue At‐Home COVID‐19 Test | Quidel Corporation | 03/01/2021 | LFA | N protein | Visual | 84.8%/99.1% | Home, H, M, W | 10–15 min |
| Sampinute COVID‐19 Antigen MIA | Celltrion USA, Inc. | 10/23/2020 | Electrochemical assay | S protein | Digital | 94.4%/100% | H, M | >40 min |
| Sofia 2 Flu + SARS Antigen FIA | Quidel Corporation | 10/02/2020 | LFA (fluorescence) | N protein | Digital | 95.2%/100% | H, M, W | ~15 min |
Products are listed in a sequence of the date EUA issued or last updated. This table is updated from our published work[ 90 ] and the U.S. FDA website.[ 122 ] Effective time is counted from the contact of swab sample and buffer. PPA and NPA stand for positive percentage agreement and negative percentage agreement with NA test thus representing sensitivity and specificity of a test, respectively. N protein: nucleocapsid protein. S protein: Spike protein. H: Laboratories certified under the Clinical Laboratory Improvement Amendments of 1988 (CLIA) that meet requirements to perform high complexity tests. M: Laboratories certified under the Clinical Laboratory Improvement Amendments of 1988 (CLIA) that meet requirements to perform moderate complexity tests. W: Patient care settings operating under a CLIA Certificate of Waiver.
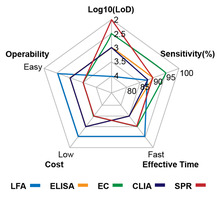
Features including LoD, sensitivity, effective time, cost, and operability of test kits in the U.S. market are summarized using a five‐star chart model (Figure 10 ). Generally, LFA is obviously superior to all other test methods in terms of effective time, cost, and operability, with compromised LoD and sensitivity. Among five methods, ELISA and CLIA exhibit intermediate levels of LoD, sensitivity, cost, and operability. Despite relatively longer assay time required, satisfactory parameters make these two methods as standard protocols in R&D labs but much less popular in self‐testing and POC scenarios. Electrochemical and SPR assays present excellent LoD and sensitivities but their commercial competitiveness is hampered by their high cost, long reaction time, and complex operations. One should recognize that the LoD and sensitivities of the commercial test kits were not necessarily correlated. A possible explanation is that the LoDs were measured with inactivated viruses while the sensitivities were measured with clinic specimens. Particularly, various manufacturers of inactivated viruses might have different quality control standards, which could subsequently lead to different levels of specific antigens arising from unassembled viral particles and different tissue culture infectious dose (TCID) assay results.[ 85 ] Proteins and polysaccharidein saliva and mucus from different individuals could affect the afterward clinic performance as well.[ 86 ]
Figure 10.
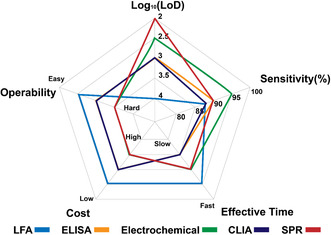
Comparison of current antigen test kits with EUAs in the U.S. using a five‐star chart model. LFA, ELISA, CLIA, and SPR assay are expressed in blue, orange, green, purple, and pink colors, respectively. The unit of LoD is viral copies mL−1. Note: These five‐star dimensions are qualitative or semiquantitative statistics of each test principle obtained from the U.S. FDA website[ 122 ] and might vary with specific commercial products.
During the same period, 1028 antigen test kits were approved with CE marking by the European Commission, including 616 rapid test kits and 412 nonrapid ones (Figure 11a). Among them, 40 rapid test kits and 41 nonrapid test kits were authorized for self‐testing use (Figure 11b). The big difference in numbers of approved antigen test kits may be attributed to the differences of medical regulations, insurances, and government guidelines between the two largest pharmaceutical markets in the world. Indeed, the COVID‐19 diagnosis in the U.S. depended more on NA tests, while the European governments (Britain, Germany, etc.) emphasized the importance of antigen detection much earlier. Among products officially revealing their test principles, 255 kits were based on LFA, accounting for the vast majority of the pool. Numbers of ELISA, CLIA, Electrochemical, and SPR assays were 11, 9, 8, and 1, respectively (Figure 11c). The European market share of LFA products was similar to that in U.S. as the convenience of LFA was well acknowledged by both markets. Interestingly, the antigen targets and test specimens in the European market are more diverse (Figure 11d,e). Benefiting from the supportive regulatory policies of the European Commission, most of these products first appeared in the early stage of the pandemic, revealing that antigen tests could quickly and flexibly respond to the epidemic.
Figure 11.
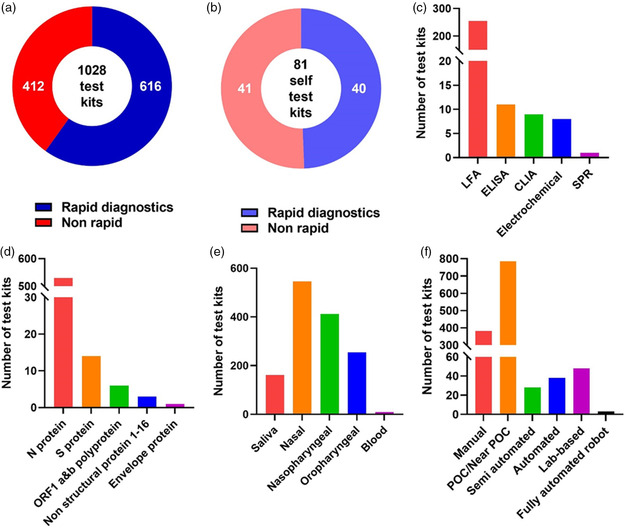
Statistics of COVID‐19 antigen tests issued with CE marking in European Economic Area as of April 6, 2022. All data were collected from the COVID‐19 In Vitro Diagnostic Devices and Test Methods Database.[ 123 ] a) Total number of antigen test kits. b) Total number of antigen test kits classified as self‐test. c) Number of various kits categorized by the European Commission based on detection principle. d) Number of various kits categorized by the European Commission based on target. e) Number of various kits categorized by the European Commission based on specimen. f) Number of various kits categorized by the European Commission based on test format. Note: Statistical classifications in (d–f) are not exclusive as some test kits might apply to multiple targets, specimen, or test formats.
According to FDA statistics, one major concern for antigen testing kits that rely on visual observations is that their sensitivities are generally lower than those that rely on machine reading despite some exceptions perhaps employing higher affinity antibodies and/or fine labeling arts. One solution is to provide better interpretation tools or essential auxiliary devices to convert visual signals to digital readout, which may improve assay LoD and sensitivity. Many European test kits had already been engaged in such attempts that nearly 70 products utilized semiautomated, automated, or even robot‐assisted assays (Figure 11f). Devises or technologies that involve smart phones also facilitate in‐home data collection and result interpretation. An alternative approach is to use bispecific monoclonal antibodies to boost up the signal and improve sensitivity.[ 87 ] Concerns have been raised whether rapid antigen tests for SARS‐CoV‐2 can result in false‐positive test results and undermine pandemic management for COVID‐19. Emerging evidence suggested that the overall rate of false‐positive results among the total rapid antigen test screens for SARS‐CoV‐2 was very low.[ 88, 89 ] However, false‐positive results can occur, especially when used in situations where the prevalence of infection is low, which is true for all in vitro diagnostic tests.
The sample loading volumes in most commercial tests are usually low (i.e., several drops),[ 90 ] because their capillary or microchannel structures relying on passive diffusion to process samples can be easily saturated by excessive fluid. The intrinsic defect significantly slows detection and increases the possibility of false‐negative results. Combining ultrahigh‐throughput hydrodynamic filtration and sandwich immunoassay is one promising solution for increasing sample loading volume.[ 90 ] Indeed, in our recent study, using a simple handheld injection, the microfluidic test kit was able to process fluid samples on a milliliter scale, a volume that was 1–2 orders of magnitude greater than that of conventional methods resulting in improved sensitivity.[ 90 ]
The emergence of SARS‐CoV‐2 variants has also raised concerns about evasion of detection by rapid antigen diagnostics. Indeed, mutation of N protein in SARS‐CoV‐2 VoCs such as D399N and T135I may potentially lead to false‐negative results in rapid antigen tests, despite a high viral load.[ 91, 92 ] Polyclonal anti‐N antibodies have been shown sensitive against various mutants including N501Y, H69/V70, D796H, and D614G.[ 93, 94 ] When a single monoclonal antibody is used for capturing or labeling, it is of greater concern whether the performance of the test could be altered by emerging strains of SARS‐CoV‐2. On the other hand, the FDA requests that antigen test manufacturers report surveillance when an existing test becomes invalid due to a new viral variant.
To expedite identification and isolation of infected cases, COVID‐19 antigen self‐testing has been implemented worldwide. The advantages for antigen testing over NA testing are obvious. Most antigen tests are easy to distribute and could be carried out in home, while NA testing relies on a PCR laboratory, trained professionals, and sophisticated testing procedures, which are further complicated by pooled assays in some highly populated epicenters such as Shanghai.[ 95 ] The individuals in such epicenters have to wait in queues for NA tests, taking the risk of being infected on site, while in‐home antigen self‐testing minimizes the chance of viral exposure. According to studies, more frequent screening reduces the likelihood of an outbreak, and the fast diagnostic turnaround time of an antigen test tends to outweigh the reduced sensitivity of NA testing.[ 96 ] Because antigen testing is simple, low cost, and immediate, massive rapid‐testing programs have been implemented in public places such as schools, hospitals, prisons, airports, borders, workplaces, tourist attractions, and parks. In those crowded places, we envision flexible transoral robot adopted for COVID‐19 swab sampling, reducing the risk of infection while also ensuring accurate swab sampling.[ 88, 89 ] The quarantine and isolation policy for individuals who are antigen‐tested positive varies by countries. Authorities in some countries require an immediate NA test to confirm infection. Currently, certified laboratories and testing sites are committed to report all positive cases to the state or local public health departments. An effective report system for positive cases in antigen self‐test is important for public health surveillance and to avoid community transmission of COVID‐19.
10. Conclusion and Outlook
Antigen detection provides a number of distinct advantages: 1) high speed, low cost, and noninvasive small volumes of sampling;[ 97 ] 2) equipment‐free interpretation of qualitative results and mild equipment dependence to interpret semiquantitative results;[ 98 ] 3) relatively short R&D cycles and quick market‐oriented iterations;[ 99 ] 4) easy sampling and simple testing procedures;[ 100 ] 5) universal test objects and scenarios;[ 101 ] and 6) long shelf‐life and easily achievable storage conditions.[ 102 ]
Antigen tests remain to be further improved in many aspects: 1) inaccurate sample volume affects accuracy (especially in LFA products with manual sample loading);[ 103 ] 2) small sample volume can limit LoD and sensitivity;[ 90 ] 3) antigen–antibody binding signal barely undergoes a secondary amplification like in NA tests; thus, trace amounts of antigen could become undetectable;[ 104 ] 4) time to results is usually uncertain and varies by the volume, viscosity, concentration, etc. of the sample (Table 1); and 5) the fact that antigen–antibody testing relies on macroscopic effects (aggregation, color change, current change, etc.) is problematic due to the intrinsic scarcity of antigen proteins of SARS‐CoV‐2 viruses.[ 105 ] Therefore, the test sensitivity can be uncertain as the virus load gradually drops to a low concentration, which usually occurs in the first 5–7 days before symptom onset and the late postsymptom period.[ 106 ] Nevertheless, daily screening could significantly increase the chance of detection.[ 107 ]
We envision the following future technical developments of current COVID‐19 antigen diagnostic platforms: 1) acceleration of antigen design and high‐throughput screening;[ 108 ] 2) innovation of multiplexed platforms for simultaneous detection of SARS‐CoV‐2 and other pathogens;[ 109 ] 3) combinations of technologies like lab‐on‐a‐chip,[ 110 ] machine learning,[ 111 ] and cloud methods[ 112 ] to increase data collection and reduce misinterpretation of results; 4) improvement of quality controls and manufacturing practices to meet the increasing demand for testing;[ 113 ] and 5) customization of usable and affordable test kits for individuals with disabilities[ 114, 115 ] (i.e., color blindness, impaired mobility) and areas with inadequate medical infrastructure.[ 90 ]
With its accuracy, cost effectiveness, speed, and simplicity, we look forward to antigen testing continuing to play an important role in the battle against the COVID‐19 pandemic.
Conflict of Interest
The authors declare no conflict of interest.
Acknowledgements
J.X. and T.L. thank the Rapid Acceleration of Diagnostics (RADx) program from National Institutes of Health (grant nos. RADx 3343 and RADx 7748) for funding. Y. C. was supported by the Clinical Trials from the Affiliated Drum Tower Hospital, Medical School of Nanjing University (2021‐LCYJ‐PY‐09), Nanjing Medical Science and Technique Development Foundation (QRX17141 and YKK19056). J.X. deeply appreciates the fruitful discussions with Ms. Nan Luo and her help with the figure illustrations.
Biographies
Jiang Xu is a senior scientist and group leader at the Virogin Biotech Inc., Canada. He obtained cotutelle Ph.D. from the Université of Bordeaux and University of Waterloo in 2016, funded by Erasmus Mundus Ph.D. Scholarship. He completed his postdoctoral training at the ESPCI ParisTech, Toronto Metropolitan University, and Harvard Medical School. His group focuses on multidisciplinary research of microfluidics, soft matter, drug delivery, rapid diagnostics, and mRNA vaccine.

Yuxin Chen is an associate director in the Department of Laboratory Medicine from Nanjing Drum Tower Hospital, Nanjing University Medical School, China. She received her Ph.D. from University of Massachusetts Medical University in 2015. Her research interests include rapid diagnosis of infectious disease and host immune responses to viral infection.

Yan Zhang is a chair professor at the School of Pharmaceutical Science and Technology, Tianjin University, China. He received his Ph.D. at the University of Pennsylvania, School of Medicine in 2006. His research interests include metal trafficking, metalloenzymes, radical enzymes, and their catalytic mechanisms. His group combines chemically guided bioinformatics and biochemistry to explore new enzymes and new metabolic pathways in microbes. Other projects in his lab include synthetic biology, immuno‐based human disease diagnosis, and new drug development.

Contributor Information
Jiang Xu, Email: jiang_xu@hms.harvard.edu.
Yuxin Chen, Email: yuxin.chen@nju.edu.cn.
Yan Zhang, Email: yan.zhang@tju.edu.cn.
References
- 1. Zhou B., Zhao W., Feng R., Zhang X., Li X., Zhou Y., Peng L., Li Y., Zhang J., Luo J., Pathog. Dis. 2020, 78, ftaa026. [DOI] [PMC free article] [PubMed] [Google Scholar]
- 2. Liu Q., Shi Y., Cai J., Duan Y., Wang R., Zhang H., Ruan Q., Li J., Zhao L., Ping Y., Nat. Sci. Rev. 2020, 7, 1868. [DOI] [PMC free article] [PubMed] [Google Scholar]
- 3. Li S., Jiang L., Li X., Lin F., Wang Y., Li B., Jiang T., An W., Liu S., Liu H., JCI Insight 2020, 5, 12. [DOI] [PMC free article] [PubMed] [Google Scholar]
- 4. Rendeiro A. F., Ravichandran H., Bram Y., Chandar V., Kim J., Meydan C., Park J., Foox J., Hether T., Warren S., Nature 2021, 593, 564. [DOI] [PMC free article] [PubMed] [Google Scholar]
- 5. Huang L., Yao Q., Gu X., Wang Q., Ren L., Wang Y., Hu P., Guo L., Liu M., Xu J., Lancet 2021, 398, 747. [DOI] [PMC free article] [PubMed] [Google Scholar]
- 6. Xiong Q., Xu M., Li J., Liu Y., Zhang J., Xu Y., Dong W., Clin. Microbiol. Infect. 2021, 27, 89. [DOI] [PMC free article] [PubMed] [Google Scholar]
- 7. Konings F., Perkins M. D., Kuhn J. H., Pallen M. J., Alm E. J., Archer B. N., Barakat A., Bedford T., Bhiman J. N., Caly L., Nat. Microbiol. 2021, 6, 7. [DOI] [PubMed] [Google Scholar]
- 8. Tenforde M. W., MMWR 2021, 70, 1355. [Google Scholar]
- 9. Bernal J. L., Andrews N., Gower C., Gallagher E., Simmons R., Thelwall S., Stowe J., Tessier E., Groves N., Dabrera G., N. Engl. J. Med. 2021, 385, 585. [DOI] [PMC free article] [PubMed] [Google Scholar]
- 10. Sah P., Vilches T. N., Moghadas S. M., Fitzpatrick M. C., Singer B. H., Hotez P. J., Galvani A. P., EClin. Med. 2021, 35, 100865. [DOI] [PMC free article] [PubMed] [Google Scholar]
- 11. J., Rodríguez ; M., Paton ; J. M., Acuna , medRxiv 2021, 2020.10. 12.20211094. [Google Scholar]
- 12. Pouwels K. B., Pritchard E., Matthews P. C., Stoesser N., Eyre D. W., Vihta K.‐D., House T., Hay J., Bell J. I., Newton J. N., Farrar J., Crook D., Cook D., Rourke E., Studley R., Peto T., Diamond I., Walker A. S., Prepr. Univ. Oxford 2021. [Google Scholar]
- 13. Livingston E. H., JAMA 2021, 325, 898. [DOI] [PubMed] [Google Scholar]
- 14. CDC , https://www.cdc.gov/coronavirus/2019-ncov/vaccines/recommendations/immuno.html 2021. (accessed: June 2022).
- 15. Esbin M. N., Whitney O. N., Chong S., Maurer A., Darzacq X., Tjian R., RNA 2020, 26, 771. [DOI] [PMC free article] [PubMed] [Google Scholar]
- 16. Agulló V., Fernández-González M., de la Tabla V. O., Gonzalo-Jiménez N., García J. A., Masiá M., Gutiérrez F., J. Infect. 2021, 82, 186. [DOI] [PMC free article] [PubMed] [Google Scholar]
- 17. Rawson T., Brewer T., Veltcheva D., Huntingford C., Bonsall M. B., Front. Public Health 2020, 8, 262. [DOI] [PMC free article] [PubMed] [Google Scholar]
- 18. Liu Y., Rocklöv J., J. Travel Med. 2022, 29, 3. [DOI] [PMC free article] [PubMed] [Google Scholar]
- 19. Maslo C., Friedland R., Toubkin M., Laubscher A., Akaloo T., Kama B., JAMA 2022, 327, 583. [DOI] [PMC free article] [PubMed] [Google Scholar]
- 20. Madhi S., Kwatra G., Myers J. E., Jassat W., Dhar N., Mukendi C. K., Nana A., Blumberg L., Welch R., Ngorima-Mabhena N., MedRxiv 2021. [DOI] [PMC free article] [PubMed] [Google Scholar]
- 21. Jiang S., Du L., Shi Z., Emerg. Microbes Infect. 2020, 9, 275. [DOI] [PMC free article] [PubMed] [Google Scholar]
- 22. Wu A., Peng Y., Huang B., Ding X., Wang X., Niu P., Meng J., Zhu Z., Zhang Z., Wang J., Cell Host Microbe 2020, 27, 325. [DOI] [PMC free article] [PubMed] [Google Scholar]
- 23. Uddin M., Mustafa F., Rizvi T. A., Loney T., Al Suwaidi H., Al-Marzouqi A. H. H., Kamal Eldin A., Alsabeeha N., Adrian T. E., Stefanini C., Viruses 2020, 12, 526. [DOI] [PMC free article] [PubMed] [Google Scholar]
- 24. Wang S., Trilling M., Sutter K., Dittmer U., Lu M., Zheng X., Yang D., Liu J., Virol. Sin. 2020, 35, 673. [DOI] [PMC free article] [PubMed] [Google Scholar]
- 25. Ou X., Liu Y., Lei X., Li P., Mi D., Ren L., Guo L., Guo R., Chen T., Hu J., Nat. Commun. 2020, 11, 1. [DOI] [PMC free article] [PubMed] [Google Scholar]
- 26. Wong S. W., J. Data Sci. 2020, 18, 511. [Google Scholar]
- 27. Wu S., Tian C., Liu P., Guo D., Zheng W., Huang X., Zhang Y., Liu L., J. Med. Virol. 2021, 93, 2132. [DOI] [PMC free article] [PubMed] [Google Scholar]
- 28. Zhang T., Wu Q., Zhang Z., Curr. Biol. 2020, 30, 1346. [DOI] [PMC free article] [PubMed] [Google Scholar]
- 29. Li K., Huang B., Wu M., Zhong A., Li L., Cai Y., Wang Z., Wu L., Zhu M., Li J., Wang Z., Wu W., Li W., Bosco B., Gan Z., Qiao Q., Wu J., Wang Q., Wang S., Xia X., Nat. Commun. 2020, 11, 6044. [DOI] [PMC free article] [PubMed] [Google Scholar]
- 30. Liu D., Ju C., Han C., Shi R., Chen X., Duan D., Yan J., Yan X., Biosens. Bioelectron. 2020, 173, 112817. [DOI] [PMC free article] [PubMed] [Google Scholar]
- 31. Paul D., Gupta A., Rooge S., Gupta E., J. Virol. Methods 2021, 298, 114299. [DOI] [PMC free article] [PubMed] [Google Scholar]
- 32. Radha R., Shahzadi S. K., Al-Sayah M. H., Molecules 2021, 26, 4812. [DOI] [PMC free article] [PubMed] [Google Scholar]
- 33. Drobysh M., Ramanaviciene A., Viter R., Ramanavicius A., Micromachines 2021, 12, 390. [DOI] [PMC free article] [PubMed] [Google Scholar]
- 34. Yakoh A., Pimpitak U., Rengpipat S., Hirankarn N., Chailapakul O., Chaiyo S., Biosens. Bioelectron. 2021, 176, 112912. [DOI] [PMC free article] [PubMed] [Google Scholar]
- 35. Kudr J., Michalek P., Ilieva L., Adam V., Zitka O., Trends Anal. Chem. 2021, 136, 116192. [DOI] [PMC free article] [PubMed] [Google Scholar]
- 36. Zhang Z., Pandey R., Li J., Gu J., White D., Stacey H. D., Ang J. C., Steinberg C. J., Capretta A., Filipe C. D., Angew. Chem., Int. Ed. 2021, 60, 24266. [DOI] [PMC free article] [PubMed] [Google Scholar]
- 37. Cennamo N., D'Agostino G., Perri C., Arcadio F., Chiaretti G., Parisio E. M., Camarlinghi G., Vettori C., Di Marzo F., Cennamo R., Sensors 2021, 21, 1681. [DOI] [PMC free article] [PubMed] [Google Scholar]
- 38. Del Río J. S., Henry O. Y., Jolly P., Ingber D. E., Nat. Nanotechnol. 2019, 14, 1143. [DOI] [PubMed] [Google Scholar]
- 39. Mojsoska B., Larsen S., Olsen D. A., Madsen J. S., Brandslund I., Alatraktchi F. A., Sensors 2021, 21, 390. [DOI] [PMC free article] [PubMed] [Google Scholar]
- 40. Luong A. D., Buzid A., Vashist S. K., Luong J. H., Curr. Opin. Electrochem. 2021, 30, 100794. [DOI] [PMC free article] [PubMed] [Google Scholar]
- 41. Chen Y., Yao Y., Turetta N., Samorì P., J. Mater. Chem. C 2022, 10, 2494. [Google Scholar]
- 42. Szunerits S., Pagneux Q., Swaidan A., Mishyn V., Roussel A., Cambillau C., Devos D., Engelmann I., Alidjinou E. K., Happy H., Anal. Bioanal. Chem. 2021, 414, 103. [DOI] [PMC free article] [PubMed] [Google Scholar]
- 43. Engvall E., Perlmann P., J. Immunol. 1972, 109, 129. [PubMed] [Google Scholar]
- 44. Aydin S., Peptides 2015, 72, 4. [DOI] [PubMed] [Google Scholar]
- 45. Salimi-Bejestani M., McGarry J., Felstead S., Ortiz P., Akca A., Williams D. J., Res. Vet. Sci. 2005, 78, 177. [DOI] [PubMed] [Google Scholar]
- 46. Bolton J., Sanders J., Oda Y., Chapman C., Konno R., Furmaniak J., Rees Smith B., Clin. Chem. 1999, 45, 2285. [PubMed] [Google Scholar]
- 47. Gaastra W., Proteins, Springer, New York: 1984, p. 349. [Google Scholar]
- 48. Kyosei Y., Namba M., Yamura S., Takeuchi R., Aoki N., Nakaishi K., Watabe S., Ito E., Diagnostics 2020, 10, 594. [DOI] [PMC free article] [PubMed] [Google Scholar]
- 49. Michel M., Bouam A., Edouard S., Fenollar F., Di Pinto F., Mège J.‐L., Drancourt M., Vitte J., Front. Microbiol. 2020, 11, 597529. [DOI] [PMC free article] [PubMed] [Google Scholar]
- 50. Ebinuma H., Miyazaki O., Yago H., Hara K., Yamauchi T., Kadowaki T., Clin. Chim. Acta 2006, 372, 47. [DOI] [PubMed] [Google Scholar]
- 51. Schulze F., Wesemann R., Schwedhelm E., Sydow K., Albsmeier J., Cooke J. P., Böger R. H., Clin. Chem. Lab. Med. 2004, 42, 1377. [DOI] [PubMed] [Google Scholar]
- 52. Paiba G., Anderson J., Paton D., Soldan A., Alexandersen S., Corteyn M., Wilsden G., Hamblin P., MacKay D., Donaldson A., J. Virol. Methods 2004, 115, 145. [DOI] [PubMed] [Google Scholar]
- 53. Baker H. N., Murphy R., Lopez E., Garcia C., J. Vis. Exp. 2012, 62, e4084. [DOI] [PMC free article] [PubMed] [Google Scholar]
- 54. Köller G., Wichmann G., Rolle-Kampczyk U., Popp P., Herbarth O., J. Chromatogr. B 2006, 840, 94. [DOI] [PubMed] [Google Scholar]
- 55. Stejskal D., Lacnak B., Jedelsky L., Stepanova L., Proskova J., Solichova P., Kadalova L., Janosova M., Seitlova P., Karpisek M., in Biomedical Papers of the Medical Faculty of Palacky University in Olomouc, Vol. 151, Biomed Pap Med Fac Univ Palacky, Olomouc Czech Repub: 2007, p. 2. [DOI] [PubMed] [Google Scholar]
- 56. Deckwart M., Carstens C., Webber-Witt Schä M., fer V., Eichhorn L., Kang S., Fischer M., Brockow K., Christmann M., Paschke-Kratzin A., J. Agric. Food Chem. 2014, 62, 6803. [DOI] [PubMed] [Google Scholar]
- 57. Carter L. J., Garner L. V., Smoot J. W., Li Y., Zhou Q., Saveson C. J., Sasso J. M., Gregg A. C., Soares D. J., Beskid T. R., ACS Cent. Sci. 2020, 6, 591. [DOI] [PMC free article] [PubMed] [Google Scholar]
- 58. Cinquanta L., Fontana D. E., Bizzaro N., Autoimmun. Highlights 2017, 8, 1. [DOI] [PMC free article] [PubMed] [Google Scholar]
- 59. Kricka L. J., Cold Spring Harb. Protoc. 2018, 2018, pdb. top098236. [DOI] [PubMed] [Google Scholar]
- 60. Natrajan A., Sharpe D., Costello J., Jiang Q., Anal. Biochem. 2010, 406, 204. [DOI] [PubMed] [Google Scholar]
- 61. Ravi N., Cortade D. L., Ng E., Wang S. X., Biosens. Bioelectron. 2020, 165, 112454. [DOI] [PMC free article] [PubMed] [Google Scholar]
- 62. Vashist S. K., Diagnostics 2020, 10, 202. [Google Scholar]
- 63. Mohit E., Rostami Z., Vahidi H., Expert Rev. Clin. Immunol. 2021, 17, 573. [DOI] [PubMed] [Google Scholar]
- 64. Liu H., Yang A., Song J., Wang N., Lam P., Li Y., Law H. K.‐W., Yan F., Sci. Adv. 2021, 7, eabg8387. [DOI] [PMC free article] [PubMed] [Google Scholar]
- 65. Yousefi H., Mahmud A., Chang D., Das J., Gomis S., Chen J. B., Wang H., Been T., Yip L., Coomes E., J. Am. Chem. Soc. 2021, 143, 1722. [DOI] [PubMed] [Google Scholar]
- 66. Zhang Z., Pandey R., Li J., Gu J., White D., Stacey H. D., Ang J. C., Steinberg C.‐J., Capretta A., Filipe C. D., Angew. Chem., Int. Ed. 2021, 133, 24468. [Google Scholar]
- 67. Mahshid S. S., Flynn S. E., Mahshid S., Biosens. Bioelectron. 2021, 176, 112905. [DOI] [PMC free article] [PubMed] [Google Scholar]
- 68. Raziq A., Kidakova A., Boroznjak R., Reut J., Öpik A., Syritski V., Biosens. Bioelectron. 2021, 178, 113029. [DOI] [PMC free article] [PubMed] [Google Scholar]
- 69. Torrente-Rodríguez R. M., Lukas H., Tu J., Min J., Yang Y., Xu C., Rossiter H. B., Gao W., Matter 2020, 3, 1981. [DOI] [PMC free article] [PubMed] [Google Scholar]
- 70. Lukas H., Xu C., Yu Y., Gao W., ACS Nano 2020, 14, 16180. [DOI] [PubMed] [Google Scholar]
- 71. Asif M., Ajmal M., Ashraf G., Muhammad N., Aziz A., Iftikhar T., Wang J., Liu H., Curr. Opin. Electrochem. 2020, 23, 174. [DOI] [PMC free article] [PubMed] [Google Scholar]
- 72. Chaibun T., Puenpa J., Ngamdee T., Boonapatcharoen N., Athamanolap P., O'Mullane A. P., Vongpunsawad S., Poovorawan Y., Lee S. Y., Lertanantawong B., Nat. Commun. 2021, 12, 1. [DOI] [PMC free article] [PubMed] [Google Scholar]
- 73. Singh P., Sens. Actuators B: Chem. 2016, 229, 110. [Google Scholar]
- 74. Puiu M., Bala C., Sensors 2016, 16, 870. [DOI] [PMC free article] [PubMed] [Google Scholar]
- 75. Shankaran D. R., Gobi K. V., Miura N., Sens. Actuators B: Chem. 2007, 121, 158. [Google Scholar]
- 76. Bong J.‐H., Kim T.‐H., Jung J., Lee S. J., Sung J. S., Lee C. K., Kang M.‐J., Kim H. O., Pyun J.‐C., Biochip J. 2020, 14, 358. [DOI] [PMC free article] [PubMed] [Google Scholar]
- 77. Yüce M., Filiztekin E., Özkaya K. G., Biosens. Bioelectron. 2020, 172, 112752. [DOI] [PMC free article] [PubMed] [Google Scholar]
- 78. Tymm C., Zhou J., Tadimety A., Burklund A., Zhang J. X., Cell. Mol. Bioeng. 2020, 13, 313. [DOI] [PMC free article] [PubMed] [Google Scholar]
- 79. Huang L., Ding L., Zhou J., Chen S., Chen F., Zhao C., Xu J., Hu W., Ji J., Xu H., Biosens. Bioelectron. 2021, 171, 112685. [DOI] [PMC free article] [PubMed] [Google Scholar]
- 80. Jacot D., Greub G., Jaton K., Opota O., Microbes Infect. 2020, 22, 617. [DOI] [PMC free article] [PubMed] [Google Scholar]
- 81. Shrivastav A. M., Cvelbar U., Abdulhalim I., Commun. Biol. 2021, 4, 1. [DOI] [PMC free article] [PubMed] [Google Scholar]
- 82. Cui F., Zhou H. S., Biosens. Bioelectron. 2020, 165, 112349. [DOI] [PMC free article] [PubMed] [Google Scholar]
- 83. BCCResearch , https://www.bccresearch.com/market-research/medical-devices-and-surgical/covid-19-diagnostics-market-report.html 2020. (accessed: August 2020).
- 84. Wang R., Hozumi Y., Yin C., Wei G.‐W., J. Chem. Inf. Comput. Sci. 2020, 60, 5853. [DOI] [PMC free article] [PubMed] [Google Scholar]
- 85. Herrera-Rodriguez J., Signorazzi A., Holtrop M., de Vries-Idema J., Huckriede A., Vaccine 2019, 37, 1630. [DOI] [PMC free article] [PubMed] [Google Scholar]
- 86. Shirazi S., Stanford C. M., Cooper L. F., J. Clin. Med. 2021, 10, 1158. [DOI] [PMC free article] [PubMed] [Google Scholar]
- 87. El Abd Y., Tabll A., Smolic R., Smolic M., Hum. Antibodies 2021, 30, 15. [DOI] [PubMed] [Google Scholar]
- 88. Gans J. S., Goldfarb A., Agrawal A. K., Sennik S., Stein J., Rosella L., JAMA 2022, 327, 485. [DOI] [PMC free article] [PubMed] [Google Scholar]
- 89. Kanji J. N., Proctor D. T., Stokes W., Berenger B. M., Silvius J., Tipples G., Joffe A. M., Venner A. A., J. Clin. Microbiol. 2021, 59, 01411. [DOI] [PMC free article] [PubMed] [Google Scholar]
- 90. Xu J., Suo W., Goulev Y., Sun L., Kerr L., Paulsson J., Zhang Y., Lao T., Small 2021, 17, 2104009. [DOI] [PMC free article] [PubMed] [Google Scholar]
- 91. Bourassa L., Perchetti G. A., Phung Q., Lin M. J., Mills M. G., Roychoudhury P., Harmon K. G., Reed J. C., Greninger A. L., J. Clin. Virol. 2021, 141, 104900. [DOI] [PMC free article] [PubMed] [Google Scholar]
- 92. Jian M.‐J., Chung H.‐Y., Chang C.‐K., Lin J.‐C., Yeh K.‐M., Chen C.‐W., Lin D.‐Y., Chang F.‐Y., Hung K.‐S., Perng C.‐L., Int. J. Infect. Dis. 2022, 114, 112. [DOI] [PMC free article] [PubMed] [Google Scholar]
- 93. Ascoli C. A., Nat. Biotechnol. 2021, 39, 274. [DOI] [PubMed] [Google Scholar]
- 94. Jungnick S., Hobmaier B., Mautner L., Hoyos M., Haase M., Baiker A., Lahne H., Eberle U., Wimmer C., Hepner S., Microorganisms 2021, 9, 1967. [DOI] [PMC free article] [PubMed] [Google Scholar]
- 95. Reuters , https://www.reuters.com/world/china/shanghai-steps-up-quarantine-transfers-new-covid-cases-decline-2022-04-19/ (accessed: April 2022).
- 96. Smith D. R., Duval A., Zahar J. R., Opatowski L., Temime L., Nat. Commun. 2022, 13, 1. [DOI] [PMC free article] [PubMed] [Google Scholar]
- 97. de Lima L. F., Ferreira A. L., Torres M. D., de Araujo W. R., de la Fuente-Nunez C., Proc. Natl. Acad. Sci. 2021, 118, 30. [DOI] [PMC free article] [PubMed] [Google Scholar]
- 98. CDC , https://www.cdc.gov/coronavirus/2019-ncov/lab/guidelines-clinical-specimens.html (accessed: May 2022) 2020.
- 99. Kadir B., Shamsudin M. F., Int. J. Financ. Res. 2019, 10, 75. [Google Scholar]
- 100. Porte L., Legarraga P., Vollrath V., Aguilera X., Munita J. M., Araos R., Pizarro G., Vial P., Iruretagoyena M., Dittrich S., Int. J. Infect. Dis. 2020, 99, 328. [DOI] [PMC free article] [PubMed] [Google Scholar]
- 101. Gong Y., Zheng Y., Jin B., You M., Wang J., Li X., Lin M., Xu F., Li F., Talanta 2019, 201, 126. [DOI] [PubMed] [Google Scholar]
- 102. Jacobs J., Kühne V., Lunguya O., Affolabi D., Hardy L., Vandenberg O., Front. Med. 2020, 7, 557797. [DOI] [PMC free article] [PubMed] [Google Scholar]
- 103. Böger B., Fachi M. M., Vilhena R. O., Cobre A. F., Tonin F. S., Pontarolo R., Am. J, Infect. Control 2021, 49, 21. [DOI] [PMC free article] [PubMed] [Google Scholar]
- 104. Brazaca L. C., Dos Santos P. L., de Oliveira P. R., Rocha D. P., Stefano J. S., Kalinke C., Muñoz R. A. A., Bonacin J. A., Janegitz B. C., Carrilho E., Anal. Chim. Acta 2021, 1159, 338384. [DOI] [PMC free article] [PubMed] [Google Scholar]
- 105. Huang Y., Yang C., Xu X.‐F., Xu W., Liu S.‐W., Acta Pharmacol. Sin. 2020, 41, 1141. [DOI] [PMC free article] [PubMed] [Google Scholar]
- 106. Kim M.‐C., Cui C., Shin K.‐R., Bae J.‐Y., Kweon O.‐J., Lee M.‐K., Choi S.‐H., Jung S.‐Y., Park M.‐S., Chung J.‐W., N. Engl. J. Med. 2021, 384, 671. [DOI] [PMC free article] [PubMed] [Google Scholar]
- 107. Smith R. L., Gibson L. L., Martinez P. P., Ke R., Mirza A., Conte M., Gallagher N., Conte A., Wang L., Fredrickson R., J. Infect. Dis. 2021, 224, 976. [DOI] [PMC free article] [PubMed] [Google Scholar]
- 108. Häuser F., Sprinzl M. F., Dreis K. J., Renzaho A., Youhanen S., Kremer W. M., Podlech J., Galle P. R., Lackner K. J., Rossmann H., Med. Microbiol. Immunol. 2021, 210, 165. [DOI] [PMC free article] [PubMed] [Google Scholar]
- 109. Gillot C., Douxfils J., Cadrobbi J., Laffineur K., Dogné J.‐M., Elsen M., Eucher C., Melchionda S., Modaffarri É., Tré-Hardy M., J. Clin. Med. 2020, 9, 3752. [DOI] [PMC free article] [PubMed] [Google Scholar]
- 110. Asghari A., Wang C., Yoo K. M., Rostamian A., Xu X., Shin J.‐D., Dalir H., Chen R. T., Appl. Phys. Rev. 2021, 8, 031313. [DOI] [PMC free article] [PubMed] [Google Scholar]
- 111. Prakash K. B., Imambi S. S., Ismail M., Kumar T. P., Pawan Y., Int. J. 2020, 8, 5. [Google Scholar]
- 112. Hedde P. N., Abram T. J., Jain A., Nakajima R., de Assis R. R., Pearce T., Jasinskas A., Toosky M. N., Khan S., Felgner P. L., Lab Chip 2020, 20, 3302. [DOI] [PMC free article] [PubMed] [Google Scholar]
- 113. Pollock N. R., Jacobs J. R., Tran K., Cranston A. E., Smith S., O'Kane C. Y., Roady T. J., Moran A., Scarry A., Carroll M., J. Clin. Microbiol. 2021, 59, e00083. [DOI] [PMC free article] [PubMed] [Google Scholar]
- 114. Win A., QJM 2020, 113, 856. [DOI] [PMC free article] [PubMed] [Google Scholar]
- 115. Djalante R., Lassa J., Setiamarga D., Sudjatma A., Indrawan M., Haryanto B., Mahfud C., Sinapoy M. S., Djalante S., Rafliana I., Progr. Disaster Sci. 2020, 6, 100091. [DOI] [PMC free article] [PubMed] [Google Scholar]
- 116. WHO, https://www.who.int/en/activities/tracking-SARS-CoV-2-variants/, 2021. (accessed: June 2022). [Google Scholar]
- 117. Sethuraman N., Jeremiah S. S., Ryo A., JAMA 2020, 323, 2249. [DOI] [PubMed] [Google Scholar]
- 118. Néant N., Lingas G., Le Hingrat Q., Ghosn J., Engelmann I., Lepiller Q., Gaymard A., Ferré V., Hartard C., Plantier J.‐C., Proc. Natl. Acad. Sci. 2021, 118, 8. [DOI] [PMC free article] [PubMed] [Google Scholar]
- 119. Fourati S., Hue S., Pawlotsky J.‐M., Mekontso-Dessap A., de Prost N., Intensive Care Med. 2020, 46, 1781. [DOI] [PMC free article] [PubMed] [Google Scholar]
- 120. Wu F., Zhao S., Yu B., Chen Y.‐M., Wang W., Song Z.‐G., Hu Y., Tao Z.‐W., Tian J.‐H., Pei Y.‐Y., Nature 2020, 579, 265. [DOI] [PMC free article] [PubMed] [Google Scholar]
- 121. Bansal K., Kumar S., Virus Res. 2022, 315, 198765. [DOI] [PMC free article] [PubMed] [Google Scholar]
- 122. FDA , https://www.fda.gov/medical-devices/coronavirus-disease-2019-covid-19-emergency-use-authorizations-medical-devices/in-vitro-diagnostics-euas-antigen-diagnostic-tests-sars-cov-2 (accessed: April 2022).
- 123. European Commission , COVID-19 In Vitro Diagnostic Devices and Test Methods Database, European Commission, UK: 2022, https://covid-19-diagnostics.jrc.ec.europa.eu/devices?device_id=&manufacturer=&text_name=&marking=&method=&rapid_diag=&target_type=&search_method=AND#form_content (accessed: April 2022). [Google Scholar]