Abstract
Serological assay for coronavirus 2019 (COVID‐19) patients including asymptomatic cases can inform on disease progression and prognosis. A detection method taking into account multiplex, high sensitivity, and a wider detection range will help to identify and treat COVID‐19. Here we integrated color‐size dual‐encoded beads and rolling circle amplification (RCA) into a bead‐based fluorescence immunoassay implemented in a size sorting chip to achieve high‐throughput and sensitive detection. We used the assay for quantifying COVID‐19 antibodies against spike S1, nucleocapsid, the receptor binding domain antigens. It also detected inflammatory biomarkers including interleukin‐6, interleukin‐1β, procalcitonin, C‐reactive protein whose concentrations range from pg mL−1 to μg mL−1. Use of different size beads integrating with RCA results in a tunable detection range. The assay can be readily modified to simultaneously measure more COVID‐19 serological molecules differing by orders of magnitude.
Keywords: COVID-19, Microfluidic Immunoassays, Multiplexing, Rolling Circle Amplification, Tunable Detection Range
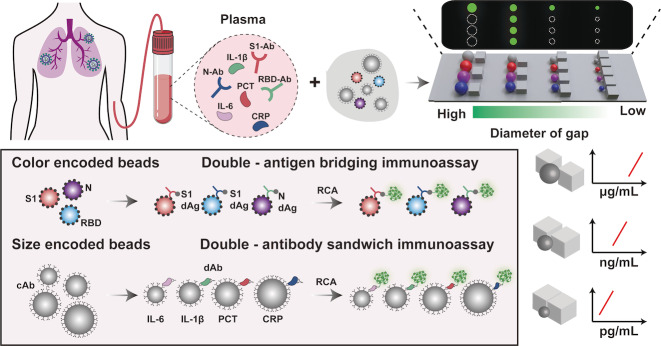
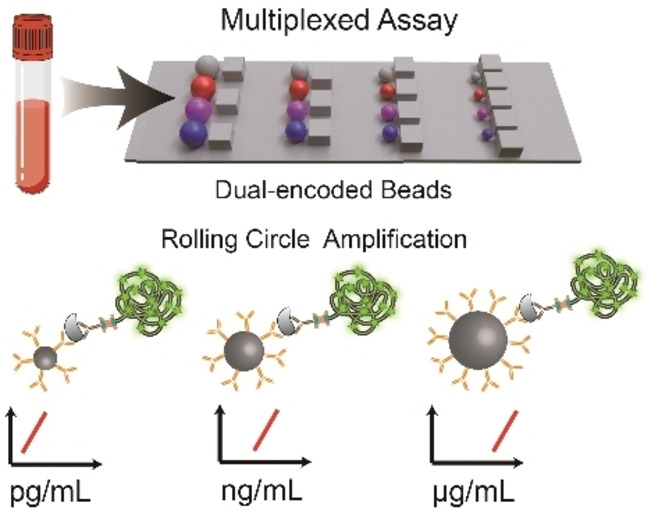
A multiplexed strategy for chip‐based sandwich immunoassays integrated with color/size dual‐barcoded beads and rolling circle amplification (RCA) is presented. RCA based on beads of various sizes allows for a tunable detection range from pg mL−1 to μg mL−1.
Coronavirus 2019 (COVID‐19) caused by novel severe acute respiratory syndrome coronavirus 2 (SARS‐CoV‐2), has led to an unprecedented worldwide pandemic. Serological immunoglobulins and pro‐inflammatory cytokines induced by SARS‐CoV‐2 were observed both in symptomatic patients and some asymptomatic cases. [1] Circulating antibodies specific to SARS‐COV‐2 and inflammatory biomarkers not only provide evidence for diagnosing a SARS‐COV‐2 infection and predicting protective immunity but also give information to evaluate the disease progression and determine therapeutic measures. [2] Such demands for mass population testing and rapid treatment in cases of clinical deterioration promote the development of multiplexing methods for COVID‐19 serology. [3]
Lab‐on‐a‐chip assay allowing high degree integration of all operations of the conventional laboratory on micro‐size chips has performed rapid, economical, and user‐friendly multiplex assays. [4] However, several problems are usually encountered in practice. First, common methods based on position‐coding limit the multiplexing capacities and increase the difficulty of fabrication and operation. [5] Second, it is challenging to achieve high sensitivity for all targets as the problems of nonspecific binding and cross‐reactivity. [6] Third, the detection ranges under a low signal‐to‐noise ratio are too narrow to quantify targets whose concentrations differ by orders of magnitude. [7] Furthermore, human sample preprocessing increases the test time and complexity. It is thus highly important to develop a multiplexed technique that can resolve the above shortcomings and be manufactured in large volumes in COVID‐19 management.
To this end, we integrated dual‐encoded microbeads and rolling circle amplification (RCA) into fluorescence immunoassay based on a size sorting chip (SS‐Chip) for quantitative profiling of COVID‐19 serology (Scheme 1). Our technology incorporates the following advances: i) size/color dual‐encoded beads for a huge barcode library formation; ii) RCA strategy based on immune complex to amplify signals and achieve high sensitivity; iii) immune assay based on various sizes beads with different specific interface area showing tunable detection range; iv) microbarriers on‐chip to deplete blood cells for whole blood sample direct detection. Spike (S) protein and nucleocapsid (N) protein are expressed by SARS‐COV‐2. S1 domain of S protein is exposed on the virus coat. The potion of S1—the receptor binding domain (RBD) binds cells expressing the viral receptor. [8] Above three proteins (N, S1, RBD) are promising antigenic targets for COVID‐19 serology. [9] Here we integrated antigen‐based capture reagent into color‐encoded beads for profiling anti‐N/S1/RBD antibodies with the same detection ranges, and modified capture antibodies on size‐encoded beads to meet the requirement of a broad detection range from pg mL−1 to μg mL−1 as the various abundance of interleukin‐6 (IL‐6), interleukin‐1β (IL‐1β), procalcitonin (PCT), C‐reactive protein (CRP) in human serum. Collectively, these attributes suggest that our platform is a valuable tool for a large number of targets simultaneous profiling, especially for SARS‐COV‐2 medical diagnosis.
Scheme 1.
Schematic showing the multiplex detection strategy on SS‐chip. Serum samples from COVID‐19 patients are introduced into SS‐Chip preloading dual‐encoded beads. SS‐Chip immunoassay employs two parallel assays including a bridging assay with color‐encoded‐beads‐conjugated capture antigens (cAgs) and RCA‐product‐tagged detection antigens (dAgs) to detect anti‐N/S1/RBD antibodies (N‐Ab, S1‐Ab, RBD‐Ab) and a sandwich assay with size‐encoded‐beads‐conjugated capture antibodies (cAbs) and RCA‐product‐tagged detection antibodies (dAbs) to detect IL‐6, IL‐1β, PCT, CRP. Beads with various sizes based on RCA displayed different detection ranges from pg mL−1 to μg mL−1.
To prepare dual‐encoded beads for multiplex detection, we chose four kinds of mesoporous polystyrene beads of different sizes (9 μm, 13 μm, 17 μm, and 21 μm in diameter) as shown in Figure S1, and doped different ratios of blue quantum dots (B‐QDs) and red quantum dots (R‐QDs) into beads using swelling‐evaporation approach (Figure 1a). [10] By adjusting the mixing ratios of R‐QDs and B‐QDs, we generated beads with different fluorescence intensities (Figure S2) and thus got a library of 44 dual‐barcodes (Figure 1b). In addition, the throughput of barcodes can be easily expanded by preparing more microbeads of different sizes. SS‐Chip contains parallel microbarriers consisting of square pillars with various diameters of gaps, whose sizes of adjacent microbarriers differ by 2 μm, between inlet and outlet ranging in size from 30 to 6 μm and 20 to 6 μm, following the direction of fluid flow and allowing optimized beads separation, thus being able to capture 13 or 8 kinds of sizes beads in principle (Figure S3, S4). Such design allows each area to densely pack 71 640 (20 μm in diameter)—447 750 (8 μm in diameter) same‐sized microbeads, and achieve large‐scale imaging with improved sampling efficiency.
Figure 1.
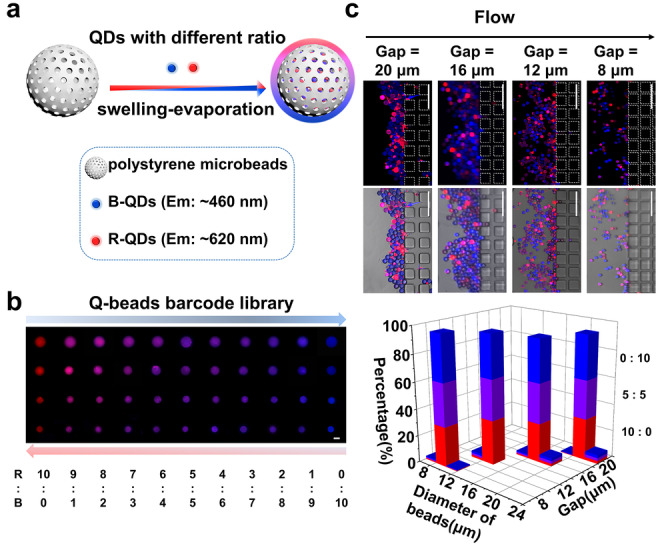
Preparation and imaging of QDs‐beads barcode library. a) Two QDs are mixed at predetermined ratios and embedded into beads. b) Microscope images of barcode library in which beads were encoded by 4 size levels and 11 mixing ratios of QDs. Scale bar: 10 μm. c) Verification of the SS‐chip employing microbarriers to separate dual‐barcoded beads. Scale bars: 100 μm. The bar graph shows the proportion of dual‐barcode beads after the separation of an equal mixture.
To verify the capability of SS‐Chip for barcode identification, we mixed 12 kinds of beads encoded by utilizing four size levels and three mixing ratios (B:R at 0:10, 5:5, 10:0) from the library equally, and then introduced them into SS‐Chip. After separation, we imaged four corresponding microbarriers and calculated the proportions of beads in each area (Figure 1c). Results show the significant separation of various size‐encoded beads on the chip and the diameter of beads in each area was an approximately normal distribution. The overlap percentage of size of beads between the gaps of 8 μm and 12 μm was 1.2 % while between that of 20 μm and 16 μm was 0.83 %, which is within the scope permitted in subsequent detection procedure. The proportion of three color barcodes in every size range is almost trisection, indicating there is little interference and leak happening among different color‐encoded beads. Moreover, we also try to use the microbarriers to eliminate blood cells. Most blood cells are less than 9 μm in diameter and have deformability. [11] Results show that cells all crossed the barriers while beads remained under the hydrodynamic force (Movie S1, Figure S5) and suggest that SS‐Chip immunoassay is potential to directly detect biomolecules in a whole blood sample.
Next, we sought to validate the multiplexing performance of dual‐barcode assay on SS‐Chip by employing two different bead‐based target‐capture strategies to detect both COVID‐19 antibodies and biomarkers in parallel. We employed three color‐encoded beads (Figure S6) and a double‐antigen bridging immunoassay strategy for detecting anti‐N/S1/RBD antibodies. As the concentrations of IL‐6 and IL‐1β are at the pg mL−1, PCT is at the ng mL−1 and CRP is at μg mL−1 in human serum, [7] they were detected in an antibody sandwich assay via beads from small‐size to large‐size. Then the primer sequence linked to the padlock sequence was attached to the above immune complex via streptavidin‐biotin interaction. RCA reaction happened via polymerase catalysis around a circular DNA template to produce a long DNA concatemer with numerous FAM‐labeled dUTP, which provided an amplified signal to indicate captured target on the beads.
Dose‐response curves with fluorescence intensities were scaled with antibody concentration and approximated a sigmoidal curve, demonstrating that the color‐encoded beads assay was responsive to the antibodies of interest (Figure 2a). Importantly, the detection range of biomarkers is based on size‐encoded beads spanning 10 orders of magnitude, which satisfies the need for clinical testing (Figure 2b). For quantitative detection, the linear equations of regressions of IL‐6, IL‐1β, PCT, CRP are Y=32.77×X−16.68 (R 2=0.97), Y=29.94×X−36.22 (R 2=0.97), Y=21.12×X−49.86 (R 2=0.97), Y=17.72×X−98.08 (R 2=0.98) respectively (X=log[concentration]). We also used different size‐encoded beads to detect IL‐6 and found the sensitivity can be controlled by size‐encoded beads integrating with RCA (Figure S8).
Figure 2.
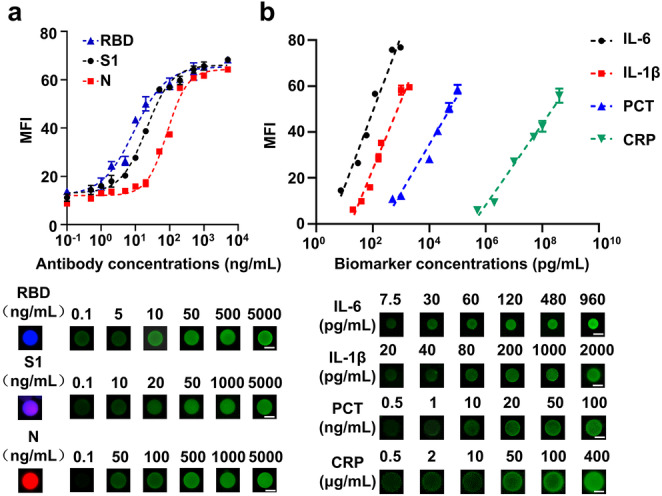
Quantification of antibodies and biomarkers based on dual‐encoded beads immunoassay. a) Analytical dose‐response curves and fluorescence images for detection of anti‐RBD/S1/N antibodies based on color‐encoded beads. Scale bars: 10 μm. b) Linear detection range and fluorescence images for detection of IL‐6, IL‐1β, PCT, CRP based on size‐encoded beads. Scale bars: 10 μm. The error bars represent the standard deviation of three measurements (n=3).
We compared the sensitivity of the RCA assay with that of the traditional assay that uses FITC‐conjugated antibody (Figure 3a). Limits of detection (LODs) for IL‐6, IL‐1β, PCT, and CRP based on RCA immunoassay were 0.540 pg mL−1, 6.536 pg mL−1, 1.145 ng mL−1, 0.347 μg mL−1 respectively, while traditional immunoassay was 328.129 pg mL−1 for IL‐1β and 34.041 ng mL−1 for PCT, displaying 50‐fold and 30‐fold improvement in sensitivity of RCA (Figure 3b). The significant enhancement in LODs is attributed to the effective signal amplification of numerous FAM molecules combined with the immune complex. We evaluated the specificity of the RCA assay based on color/size encoded beads by spiking a single target in undiluted human serum at different concentrations (Figure 3c and Figure S9), which demonstrates that only the target molecule can induce a significant fluorescence intensity. Experiments indicate negligible cross‐reaction happening among each component that should not couple with it. The results validate the high sensitivity and specificity of dual‐barcoded beads integrating RCA immunoassays for quantifying COVID‐19 antibodies and biomarkers.
Figure 3.
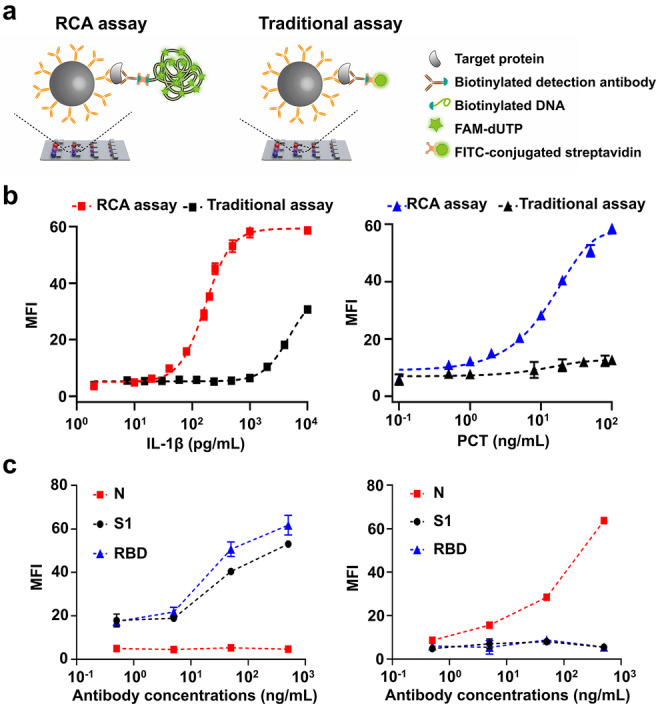
Sensitivity and specificity of SS‐Chip immunoassay. a) Illustration of RCA assay that uses DNA‐conjugated antibody and a traditional assay that uses FITC‐conjugated antibody. b) Detection of IL‐1β and PCT using RCA assay and traditional assay. c) Only anti‐S1/RBD antibodies without anti‐N antibodies (left) and only anti‐N antibodies without anti‐S1/RBD antibodies (right) were spiked into undiluted serum on SS‐Chip immunoassay at different concentrations. The error bars represent the standard deviation of three measurements (n=3).
Finally, we demonstrated the clinical performance of the SS‐Chip immunoassay using plasma samples from COVID‐19‐positive and ‐negative samples. Three antibodies and four biomarkers from each sample were measured on a single SS‐Chip immunoassay (Figure S10). Two‐tailed unpaired t test determined a significant difference between the mean fluorescence intensity of both samples for three antibodies (P<0.0001) while the threshold value for the positive test was assigned as 2 SDs above the mean intensities of negative samples, which can distinguish positive and negative samples accurately (Figure 4a). The correlation analysis of endogenous biomarkers in serum samples shows that SS‐Chip assay measurements closely matched those obtained with standard clinical enzyme‐linked immunosorbent assay (ELISA), demonstrating that our lab‐on‐a‐chip immunoassay achieved high accuracy to detect clinically inflammatory biomarkers (Figure 4b).
Figure 4.
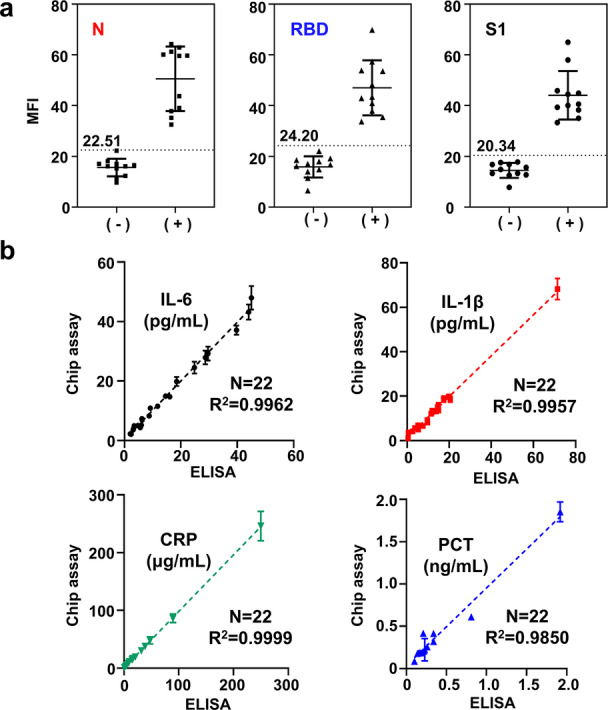
Clinical sample testing. a) Anti‐N/RBD/S1 antibodies testing in COVID‐19 negative controls and positive samples. Dotted lines and values represent 2 SDs above the mean value of negative controls. b) Comparison of SS‐Chip immunoassay with ELISA in patient samples for biomarkers detection. The error bars represent the standard deviation of three measurements (n=3).
The COVID‐19 pandemic has caused significantly global damage, which promotes us to develop more effective measures to control the virus's spread and reduce mortality. A multiplexed serology assay being able to simultaneously evaluate COVID‐19‐associated molecules will bring great benefit to both individuals and populations. [12] In this work, we report a SS‐Chip multiplexed immunoassay by integrating color/size dual‐encoded beads and a RCA strategy. Size‐encoded beads have different specific interface areas and reaction rates, and detection signals are amplified by RCA, which lead to a broad detection range and high sensitivity. Through the collocation of dual‐encoded beads, our assay achieved simultaneously quantifying COVID‐19 associated molecules with different abundances in serum and thus helped to diagnose COVID‐19 and evaluate severity. To our knowledge, it is the first instance using beads of different sizes integrated with rolling circle amplification in the immune complex for a tunable detection range. Compared with other technologies for a broad detection range, [13] our method is more simple and more flexible. Furthermore, it is potential to achieve higher levels and a wider detection range of multiplexing with a more advanced optical design and larger barcode library. In conclusion, the SS‐Chip immunoassay system is a versatile technology for multiplex measuring various abundance circulating analytes and therefore hopefully applied to such fields as clinical diagnosis and point‐of‐care tests.
Conflict of interest
A provisional patent based on this work has been filed.
Supporting information
As a service to our authors and readers, this journal provides supporting information supplied by the authors. Such materials are peer reviewed and may be re‐organized for online delivery, but are not copy‐edited or typeset. Technical support issues arising from supporting information (other than missing files) should be addressed to the authors.
Supporting Information
Supporting Information
Acknowledgements
We would like to acknowledge support from the National Natural Science Foundation of China (82072087, 31970893) and funding by Science and Technology Projects in Guangzhou (202206010087).
Z. Lin, J. Zhang, Z. Zou, G. Lu, M. Wu, L. Niu, Y. Zhang, Angew. Chem. Int. Ed. 2022, 61, e202203706; Angew. Chem. 2022, 134, e202203706.
Contributor Information
Prof. Minhao Wu, Email: wuminhao@mail.sysu.edu.cn.
Prof. Li Niu, Email: lniu@gzhu.edu.cn.
Prof. Yuanqing Zhang, Email: zhangyq65@mail.sysu.edu.cn.
Data Availability Statement
Research data are not shared.
References
- 1.
- 1a. Blanco-Melo D., Nilsson-Payant B. E., Liu W. C., Uhl S., Hoagland D., Møller R., Jordan T. X., Oishi K., Panis M., Sachs D., Wang T. T., Schwartz R. E., Lim J. K., Albrecht R. A., tenOever B. R., Cell 2020, 181, 1036–1045; [DOI] [PMC free article] [PubMed] [Google Scholar]
- 1b. Yüce M., Filiztekin E., Özkaya K. G., Biosens. Bioelectron. 2021, 172, 112752; [DOI] [PMC free article] [PubMed] [Google Scholar]
- 1c. Garcia-Beltran W. F., Lam E. C., Astudillo M. G., Yang D., Miller T. E., Feldman J., Hauser B. M., Caradonna T. M., Clayton K. L., Nitido A. D., Murali M. R., Alter G., Charles R. C., Dighe A., Branda J. A., Lennerz J. K., Lingwood D., Schmidt A. G., Iafrate A. J., Balazs A. B., Cell 2021, 184, 476–488. [DOI] [PMC free article] [PubMed] [Google Scholar]
- 2.
- 2a. Gilboa T., Cohen L., Cheng C. A., Lazarovits R., Uwamanzu-Nna A., Han I., K. Griswold, Jr. , Barry N., Thompson D. B., Kohman R. E., Woolley A. E., Karlson E. W., Walt D. R., Angew. Chem. Int. Ed. 2021, 60, 25966–25972; [DOI] [PMC free article] [PubMed] [Google Scholar]; Angew. Chem. 2021, 133, 26170–26176; [Google Scholar]
- 2b. Liu F., Li L., Xu M., Wu J., Luo D., Zhu Y., Li B., Song X., Zhou X., J. Clin. Virol. 2020, 127, 104370. [DOI] [PMC free article] [PubMed] [Google Scholar]
- 3.
- 3a. Muecksch F., Wise H., Batchelor B., Squires M., Semple E., Richardson C., McGuire J., Clearly S., Furrie E., Greig N., Hay G., Templeton K., Lorenzi J. C. C., Hatziioannou T., Jenks S., Bieniasz P. D., J. Infect. Dis. 2021, 223, 389–398; [DOI] [PMC free article] [PubMed] [Google Scholar]
- 3b. de Assis R. R., Jain A., Nakajima R., Jasinskas A., Felgner J., Obiero J. M., Norris P. J., Stone M., Simmons G., Bagri A., Irsch J., Schreiber M., Buser A., Holbro A., Battegay M., Hosimer P., Noesen C., Adenaiye O., Tai S., Hong F., Milton D. K., Davies D. H., Contestable P., Corash L. M., Busch M. P., Felgner P. L., Khan S., Nat. Commun. 2021, 12, 6. [DOI] [PMC free article] [PubMed] [Google Scholar]
- 4.
- 4a. Ismagilov R. F., Angew. Chem. Int. Ed. 2003, 42, 4130–4132; [DOI] [PubMed] [Google Scholar]; Angew. Chem. 2003, 115, 4262–4264; [Google Scholar]
- 4b. Burns M. A., Science 2002, 296, 1818–1819; [DOI] [PubMed] [Google Scholar]
- 4c. Meldrum D. R., Holl M. R., Science 2002, 297, 1197–1198; [DOI] [PubMed] [Google Scholar]
- 4d. Liu H., Li Z., Shen R., Li Z., Yang Y., Yuan Q., Nano Lett. 2021, 21, 2854–2860; [DOI] [PubMed] [Google Scholar]
- 4e. Gao Y., Huo W., Zhang L., Lian J., Tao W., Song C., Tang J., Shi S., Gao Y., Biosens. Bioelectron. 2019, 123, 204–210; [DOI] [PubMed] [Google Scholar]
- 4f. Wang J., Jiang Z., Wei Y., Wang W., Wang F., Yang Y., Song H., Yuan Q., ACS Nano 2022, 16, 3300–3310. [DOI] [PubMed] [Google Scholar]
- 5.
- 5a. Murphy B. M., He X., Dandy D., Henry C. S., Anal. Chem. 2008, 80, 444–450; [DOI] [PMC free article] [PubMed] [Google Scholar]
- 5b. Heggestad J. T., Kinnamon D. S., Olson L. B., Liu J., Kelly G., Wall S. A., Oshabaheebwa S., Quinn Z., Fontes C. M., Joh D. Y., Hucknall A. M., Pieper C., Anderson J. G., Naqvi I. A., Chen L., Que L. G., T. Oguin III , Nair S. K., Sullenger B. A., Woods C. W., Burke T. W., Sempowski G. D., Kraft B. D., Chilkoti A., Sci. Adv. 2021, 7, eabg4901. [DOI] [PMC free article] [PubMed] [Google Scholar]
- 6. Juncker D., Bergeron S., Laforte V., Li H., Curr. Opin. Chem. Biol. 2014, 18, 29–37. [DOI] [PubMed] [Google Scholar]
- 7.
- 7a. Kingsmore S. F., Nat. Rev. Drug Discovery 2006, 5, 310–320; [DOI] [PMC free article] [PubMed] [Google Scholar]
- 7b. Fan R., Vermesh O., Srivastava A., Yen B. K., Qin L., Ahmad H., Kwong G. A., Liu C. C., Gould J., Hood L., Heath J. R., Nat. Biotechnol. 2008, 26, 1373–1378. [DOI] [PMC free article] [PubMed] [Google Scholar]
- 8.
- 8a. Ravi N., Cortade D. L., Ng E., Wang S. X., Biosens. Bioelectron. 2020, 165, 112454; [DOI] [PMC free article] [PubMed] [Google Scholar]
- 8b. Atyeo C., Fischinger S., Zohar T., Slein M. D., Burke J., Loos C., McCulloch D. J., Newman K. L., Wolf C., Yu J., Shuey K., Feldman J., Hauser B. M., Caradonna T., Schmidt A. G., Suscovich T. J., Linde C., Cai Y., Barouch D., Ryan E. T., Charles R. C., Lauffenburger D., Chu H., Alter G., Immunity 2020, 53, 524–532.e4. [DOI] [PMC free article] [PubMed] [Google Scholar]
- 9. Lu R., Zhao X., Li J., Niu P., Yang B., Wu H., Wang W., Song H., Huang B., Zhu N., Bi Y., Ma X., Zhan F., Wang L., Hu T., Zhou H., Hu Z., Zhou W., Zhao L., Chen J., Meng Y., Wang J., Lin Y., Yuan J., Xie Z., Ma J., Liu W. J., Wang D., Xu W., Holmes E. C., Gao G. F., Wu G., Chen W., Shi W., Tan W., Lancet 2020, 395, 565–574. [DOI] [PMC free article] [PubMed] [Google Scholar]
- 10. Wang G., Zhang P., Dou H., Li W., Sun K., He X., Han J., Xiao H., Li Y., Langmuir 2012, 28, 6141–6150. [DOI] [PubMed] [Google Scholar]
- 11. Mayuri P. V., Bhatt A., Sabaweeswaran A., Ramesh P., J. Biomater. Sci. Polym. Ed. 2021, 32, 595–612. [DOI] [PubMed] [Google Scholar]
- 12.
- 12a. Huang C., Wang Y., Li X., Ren L., Zhao J., Hu Y., Zhang L., Fan G., Xu J., Gu X., Cheng Z., Yu T., Xia J., Wei Y., Wu W., Xie X., Yin W., Li H., Liu M., Xiao Y., Gao H., Guo L., Xie J., Wang G., Jiang R., Gao Z., Jin Q., Wang J., Cao B., Lancet 2020, 395, 497–506; [DOI] [PMC free article] [PubMed] [Google Scholar]
- 12b. Ponti G., Maccaferri M., Ruini C., Tomasi A., Ozben T., Crit. Rev. Clin. Lab. Sci. 2020, 57, 389–399. [DOI] [PMC free article] [PubMed] [Google Scholar]
- 13.
- 13a. Xianyu Y., Wu J., Chen Y., Zheng W., Xie M., Jiang X., Angew. Chem. Int. Ed. 2018, 57, 7503–7507; [DOI] [PubMed] [Google Scholar]; Angew. Chem. 2018, 130, 7625–7629; [Google Scholar]
- 13b. Ran B., Zheng W., Dong M., Xianyu Y., Chen Y., Wu J., Qian Z., Jiang X., Anal. Chem. 2018, 90, 8234–8240. [DOI] [PubMed] [Google Scholar]
Associated Data
This section collects any data citations, data availability statements, or supplementary materials included in this article.
Supplementary Materials
As a service to our authors and readers, this journal provides supporting information supplied by the authors. Such materials are peer reviewed and may be re‐organized for online delivery, but are not copy‐edited or typeset. Technical support issues arising from supporting information (other than missing files) should be addressed to the authors.
Supporting Information
Supporting Information
Data Availability Statement
Research data are not shared.


