

Abstract
Background and purpose
The patterns of long‐term risk of SARS‐CoV‐2 infection, hospitalization for COVID‐19, and related death are uncertain in people with Parkinson disease (PD) or parkinsonism (PS). The aim of the study was to quantify these risks compared to a control population cohort, during the period March 2020–May 2021, in Bologna, Northern Italy.
Methods
ParkLink Bologna cohort (759 PD, 192 PS) and controls (9226) anonymously matched (ratio = 1:10) for sex, age, district, and comorbidity were included. Data were analysed in the whole period and in the two different pandemic waves (March–May 2020 and October 2020–May 2021).
Results
Adjusted hazard ratio of SARS‐CoV‐2 infection was 1.3 (95% confidence interval [CI] = 1.04–1.7) in PD and 1.9 (95% CI = 1.3–2.8) in PS compared to the controls. The trend was detected in both the pandemic waves. Adjusted hazard ratio of hospitalization for COVID‐19 was 1.1 (95% CI = 0.8–1.7) in PD and 1.8 (95% CI = 0.97–3.1) in PS. A higher risk of hospital admission was detected in PS only in the first wave. The 30‐day mortality risk after hospitalization was higher (p = 0.048) in PS (58%) than in PD (19%) and controls (26%).
Conclusions
Compared with controls, after adjustment for key covariates, people with PD and PS showed a higher risk of SARS‐CoV‐2 infection throughout the first 15 months of the pandemic. COVID‐19 hospitalization risk was increased only in people with PS and only during the first wave. This group of patients was burdened by a very high risk of death after infection and hospitalization.
Keywords: cohort studies, COVID‐19, frail elderly, Parkinson disease, parkinsonism
Compared with controls, people with Parkinson disease and parkinsonism showed a higher risk of SARS‐CoV‐2 infection throughout the first 15 months of the pandemic. COVID‐19 hospitalization risk was increased only in people with parkinsonism and only during the first wave. This group of patients was burdened by a very high risk of death after infection and hospitalization.
INTRODUCTION
The COVID‐19 pandemic has been globally striking most countries since early 2020 [1]. Italy has been among the five most affected countries in Europe, with approximately 4,300,000 cases of SARS‐CoV‐2 infection and approximately 127,000 deceased patients by the end of June 2021. The Emilia‐Romagna region, Northern Italy, similarly to the rest of the country, was hit by two main waves (from March to May 2020, and from October 2020 to May 2021). In the province of Bologna, the regional capital city, 5021 cases and 590 deaths with COVID‐19 were recorded by the end of May 2020, and 93,378 cases with 2619 deaths by the end of June 2021.
Whether patients with Parkinson disease (PD) are at higher risk of SARS‐CoV‐2 infection is still not well established [2]. In hospitalized subjects, after COVID‐19 infection, the presence of a neurodegenerative disease increases the risk of an unfavourable short‐term outcome [3, 4]. People with PD often show a significant clinical worsening [5, 6] however, controversial data are reported about the risk of hospitalization [5, 7] or death [6, 7, 8, 9, 10]. These discrepancies are probably due to methodological issues (different study design, source of data, definitions, etc.) and differences in contextual factors (population at risk, pandemic wave, health care system response measures). By means of a population‐based historical cohort study [11], we found that, during the first pandemic wave, patients with PD did not have a different risk for COVID‐19 hospitalization than a matched control population. Conversely, being affected by parkinsonism (PS) showed a threefold risk.
The present study was aimed to assess (i) the risk of SARS‐CoV‐2 infection (detected by real time polymerase chain reaction [PCR] test), (ii) the risk of hospital admission for COVID‐19, and (iii) the 30‐day mortality risk after a positive SARS‐CoV‐2 test or hospitalization, in a population‐based cohort of people with PD or PS (ParkLink Bologna cohort [11]) compared to a matched population cohort. The period of observation was 15 months from the pandemic onset. Stratified analyses of the two main pandemic waves (March–May 2020, October 2020–May 2021) were also performed.
METHODS
The STROBE (Strengthening the Reporting of Observational Studies in Epidemiology) [12] and the RECORD (The REporting of studies Conducted using Observational Routinely‐collected health Data) guidelines [13] were followed.
Study design
A historical cohort design was applied.
Setting and study population
On 31 December 2019, the local health trust (LHT) of Bologna, Northern Italy, had a population of 752,104 adults. At the beginning of the pandemic, the area included nine general hospitals, three academic hospitals, and 11 private clinics operating within the Italian National Health Service, for a total of approximately 4400 beds, of which approximately 120 were in intensive care. In response to the first wave, hospital facilities underwent major reorganization; since mid‐March 2020, eight COVID‐19 hospitals/wards have been created, with a total of approximately 400 beds for symptomatic patients and approximately 150 intensive care unit beds. Dedicated diagnostic protocols for suspected COVID‐19 patients to be applied at every emergency department (ED) access were implemented. Dedicated COVID‐19 wards were progressively dismantled during June–September 2020 but, since October 2020, at the start of the second wave, new organizational measures were put in place in response to infection and hospitalization rates, and trends have been continuously monitored.
SARS‐CoV‐2 testing strategies varied over the study period, as new evidence on virus transmission emerged and as organizational difficulties and laboratory shortage problems were solved. During the first wave, access to testing was limited and targeted mainly subjects with COVID‐19‐related symptoms and subjects at the end of quarantine of case contacts. Gradually, the use of tests became more widespread, and it was extended also for screening purpose among some work categories (e.g., health care and school workers). As of October 2020, tests have been available not only in public health structures but also in private facilities. Throughout the study period, only real time PCR‐based tests of nasopharyngeal and/or oropharyngeal swabs were used for case confirmation.
This study is based on the ParkLink Bologna project (https://ambo.ausl.bologna.it/metro/som/istituto‐scienze‐neurologiche‐bologna/ricerca/i‐progetti/parklink‐bologna), an ongoing record linkage system started in 2015, including consecutive prevalent and incident cases of PD or PS, living in the area of the LHT of Bologna. For the purpose of the present study, we included people with PD or PS and people anonymously matched from the general population (control cohort), alive on 1 March 2020. The data cutoff for ParkLink Bologna recruitment was 30 September 2020. Thirty neurologists operating in the area, including three hospital‐based movement disorders outpatient services and several public and private outpatient services, voluntarily joined the project. Diagnosis of PD or PS is defined prospectively by the recruiting neurologist during usual clinical practice. Neurologists applied Gelb diagnostic criteria [14] for PD and other international criteria for prespecified types of PS [15, 16, 17]. The latter and other rare neurological causes affecting basal ganglia or unspecified PS are recorded in the system and labeled as PS altogether. Training on the application of more recent international diagnostic criteria is ongoing [18, 19]. People with drug‐induced PS were excluded. The following data were recorded in an electronic case report form, linked to other administrative databases: unique anonymous identification code, date of birth, diagnosis, year of onset, motor symptoms at onset (tremor or bradykinesia), side of onset (unilateral or bilateral), and Hoehn and Yahr score. For all clinical data, the coverage was 100%, except for motor symptoms at onset (tremor/bradykinesia), which had 14% missing data.
The control cohort included a random sample of anonymous people matched with the ParkLink cohort (ratio = 1:10) for age, sex, district of residence, and comorbidity according to Charlson Comorbidity Index. Subjects who used drugs for PD (levodopa, dopaminergic agents, monoamine oxidase‐B inhibitors) for at least 180 consecutive days during 2019 were considered to be affected by PD or PS and excluded.
Data sources
As the Italian health system is universal, any access to public or private health facilities is routinely recorded, and data are stored by the Bologna LHT, therefore the coverage of health care provision is 100%. The Institute of Neurological Sciences of Bologna is in charge of the ParkLink Bologna project and has access to several health databases (outpatient tests and visits, ED admissions, hospital discharge, drug prescription, mortality). The Charlson Comorbidity Index was calculated according to the adapted method for International Classification of Diseases, Ninth Revision, Clinical Modification (ICD‐9‐CM) [20]. Information about SARS‐CoV‐2 infection cases were retrieved from the Infectious Disease Surveillance database, a regional electronic archive of laboratory‐confirmed cases, regularly updated by the Public Health Department of the LHT. Hospital admissions for COVID‐19 were captured using an algorithm of the Emilia‐Romagna region based on the ICD‐9‐CM codes (28 October 2020, document available upon request).
Outcomes
From 1 March 2020 to 31 May 2021, the following outcomes were investigated: (i) SARS‐CoV‐2 infection rate, (ii) hospital admission rate for COVID‐19, and (iii) overall 30‐day mortality risk calculated in the group of people with a positive swab and in the group of hospitalized people.
Statistical analysis
In the descriptive analysis, the characteristics of the cohorts are presented as mean and SD or median and interquartile range (IQR) for the continuous variables and with absolute (n) and relative (%) frequency for categorical variables. Chi‐squared test, followed by post hoc Bonferroni correction, and Kruskal–Wallis test, followed by post hoc Dunn test, were used to evaluate the univariate association between conditions (PD/PS/controls) and categorical or continuous variables, respectively. SARS‐CoV‐2 infection rate and hospital admission rate for COVID‐19 were calculated using 1 March 2020 as time at entry, and the date of positive swab/hospital admission or 31 May 2021 as time at endpoint. Additionally, separate subanalyses were performed for first and second waves (March–May 2020 and October 2020–May 2021). We calculated the infection rate and hospital admission rate, for each period and for each cohort, using the following equation: rate = cases in the period/person‐years at risk in the period × 100 (constant). These rates represent the absolute risk of infection and hospital admission in time.
We used univariate and multivariate Cox regression models to estimate the hazard ratio (HR) with 95% confidence interval (CI) associating SARS‐CoV‐2 positivity or COVID‐19 hospitalization to the presence of PD/PS. Results of the univariate analysis are presented as Kaplan–Meier curves. In the multivariate models, we included sex, age, Charlson Comorbidity Index, and district of residence as covariates. The proportional hazards assumption was tested (p > 0.05) using Schoenfeld residuals.
For the calculation of the risk of hospital admission for COVID‐19 after SARS‐CoV‐2 infection, the time to entry was the date of a positive swab. For the calculation of the overall 30‐day mortality risk, the time to entry was the date of a positive swab or hospital admission. Multivariate logistic regression models, adjusted for confounding variables, were used to evaluate the 30‐day mortality risk and the hospital admission risk after a positive swab. These analyses were carried out only for the entire study period.
Data linkage and statistical analyses were conducted using Stata SE version 14.2 [21].
RESULTS
The ParkLink cohort included 758 subjects with PD (mean age = 74.8 years) and 192 with PS (mean age = 80.4 years), followed up for 881 and 204 person‐years, respectively. The control cohort included 9,222 subjects (75.8 years, 10,981 person‐years), after the exclusion of 27 subjects on treatment with drugs for PD. Demographic and clinical characteristics data are summarized by groups in Table 1. People with PS were older, with higher Hoehn and Yahr scale score and with more frequent comorbidities than people with PD (Table 1, Table 2, Table S1).
TABLE 1.
Demographic and clinical features of the control cohort and ParkLink cohort (including subjects with Parkinson disease and Parkinsonism) on 1 March 2020
| Demographic | Control cohort | Parkinson disease | Parkinsonism | p |
|---|---|---|---|---|
| n | 9222 | 758 | 192 | – |
| Mean age, years (SD, range) | 75.8 (9.4, 40–97) | 74.8 (9.5, 40–95) | 80.4 (6.9, 55–97) | <0.001 a |
| Age distribution, n (%) | <0.001 a | |||
| 40–49 years | 140 (1.5) | 14 (1.8) | 0 (0) | |
| 50–59 years | 429 (4.7) | 42 (5.5) | 1 (0.5) | |
| 60–69 years | 1487 (16.1) | 140 (18.5) | 13 (6.8) | |
| 70–79 years | 3554 (38.5) | 303 (40.0) | 62 (32.3) | |
| 80–89 years | 3320 (36.0) | 244 (32.2) | 100 (52.1) | |
| ≥90 years | 292 (3.2) | 15 (2.0) | 16 (8.3) | |
| Sex, n (%) | 0.836 | |||
| Male | 5341 (57.9) | 446 (58.8) | 109 (56.8) | |
| Female | 3881 (42.1) | 312 (41.2) | 83 (43.2) | |
| District, n (%) | 0.678 | |||
| Bologna | 4129 (44.8) | 335 (44.2) | 87 (45.3) | |
| Reno | 1098 (11.9) | 93 (12.3) | 20 (10.4) | |
| Pianura Est | 1657 (18.0) | 131 (17.3) | 42 (21.9) | |
| Pianura Ovest | 1022 (11.1) | 86 (11.4) | 21 (11.0) | |
| Appennino | 640 (6.9) | 59 (7.8) | 6 (3.1) | |
| San Lazzaro | 676 (7.3) | 54 (7.1) | 16 (8.3) | |
| Charlson Comorbidity Index, n (%) | <0.001 a | |||
| 0 | 7310 (79.3) | 618 (81.6) | 125 (65.1) | |
| 1 | 930 (10.1) | 66 (8.7) | 30 (15.6) | |
| 2 | 696 (7.5) | 51 (6.7) | 22 (11.5) | |
| ≥3 | 286 (3.1) | 23 (3.0) | 15 (7.8) | |
| Comorbidities, n (%) | ||||
| Myocardial infarction | 178 (1.9) | 12 (1.6) | 3 (1.6) | 0.752 |
| Congestive heart failure | 453 (4.9) | 40 (5.3) | 20 (10.4) | 0.002 a |
| Peripheral vascular disease | 127 (1.4) | 5 (0.7) | 1 (0.5) | 0.155 |
| Cerebrovascular disease | 392 (4.3) | 18 (2.4) | 21 (10.9) | <0.001 a |
| Dementia | 158 (1.7) | 30 (4.0) | 22 (11.5) | <0.001 a |
| Chronic pulmonary disease | 263 (2.9) | 11 (1.5) | 10 (5.2) | 0.010 a |
| Peptic ulcer disease | 27 (0.3) | 3 (0.4) | 2 (1.0) | 0.171 |
| Liver disease | 33 (0.4) | 1 (0.1) | 0 (0.0) | 0.421 |
| Diabetes | 320 (3.5) | 22 (2.9) | 17 (8.9) | <0.001 a |
| Renal disease | 141 (1.5) | 14 (1.9) | 5 (2.6) | 0.406 |
| Any malignancy | 498 (5.4) | 37 (4.9) | 8 (4.2) | 0.636 |
Statistically significant.
TABLE 2.
Specific clinical features of the ParkLink cohort subgroups Parkinson disease and Parkinsonism) on 1 March 2020
| Demographic | Parkinson disease | Parkinsonism | p |
|---|---|---|---|
| n | 758 | 192 | |
| Clinical features at onset, n (%) | |||
| Unilateral | 623 (82.2) | 71 (37.0) | <0.001 a |
| Bilateral | 135 (17.8) | 121 (63.0) | |
| Tremor [yes] | 483 (63.7) | 77 (40.1) | <0.001 a |
| Bradykinesia [yes] | 525 (69.3) | 156 (81.3) | 0.004 a |
| Probability level of PD, n (%) | |||
| Possible | 242 (32.0) | ||
| Probable | 516 (68.0) | ||
| Etiology in parkinsonism, n (%) | |||
| Vascular parkinsonism | 99 (51.6) | ||
| Progressive supranuclear palsy | 16 (8.3) | ||
| Multiple system atrophy | 10 (5.2) | ||
| Other/undetermined | 67 (34.9) | ||
| Hoehn and Yahr scale at latest observation | |||
| Median (IQR) | 2.5 (2–3) | 3 (2.5–4) | <0.001 a |
| Score 4–5, n (%) | 132 (17.4) | 73 (38.0) | <0.001 a |
| Therapy, n (%) | |||
| No therapy | 87 (11.5) | 44 (22.9) | <0.001 a |
| Levodopa only | 456 (60.2) | 117 (60.8) | |
| Dopaminergic or inhibitors of MAO‐B only | 23 (3.0) | 3 (1.6) | |
| Any combination of drugs | 192 (25.3) | 28 (14.7) | |
Abbreviations: IQR, interquartile range; MAO‐B, monoamine oxidase type B.
Statistically significant.
Risk of SARS‐CoV‐2 infection
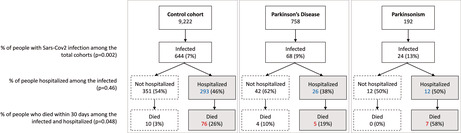
The overall number of people infected was 736: 68 among PD subjects (38 males), 24 among PS subjects (14 males), and 644 in the control cohort (380 males; Figure 1). The infection rate in the total period was 7.7 per 100 person‐years in PD, 11.8 in PS, and 5.9 in controls. Kaplan–Meier curves showed a progressive higher risk of infection for PD and PS groups compared to the control group during the overall time frame (Figure 2a). The crude HR of infection was 1.3 (95% CI = 1.03–1.7, p = 0.027) for PD and 2.1 (95% CI = 1.4–3.1, p < 0.001) for PS compared to the control cohort. Univariate analysis found the following factors associated with infection (Table 3): age, Charlson Comorbidity Index, district of residence, congestive heart failure, cerebrovascular disease, dementia, chronic pulmonary disease, diabetes, and renal disease. After adjustment (Table 3), HR of infection was 1.3 (95% CI = 1.04–1.7, p = 0.020) in PD and 1.9 (95% CI = 1.3–2.8, p = 0.002) in PS compared to the control cohort. Considering only the ParkLink cohort, the Hoehn and Yahr scale score was associated with infection (HR = 1.3, 95% CI = 1.1–1.6, p = 0.003).
FIGURE 1.
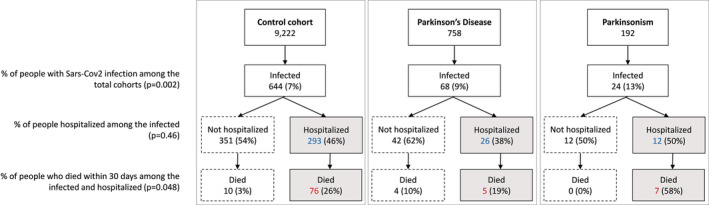
Flow chart reporting the occurrence of the three outcomes (SARS‐CoV‐2 infection, COVID‐19 hospitalization, 30‐day death) in the control cohort and ParkLink cohort (subdivided as people with Parkinson disease and parkinsonism), during the whole period of observation (1 March 2020 to 31 May 2021). The null hypothesis of the p‐values is the equality of percentage between the three groups
FIGURE 2.
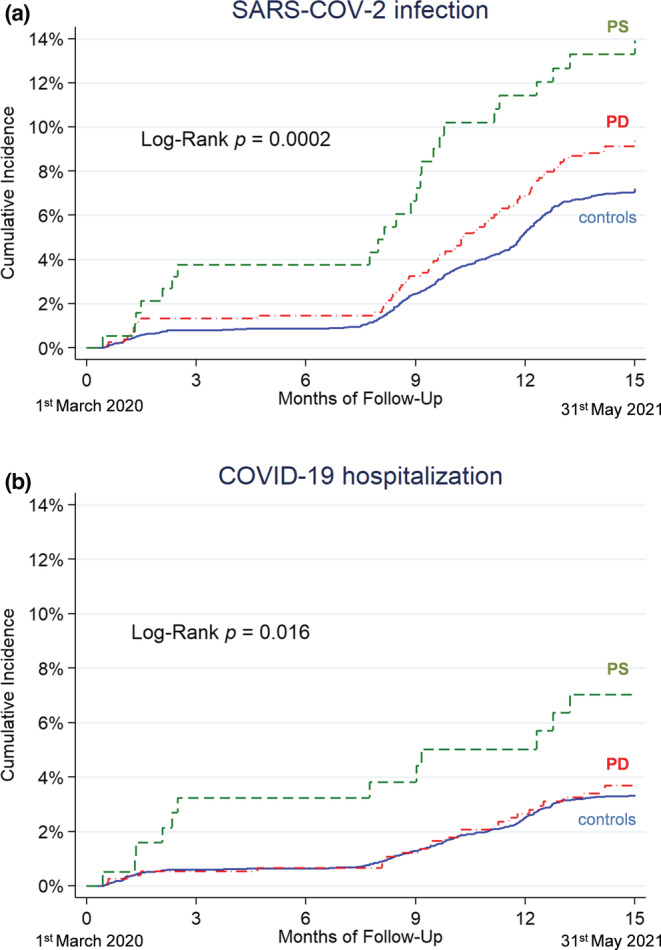
Kaplan–Meier curves reporting the SARS‐CoV‐2 infection rate (a) and COVID‐19 hospitalization rate (b) in the group of people with Parkinson disease (PD; red dashed‐dotted line), people with parkinsonism (PS; green dashed line), and the control cohort (blue solid line), during the whole period of observation (1 March 2020 to 31 May 2021)
TABLE 3.
Risk of Sars‐Cov2 infection in the three cohorts (n = 10,172: control, 9222; Parkinson disease, 758; parkinsonism, 192): Univariate and multivariate Cox regression models
| Demographic | Sars‐Cov2 infection, n | HR (95% CI) | p | Adjusted HR (95% CI) | p |
|---|---|---|---|---|---|
| Control | 644 | Ref. | Ref. | ||
| Parkinson disease | 68 | 1.3 (1.03–1.7) | 0.027 a | 1.3 (1.04–1.7) | 0.020 a |
| Parkinsonism | 24 | 2.1 (1.4–3.1) | <0.001 a | 1.9 (1.3–2.8) | 0.002 a |
| Age, years, mean = 76.3, SD = 9.6 | – | 1.01 (1.001–1.02) | 0.027 a | 1.01 (0.99–1.6) | 0.143 |
| Sex, n (%) | |||||
| Male | 432 (7.3) | Ref. | Ref. | ||
| Female | 304 (7.1) | 0.96 (0.8–1.1) | 0.583 | 0.98 (0.9–1.1) | 0.795 |
| District, n (%) | |||||
| Bologna | 353 (7.8) | Ref. | Ref. | ||
| Reno | 88 (7.3) | 0.9 (0.7–1.2) | 0.578 | 1.0 (0.8–1.2) | 0.680 |
| Pianura Est | 104 (5.7) | 0.7 (0.6–0.9) | 0.004 a | 0.7 (0.6–0.9) | 0.007 a |
| Pianura Ovest | 80 (7.1) | 0.9 (0.7–1.2) | 0.499 | 0.9 (0.7–1.2) | 0.595 |
| Appennino | 53 (7.5) | 0.9 (0.7–1.3) | 0.847 | 1.0 (0.8–1.4) | 0.898 |
| San Lazzaro | 58 (7.8) | 0.9 (0.8–1.3) | 0.970 | 1.0 (0.8–1.4) | 0.750 |
| Charlson Comorbidity Index, n (%) | |||||
| 0 | 530 (6.6) | Ref. | Ref. | ||
| 1 | 85 (8.3) | 1.3 (1.1–1.7) | 0.017 a | 1.3 (0.99–1.6) | 0.059 |
| 2 | 76 (9.9) | 1.7 (1.3–2.1) | <0.001 a | 1.6 (1.3–2.0) | <0.001 a |
| ≥3 | 45 (13.9) | 2.4 (1.8–3.3) | <0.001 a | 2.3 (1.7–3.2) | <0.001 a |
| Comorbidities, n (%) | |||||
| Myocardial infarction | 7 (3.6) | 1.1 (0.7–1.8) | 0.756 | ||
| Congestive heart failure | 34 (6.6) | 2.1 (1.6–2.7) | <0.001 a | ||
| Peripheral vascular disease |
2 (1.5) |
0.6 (0.3–1.4) | 0.252 | ||
| Cerebrovascular disease | 24 (5.6) | 1.5 (1.1–2.0) | 0.014 a | ||
| Dementia | 25 (11.9) | 3.9 (2.8–5.2) | <0.001 a | ||
| Chronic pulmonary disease | 23 (8.1) | 1.7 (1.2–2.4) | 0.003 a | ||
| Peptic ulcer disease | 3 (9.4) | 1.3 (0.4–4.0) | 0.678 | ||
| Liver disease | 2 (5.9) | 1.4 (0.5–4.5) | 0.527 | ||
| Diabetes | 26 (7.2) | 1.9 (1.4–2.5) | <0.001 a | ||
| Renal disease | 12 (7.5) | 2.5 (1.7–3.7) | <0.001 a | ||
| Any malignancy | 18 (3.3) | 0.9 (0.6–1.3) | 0.527 |
Abbreviations: CI, confidence interval; HR, hazard ratio; Ref., reference.
Statistically significant.
During the first pandemic wave, the number of people included in the analysis was 10,172 (758 PD, 192 PS, 9222 controls). The number with a positive swab was 89 (10 PD, 7 PS, 72 controls). The Kaplan–Meier curves showed a higher risk of infection in PS compared to the control group (Figure 3a). The infection rate in the first wave was 5.4 per 100 person‐years in PD, 15.3 in PS, and 3.2 in controls. The adjusted HR of infection was 1.8 (95% CI = 0.94–3.5, p = 0.078) for PD and 3.6 (95% CI = 1.6–7.9, p = 0.001) for PS compared to the control cohort.
FIGURE 3.
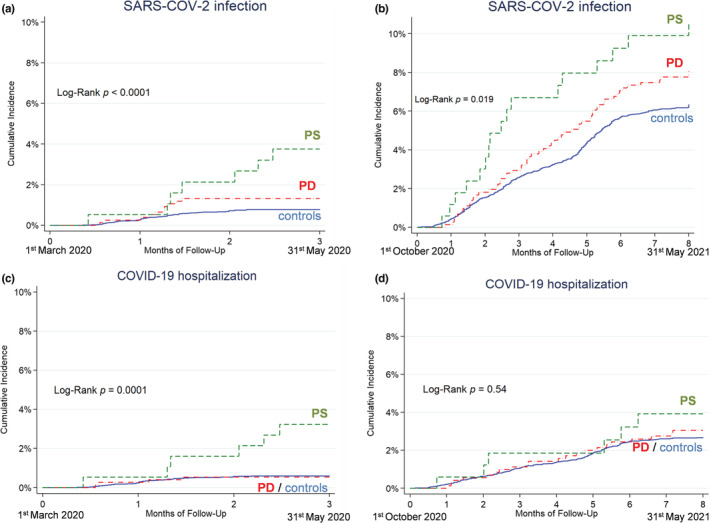
Kaplan–Meier curves reporting the SARS‐CoV‐2 infection rate (a, b) and COVID‐19 hospitalization rate (c, d) in the group of people with Parkinson disease (PD; red dashed‐dotted line), people with parkinsonism (PS; green dashed line), and the control cohort (blue solid line), during the first wave (1 March 2020 to 31 May 2020; a, c) and the second wave (1 October 2020 to 31 May 2021; b, d)
In the second pandemic wave, the number of people included in the analysis was 9830 (719 PD, 170 PS, and 8941 controls). The number with a positive swab was 634 (57 PD, 17 PS, 560 controls). The Kaplan–Meier curves show a higher risk of infection in PS compared to the control group (Figure 3b). The infection rate was 12.6 per 100 person‐years in PD, 17.0 in PS, and 9.8 in controls. The adjusted HR of infection was 1.3 (95% CI = 0.99–1.7, p = 0.064) for PD and 1.6 (95% CI = 0.99–2.6, p = 0.054) for PS compared to the control cohort.
Risk of hospital admission for COVID‐19
Hospital admissions for COVID‐19 totaled 331: 26 among subjects with PD (19 males), 12 among subjects with PS (9 males), and 293 in the control cohort (193 males). The hospital admission rate in the whole period was 3.0 per 100 person‐years in PD, 5.9 in PS, and 2.7 in controls. Kaplan–Meier curves show a progressively higher risk of hospitalization for PS compared to the PD group and the control group (Figure 2b). The crude HR compared to the control cohort was 1.1 (95% CI = 0.7–1.7, p = 0.607) for PD and 2.3 (95% CI = 1.3–4.0, p = 0.006) for PS. Univariate analysis found the following factors to be associated with hospital admission (Table 4): age, sex, Charlson Comorbidity Index, congestive heart failure, cerebrovascular disease, dementia, chronic pulmonary disease, diabetes, and renal disease. After adjustment (Table 4), HR was 1.1 (95% CI = 0.8–1.7, p = 0.497) in PD and 1.8 (95% CI = 0.97–3.1, p = 0.059) in PS. Considering only the ParkLink cohort, the Hoehn and Yahr scale score was not associated with hospital admission (HR = 1.2, 95% CI = 0.9–1.6, p = 0.145).
TABLE 4.
Risk of hospital admission for COVID‐19 in the three cohorts (n = 10,172: control, 9222; Parkinson disease, 758; parkinsonism, 192): Univariate and multivariate Cox regression models
| Demographic | Hospital admission for COVID‐19, n | HR (95% CI) | p | Adjusted HR (95% CI) | p |
|---|---|---|---|---|---|
| Control | 293 | Ref. |
Ref. |
||
| Parkinson disease | 26 | 1 (0.7–1.7) | 0.607 | 1.1 (0.8–1.7) | 0.497 |
| Parkinsonism | 12 | 2.3 (1.3–4.0) | 0.006 a | 1.8 (0.97–3.1) | 0.059 |
| Age, years, mean = 77.8, SD = 8.5 | – | 1.03 (1.02–1.04) | <0.001 a | 1.03 (1.01–1.04) | <0.001 a |
| Sex, n (%) | |||||
| Male | 221 (3.8) | Ref. | Ref. | ||
| Female | 110 (2.6) | 0.7 (0.5–0.9) | 0.001 a | 0.7 (0.5–0.9) | 0.002 a |
| District, n (%) | |||||
| Bologna | 150 (3.3) | Ref. | Ref. | ||
| Reno | 43 (3.6) | 1.1 (0.8–1.5) | 0.672 | 1.1 (0.8–1.5) | 0.726 |
| Pianura Est | 61 (3.3) | 1.0 (0.7–1.4) | 0.985 | 1.0 (0.8–1.4) | 0.814 |
| Pianura Ovest | 30 (2.7) | 0.8 (0.5–1.2) | 0.296 | 0.8 (0.5–1.2) | 0.281 |
| Appennino | 20 (2.8) | 0.9 (0.5–1.4) | 0.535 | 0.9 (0.6–1.4) | 0.655 |
| San Lazzaro | 27 (3.6) | 1.1 (0.7–1.6) | 0.680 | 1.2 (0.8–1.8) | 0.443 |
| Charlson Comorbidity Index, n (%) | |||||
| 0 | 215 (2.7) | Ref. | Ref. | ||
| 1 | 47 (4.6) | 1.8 (1.3–2.5) | <0.001 a | 1.6 (1.2–2.2) | 0.004 a |
| 2 | 44 (5.7) | 2.3 (1.7–3.2) | <0.001 a |
2.1 (1.5–2.9) |
<0.001 a |
| ≥3 | 25 (7.7) | 3.3 (2.2–5.0) | <0.001 a | 2.9 (1.9–4.3) | <0.001 a |
| Comorbidities, n (%) | |||||
| Myocardial infarction | 7 (3.6) | 1.1 (0.5–2.4) | 0.758 | ||
| Congestive heart failure | 34 (6.6) | 2.4 (1.7–3.4) | <0.001 a | ||
| Peripheral vascular disease |
2 (1.5) |
0.5 (0.1–1.9) | 0.277 | ||
| Cerebrovascular disease | 24 (5.6) | 1.9 (1.3–2.9) | 0.003 a | ||
| Dementia | 25 (11.9) | 4.9 (3.2–7.3) | <0.001 a | ||
| Chronic pulmonary disease | 23 (8.1) | 2.7 (1.8–4.2) | <0.001 a | ||
| Peptic ulcer disease | 3 (9.4) | 2.8 (0.9–8.9) | 0.071 | ||
| Liver disease | 2 (5.9) | 2.1 (0.5–8.5) | 0.288 | ||
| Diabetes | 26 (7.2) | 2.5 (1.7–3.7) | <0.001 a | ||
| Renal disease | 12 (7.5) | 2.6 (1.5–4.7) | 0.001 a | ||
| Any malignancy | 18 (3.1) | 1.1 (0.7–1.7) | 0.727 |
Abbreviations: CI, confidence interval; HR, hazard ratio; Ref., reference.
Statistically significant.
In the first pandemic wave, the number of people hospitalized was 66 (4 PD, 6 PS, 56 control cohort). The Kaplan–Meier curves show a higher risk of PS compared to the control group (Figure 3c). The hospitalization rate was 2.1 per 100 person‐years in PD, 13.1 in PS, and 2.5 in controls. The adjusted HR of hospitalization was 0.9 (95% CI = 0.3–2.5, p = 0.88) for PD and 3.9 (95% CI = 1.7–9.2, p = 0.002) for PS compared to the control cohort.
In the second pandemic wave, the number of people hospitalized was 258 (21 PD, 6 PS, 231 control cohort). The Kaplan–Meier curve did not show differences between the three groups (Figure 3d). The hospitalization rate was 4.7 per 100 person‐years in PD, 6.0 per 100 person‐years in PS, and 4.1 per 100 person‐years in controls. The adjusted HR of hospitalization was 1.2 (95% CI = 0.8–1.8, p = 0.47) for PD and 1.2 (0.5–2.6, p = 0.73) for PS compared to the control cohort.
Length of hospital stay
The overall median length of hospital stay was 11 days (IQR = 6–19, range = 1–109) in controls, 14 days in PD (IQR = 10–28, range = 2–55), and 9.5 days in PS (IQR = 6–17.5, range = 4–63), without statistical difference among groups (p = 0.084). Median length of hospital stay among living patients was 13 days (IQR = 7–19, range = 1–109) in controls, 16 days in PD (IQR = 10–28, range = 5–46), and 17 days in PS (IQR = 10–24, range = 10–24), without statistical difference among groups (p = 0.21).
Hospital admission for COVID‐19 after SARS‐CoV‐2 infection
The percentage of hospital admission after SARS‐CoV‐2 infection was 45% without significant differences between the three groups (p = 0.46): 38% among PD subjects, 50% among PS subjects, and 46% in the control cohort (Figure 1).
Thirty‐day mortality risk
Overall, 102 out of 736 infected subjects and 88 out of 331 hospitalized patients died within 30 days after positive swab or hospitalization (Figure 1). Among controls, 86 (13.3%) died after a median of 12 days from infection (IQR = 7–19, range = 1–30), and 76 (25.9%) after a median of 11 days from hospital admission (IQR = 5–17, range = 1–28). Among PD, nine (13.2%) died after a median of 9 days from positive swab (IQR = 2–12, range = 1–27), and five (19.2%) after a median of 11 days from hospital admission (IQR = 6–15, range = 2–27). Among PS, seven (29.2%) died after a median of 6 days from a positive swab (IQR = 6–11, range = 5–16), and seven (58.3%) after a median of 6 days from hospital admission (IQR = 6–11, range = 5–15).
Adjusted odds ratio (OR) for death after positive swab was 1.4 (95% CI = 0.6–3.0, p = 0.408) in PD and 2.3 (95% CI = 0.9–6.1, p = 0.095) in PS, compared to controls. Adjusted OR for death after hospital admission was 0.9 (95% CI = 0.3–2.8, p = 0.889) in PD and 4.8 (95% CI = 1.3–17.9, p = 0.020) in PS, compared to controls (Table 5). The seven dead people with PS had the following diagnosis: four vascular parkinsonism (all men, age range = 75–91), one progressive supranuclear palsy (80‐year‐old man), one multiple system atrophy (77‐year‐old woman), one undetermined PS (65‐year‐old man).
TABLE 5.
Risk of death within 30 days after hospital admission for COVID‐19 (n = 331: controls, 293; Parkinson disease, 26; parkinsonism, 12): Univariate and multivariate logistic regression models
| Demographic | Death, n | OR (95% CI) | p | Adjusted OR (95% CI) | p |
|---|---|---|---|---|---|
| Control | 76 | Ref. | Ref. | ||
| Parkinson disease | 5 | 0.7 (0.2–1.9) | 0.614 | 0.9 (0.3–2.8) | 0.889 |
| Parkinsonism | 7 | 4.0 (1.2–13.0) | 0.021 a | 4.8 (1.3–17.9) | 0.020 a |
| Age, years, mean = 81.4, SD = 6.2 | – | 1.09 (1.05–1.13) | <0.001 a | 1.08 (1.04–1.12) | <0.001 a |
| Sex, n (%) | |||||
| Male | 52 (23.5) | Ref. | Ref. | ||
| Female | 36 (32.7) | 1.6 (0.95–2.6) | 0.076 | 1.3 (0.8–2.3) | 0.333 |
| District, n (%) | |||||
| Bologna | 46 (30.7) | Ref. | Ref. | ||
| Reno | 10 (23.3) | 0.7 (0.3–1.5) | 0.347 | 0.7 (0.3–1.7) | 0.394 |
| Pianura Est | 15 (24.6) | 0.7 (0.4–1.5) | 0.378 | 0.8 (0.4–1.7) | 0.589 |
| Pianura Ovest | 9 (30.0) | 0.9 (0.4–2.3) | 0.942 | 1.1 (0.4–2.8) | 0.817 |
| Appennino | 6 (30.0) | 0.9 (0.4–2.7) | 0.952 | 1.2 (0.4–3.5) | 0.785 |
| San Lazzaro | 2 (7.4) | 0.2 (0.05–2.4) | 0.024 a | 0.2 (0.03–0.95) | 0.044 a |
| Charlson Comorbidity Index, n (%) | |||||
| 0 | 45 (20.9) | Ref. | Ref. | ||
| 1 | 17 (36.2) | 2.1 (1.1–4.2) | 0.028 a | 1.6 (0.8–3.4) | 0.189 |
| 2 | 15 (34.1) | 2.0 (0.97–4.0) | 0.062 | 1.7 (0.8–3.6) | 0.186 |
| ≥3 | 11 (44.0) | 3.0 (1.3–7.0) | 0.013 a | 2.6 (1.02–6.5) | 0.044 a |
| Comorbidities, n (%) | |||||
| Myocardial infarction | 2 (28.6) | 1.1 (0.2–5.8) | 0.904 | ||
| Congestive heart failure | 13 (38.2) | 1.8 (0.9–3.8) | 0.108 | ||
| Peripheral vascular disease | 1 (50.0) | 2.8 (0.2–45.0) | 0.471 | ||
| Cerebrovascular disease | 12 (50.0) | 3.0 (1.3–7.0) | 0.010 a | ||
| Dementia | 14 (56.0) | 4.0 (1.7–9.2) | 0.001 a | ||
| Chronic pulmonary disease | 7 (30.4) | 1.2 (0.5–3.1) | 0.665 | ||
| Peptic ulcer disease | 1 (33.3) | 1.4 (0.1–15.5) | 0.791 | ||
| Liver disease | 2 (100) | n.a. | – | ||
| Diabetes | 11 (42.3) | 2.2 (0.96–4.9) | 0.064 | ||
| Renal disease | 6 (50.0) | 2.9 (0.9–9.2) | 0.073 | ||
| Any malignancy | 3 (16.7) | 0.5 (0.2–1.9) | 0.334 |
Abbreviations: CI, confidence interval; HR, hazard ratio; n.a., not available; Ref., reference.
Statistically significant.
DISCUSSION
Covering the first 15‐month period of the SARS‐CoV‐2 pandemic, we observed a higher risk of SARS‐CoV‐2 infection in PD and PS (HR = 1.3 and 1.9, respectively), compared to a matched control population. The trend of a higher relative risk was detected in both pandemic waves (March–May 2020 and October 2020–May 2021). On the other hand, the higher risk of hospitalization for COVID‐19 was observed particularly during the first wave (HR = 3.9), only in people with PS, and not in the second wave. Finally, the 30‐day mortality risk was utmost in people with PS after hospitalization (58%), compared to people with PD and controls (19% and 26%, respectively). Similarly, the 30‐day mortality risk after infection was higher in PS (29%) compared to PD and controls (13% in both groups).
A systematic review with meta‐analysis of observational studies [22] reported that patients with neurological disorders in general have a doubled risk of COVID‐19 susceptibility (positive laboratory results and diagnosis in conjunction with clinical presentation), approximately 40% higher risk of hospitalization, and approximately 50% higher risk of death for COVID‐19. People with PD show a statistically nonsignificant trend of higher risk for susceptibility and hospitalization (OR = 1.89, 95% CI = 0.88–4.09, and OR = 1.37, 95% CI = 0.78–2.42, respectively), and a higher risk of death (OR = 1.50, 95% CI = 1.06–2.10), although with a very high statistical heterogeneity among the studies included, and possible publication bias [22]. Available studies show heterogeneous design (case‐controlled [23] vs. cross‐sectional [24, 25] vs. cohort [11, 26, 27, 28]), case selection (movement disorder tertiary center [23] vs. patient association [24] vs. general population [11, 26, 28] vs. hospitalized [25] vs. biobank database [27]), definition of infection (self‐reported [23, 24] vs. laboratory confirmed [11, 25, 26, 27, 28]), definition of PD (clinical [11, 23, 27, 28] vs. self‐reported [24] vs. diagnostic algorithm [25, 26]), and adjustment for confounders (not performed [23, 24, 25] vs. performed [11, 26, 27, 28]). Moreover, all but one [28] of the published studies refer only to the very first phase of pandemic in 2020.
The higher risk of SARS‐CoV‐2 infection among people with PD and PS compared to controls could be explained by some intrinsic factors (such as coexisting cognitive impairment in patients at a later stage of disease) and contextual factors (such as need of assistance in strict vicinity and nursing home residency [29, 30, 31), especially during the first wave, when protective measures were difficult to implement and Italian nursing homes registered record morbidity and COVID‐19‐related mortality [32, 33]. Moreover, biological specific factors could be hypothesized, such as immune system dysregulation in people with PD [34, 35, 36, 37]. On the other hand, the higher risk of hospitalization for COVID‐19 in people with PS, compared to people with PD and controls, could be explained by more compromised respiratory functions [38, 39] in the context of relatively more rapid disease progression [40, 41, 42, 43, 44]. Patients with PS may more frequently need procedures (tracheostomy, percutaneous endoscopic gastrostomy, urinary catheterization, or supplementary nutrition and/or rehydration) burdened by a risk for complications and hospitalization.
People with PS were prone to an impressive twofold risk of 30‐day mortality after positive swabs and almost fivefold risk after hospitalization, compared to PD patients and controls. To our knowledge, this finding—specifically for PS—has never been previously reported. Mortality risk after infection or hospital admission for COVID‐19 is affected by many factors, such as case definition, case mix of patients, geographical context, and capacity of the health care system [45]. Globally, a pooled mortality of 17.6% has been found among hospitalized patients with COVID‐19 [46], ranging from 12% to 25% in people with PD [7, 47]. These results are not far from estimates we found for PD (19%) and controls (26%) in our study.
The death risk in PS after hospitalization (58%) seems to be comparable or even higher than that reported for patients with dementia [48, 49, 50, 51, 52]. These two extremely vulnerable conditions possibly share the same risk factors for COVID‐19 disease severity and death. In addition, it has been suggested that people with advanced neurodegenerative disorders may be less likely to receive all possible intensive medicine options, considering the limited expected success [3].
In our study, we observed an increase of the general infection rate between the first and the second wave. Such difference probably reflected the different testing strategies and swab availability between the two periods, rather than a real difference in the infection rate. Conversely, we found an inverse trend of hospitalization rate between the two waves; people with PS showed a decrease (from 13.1 to 6.0 per 100 person‐years), whereas people with PD and controls had an increase (from 2.1 to 4.7 and from 2.5 to 4.1 per 100 person‐years, respectively). This could be partly explained by a selection of the PS cohort over time; as they were older, with more comorbidities, they suffered probably the greatest impact during the first wave (harvesting effect). Another reason for the smoothing of the risk in PS during the second wave could be the effective spreading of preventive infection measures in high‐risk settings (e.g., hospitals and nursing homes).
The main strength of our study is the identification of people with PD and PS by means of a clinical diagnosis performed by a neurologist according to international criteria. The sample of 758 PD patients corresponds approximately to the 30% of the total PD population in the LHT of Bologna (assuming a PD prevalence of 300 per 100,000 [53]), with plausible representation of the entire spectrum of the disease, as the settings of source are mixed (district offices, hospitals, private clinics). Moreover, we were able to analyse excess risks for both COVID‐19 pandemic waves by comparing PD/PS population with a control population, obtained from administrative data, therefore avoiding the risk of recall bias. This study also has limitations. First, residual confounding could explain the observed risk to some extent; information regarding education or socioeconomic status was lacking, and the Charlson Comorbidity Index was a proxy for actual comorbidity status. Second, during the first wave, a positive swab as an outcome measure likely underestimated infection, and perhaps people with PD/PS were more likely to undergo swabbing because of factors related to the setting. However, the same trend was observed in the second wave, when this factor was less plausible.
By extending our preliminary observation on the first wave of COVID‐19 [11], including two pandemic waves, we substantially enriched real world epidemiological data on risk factors and prognosis after SARS‐CoV‐2 among people with PD and PS. Our findings may inform health care policy decisions by suggesting that during global health emergencies these chronic neurological disorders are high‐risk conditions and that particular attention should be paid to people with PS.
PARKLINK BOLOGNA COLLABORATORS
Emanuela Azzoni (AUSL di Bologna, Bologna, Italy), Francesca Baschieri (IRCCS Istituto delle Scienze Neurologiche di Bologna, Bologna, Italy), Marzio Bellan (Bologna, Italy), Lidia Bettelli (AUSL di Bologna, Bologna, Italy), Giuseppe Bonavina (Montecatone Rehabilitation Institute, Imola, Bologna, Italy), Sabina Capellari (IRCCS Istituto delle Scienze Neurologiche di Bologna, Bologna, Italy), Sabina Cevoli (IRCCS Istituto delle Scienze Neurologiche di Bologna, Bologna, Italy), Piero de Carolis (Bologna, Italy), Danilo Di Diodoro (Bologna, Italy), Giovanni Fabbri (AUSL di Bologna, Bologna, Italy), Renata Ferrara (Bologna, Italy), Anna Sandra Gabellini (Bologna, Italy), Fabiola Lucchi (AUSL di Bologna, Bologna, Italy), Barbara Mostacci (IRCCS Istituto delle Scienze Neurologiche di Bologna, Bologna, Italy), Gaetano Procaccianti (Bologna, Italy), Rita Rinaldi (IRCCS Istituto delle Scienze Neurologiche di Bologna, Bologna, Italy), Giovanni Rizzo (IRCCS Istituto delle Scienze Neurologiche di Bologna, Bologna, Italy), Tommaso Sacquegna (Bologna, Italy), Giuseppe Samoggia (AUSL di Bologna, Bologna, Italy), Antonella Tempestini (AUSL di Bologna, Bologna, Italy), and Carmelina Trocino (IRCCS Istituto delle Scienze Neurologiche di Bologna, Bologna, Italy).
AUTHOR CONTRIBUTIONS
Corrado Zenesini: Conceptualization (equal); data curation (equal); formal analysis (lead); methodology (equal); writing – original draft (equal). Luca Vignatelli: Conceptualization (equal); investigation (equal); methodology (equal); project administration (equal); writing – original draft (equal). Laura Maria Beatrice Belotti: Conceptualization (equal); data curation (equal); formal analysis (equal); methodology (equal); writing – review and editing (equal). Flavia Baccari: Data curation (equal); formal analysis (equal); writing – review and editing (equal). Giovanna Calandra‐Buonaura: Investigation (equal); project administration (supporting); writing – review and editing (equal). Pietro Cortelli: Investigation (equal); project administration (equal); resources (equal); writing – review and editing (equal). Carlo Descovich: Project administration (supporting); resources (equal); writing – review and editing (equal). Giulia Giannini: Investigation (equal); writing – review and editing (equal). Pietro Guaraldi: Investigation (equal); writing – review and editing (equal). Maria Guarino: Investigation (equal); resources (equal); writing – review and editing (equal). Giuseppe Loddo: Investigation (equal); writing – review and editing (equal). Roberta Pantieri: Investigation (equal); writing – review and editing (equal). Vincenza Perlangeli: Data curation (equal); resources (equal); writing – review and editing (equal). Cesa Scaglione: Project administration (supporting); resources (supporting); writing – review and editing (equal). Elisa Stivanello: Data curation (equal); resources (equal); writing – original draft (supporting). Susanna Trombetti: Project administration (equal); resources (equal); writing – review and editing (equal). Roberto D'Alessandro: Conceptualization (equal); investigation (equal); methodology (equal); project administration (equal); writing – review and editing (equal). Elisa Baldin: Conceptualization (equal); methodology (equal); project administration (equal); writing – review and editing (equal). Francesco Nonino: Conceptualization (equal); methodology (equal); project administration (equal); resources (equal); writing – original draft (equal).
CONFLICT OF INTEREST
All authors have completed the International Committee of Medical Journal Editors uniform disclosure form at www.icmje.org/coi_disclosure.pdf and declare no support from any organization for the submitted work, and no financial relationships with any organizations that might have an interest in the submitted work in the previous 3 years. L.V. has received honoraria for speaking from Lilly. G.C.‐B. has received honoraria for speaking from AbbVie, Zambon, and Bial. P.G. has received honoraria for speaking from Chiesi.
DISSEMINATION TO PARTICIPANTS AND RELATED PATIENT AND PUBLIC COMMUNITIES
The size of the study population precludes direct dissemination to participants.
FINANCIAL DISCLOSURES
All authors have completed the ICMJE uniform disclosure form at www.icmje.org/coi_disclosure.pdf and declare: no support from any organisation for the submitted work; no financial relationships with any organisations that might have an interest in the submitted work in the previous three years. LV has received honoraria for speaking from Lilly. GCB has received honoraria for speaking from AbbVie, Zambon, Bial. PG has received honoraria for speaking from Chiesi.
ETHICAL STATEMENT
The ethics committee of the Bologna local health trust (LHTB) approved the ParkLink Bologna project on 25 June 2015 (reference code: 15401). All patients included in the ParkLink cohort have given their written informed consent. The persons comprising the control cohort are anonymous. The approved protocol of the project defines as study population all the inhabitants of the geographical area covered by the LHTB.
Supporting information
Table S1
ACKNOWLEDGMENTS
All study participants and patients' representatives are thanked for their support to the ParkLink Bologna study (Paolo Badiali, Associazione Iniziative Parkinsoniane Imolesi; Graziano Benfenati, Associazione Iniziativa Parkinsoniani; Marinella Bozzoli, Associazione Amiko Parkinson; Anna Spiga, Associazione Parkinsoniani Pianura Est).
Zenesini C, Vignatelli L, Belotti LMB, et al. Risk of SARS‐CoV‐2 infection, hospitalization, and death for COVID‐19 in people with Parkinson disease or parkinsonism over a 15‐month period: A cohort study. Eur J Neurol. 2022;00:1‐13. doi: 10.1111/ene.15505
DATA AVAILABILITY STATEMENT
The study data are available upon request.
REFERENCES
- 1. Dong E, Du H, Gardner L. An interactive web‐based dashboard to track COVID‐19 in real time. Lancet Infect Dis. 2020;20:533‐534. [DOI] [PMC free article] [PubMed] [Google Scholar]
- 2. Artusi CA, Romagnolo A, Ledda C, et al. COVID‐19 and Parkinson's disease: what do we know so far? J Parkinsons Dis. 2021;11:445‐454. [DOI] [PMC free article] [PubMed] [Google Scholar]
- 3. Kleineberg NN, Knauss S, Gülke E, et al. Neurological symptoms and complications in predominantly hospitalized COVID‐19 patients: results of the European multinational Lean European Open Survey on SARS‐infected patients (LEOSS). Eur J Neurol. 2021;28:3925‐3937. [DOI] [PMC free article] [PubMed] [Google Scholar]
- 4. Hu Y, Yang H, Hou C, et al. COVID‐19 related outcomes among individuals with neurodegenerative diseases: a cohort analysis in the UK biobank. BMC Neurol. 2022;22:15. [DOI] [PMC free article] [PubMed] [Google Scholar]
- 5. Cilia R, Bonvegna S, Straccia G, et al. Effects of COVID‐19 on Parkinson's disease clinical features: a community‐based case‐control study. Mov Disord. 2020;35:1287‐1292. [DOI] [PMC free article] [PubMed] [Google Scholar]
- 6. Jaiswal V, Alquraish D, Sarfraz Z, et al. The influence of coronavirus disease‐2019 (COVID‐19) on Parkinson's disease: an updated systematic review. J Prim Care Community Health. 2021;12:21501327211039709. [DOI] [PMC free article] [PubMed] [Google Scholar]
- 7. El‐Qushayri AE, Ghozy S, Reda A, Kamel AMA, Abbas AS, Dmytriw AA. The impact of Parkinson's disease on manifestations and outcomes of Covid‐19 patients: a systematic review and meta‐analysis. Rev Med Virol. 2022;32:e2278. [DOI] [PMC free article] [PubMed] [Google Scholar]
- 8. Parihar R, Ferastraoaru V, Galanopoulou AS, Geyer HL, Kaufman DM. Outcome of Hospitalized Parkinson's Disease Patients with and without COVID‐19. Mov Disord Clin Pract. 2021;8:859‐867. [DOI] [PMC free article] [PubMed] [Google Scholar]
- 9. Putri C, Hariyanto TI, Hananto JE, Christian K, Situmeang RFV, Kurniawan A. Parkinson's disease may worsen outcomes from coronavirus disease 2019 (COVID‐19) pneumonia in hospitalized patients: A systematic review, meta‐analysis, and meta‐regression. Parkinsonism Relat Disord. 2021;87:155‐161. [DOI] [PMC free article] [PubMed] [Google Scholar]
- 10. Zhang Q, Schultz JL, Aldridge GM, Simmering JE, Narayanan NS. Coronavirus Disease 2019 Case Fatality and Parkinson's Disease. Mov Disord. 2020;35:1914‐1915. [DOI] [PMC free article] [PubMed] [Google Scholar]
- 11. Vignatelli L, Zenesini C, Belotti LMB, et al. Risk of Hospitalization and Death for COVID‐19 in People with Parkinson's Disease or Parkinsonism. Mov Disord. 2021;36:1‐10. [DOI] [PMC free article] [PubMed] [Google Scholar]
- 12. von Elm E, Altman DG, Egger M, Pocock SJ, Gøtzsche PC, Vandenbroucke JP. The Strengthening the Reporting of Observational Studies in Epidemiology (STROBE) statement: guidelines for reporting observational studies. Lancet. 2007;370:1453‐1457. [DOI] [PubMed] [Google Scholar]
- 13. Benchimol EI, Smeeth L, Guttmann A, et al. The REporting of studies Conducted using Observational Routinely‐collected health Data (RECORD) statement. PLoS Med. 2015;12:e1001885. [DOI] [PMC free article] [PubMed] [Google Scholar]
- 14. Gelb DJ, Oliver E, Gilman S. Diagnostic criteria for Parkinson disease. Arch Neurol. 1999;56:33‐39. [DOI] [PubMed] [Google Scholar]
- 15. Gilman S, Wenning GK, Low PA, et al. Second consensus statement on the diagnosis of multiple system atrophy. Neurology. 2008;71:670‐676. [DOI] [PMC free article] [PubMed] [Google Scholar]
- 16. Litvan I, Agid Y, Calne D, et al. Clinical research criteria for the diagnosis of progressive supranuclear palsy (Steele‐Richardson‐Olszewski syndrome): report of the NINDS‐SPSP international workshop. Neurology. 1996;47:1‐9. [DOI] [PubMed] [Google Scholar]
- 17. Zijlmans JC, Daniel SE, Hughes AJ, Révész T, Lees AJ. Clinicopathological investigation of vascular parkinsonism, including clinical criteria for diagnosis. Mov Disord. 2004;19:630‐640. [DOI] [PubMed] [Google Scholar]
- 18. Postuma RB, Berg D, Stern M, et al. MDS clinical diagnostic criteria for Parkinson's disease. Mov Disord. 2015;30:1591‐1601. [DOI] [PubMed] [Google Scholar]
- 19. Höglinger GU, Respondek G, Stamelou M, et al. Clinical diagnosis of progressive supranuclear palsy: The movement disorder society criteria. Mov Disord. 2017;32:853‐864. [DOI] [PMC free article] [PubMed] [Google Scholar]
- 20. Deyo RA, Cherkin DC, Ciol MA. Adapting a clinical comorbidity index for use with ICD‐9‐CM administrative databases. J Clin Epidemiol. 1992;45:613‐619. [DOI] [PubMed] [Google Scholar]
- 21. StataCorp , ed. Stata Statistical Software. In: 14 R, ed. StataCorp LP; 2015. [Google Scholar]
- 22. Liu L, Ni SY, Yan W, et al. Mental and neurological disorders and risk of COVID‐19 susceptibility, illness severity and mortality: a systematic review, meta‐analysis and call for action. EClinicalMedicine. 2021;40:101111. [DOI] [PMC free article] [PubMed] [Google Scholar]
- 23. Fasano A, Cereda E, Barichella M, et al. COVID‐19 in Parkinson's disease patients living in Lombardy, Italy. Mov Disord. 2020;35:1089‐1093. [DOI] [PMC free article] [PubMed] [Google Scholar]
- 24. Artusi CA, Romagnolo A, Imbalzano G, et al. COVID‐19 in Parkinson's disease: report on prevalence and outcome. Parkinsonism Relat Disord. 2020;80:7‐9. [DOI] [PMC free article] [PubMed] [Google Scholar]
- 25. Scherbaum R, Kwon EH, Richter D, et al. Clinical profiles and mortality of COVID‐19 inpatients with Parkinson's disease in Germany. Mov Disord. 2021;36:1049‐1057. [DOI] [PMC free article] [PubMed] [Google Scholar]
- 26. Profili F, Ballo P, Balzi D, et al. Chronic diseases and risk of symptomatic COVID‐19: results of a case‐population study on a sample of patients in the Local Health Unit ‘Toscana Centro’ (Tuscany Region, Central Italy). Epidemiol Prev. 2020;44:308‐314. [DOI] [PubMed] [Google Scholar]
- 27. Yu Y, Travaglio M, Popovic R, Leal NS, Martins LM. Alzheimer's and Parkinson's diseases predict different COVID‐19 outcomes: A UK biobank study. Geriatrics (Basel). 2021;6:10. [DOI] [PMC free article] [PubMed] [Google Scholar]
- 28. Hippisley‐Cox J, Coupland CA, Mehta N, et al. Risk prediction of covid‐19 related death and hospital admission in adults after covid‐19 vaccination: national prospective cohort study. BMJ. 2021;374:n2244. [DOI] [PMC free article] [PubMed] [Google Scholar]
- 29. Hosking A, AALJ H, Lorenzl S, et al. Characteristics of patients with late‐stage Parkinsonism who are nursing home residents compared with those living at home. J Am Med Dir Assoc. 2021;22:440‐445. [DOI] [PubMed] [Google Scholar]
- 30. Trabucchi M, De Leo D. Nursing homes or besieged castles: COVID‐19 in Northern Italy. Lancet Psychiatry. 2020;7:387‐388. [DOI] [PMC free article] [PubMed] [Google Scholar]
- 31. Danis K, Fonteneau L, Georges S, et al. High impact of COVID‐19 in long‐term care facilities, suggestion for monitoring in the EU/EEA, May 2020. Euro Surveill. 2020;25:2000956. [DOI] [PMC free article] [PubMed] [Google Scholar]
- 32. Dykgraaf SH, Matenge S, Desborough J, et al. Protecting nursing homes and long‐term care facilities from COVID‐19: a rapid review of international evidence. J Am Med Dir Assoc. 2021;22:1969‐1988. [DOI] [PMC free article] [PubMed] [Google Scholar]
- 33. Cangiano B, Fatti LM, Danesi L, et al. Mortality in an Italian nursing home during COVID‐19 pandemic: correlation with gender, age, ADL, vitamin D supplementation, and limitations of the diagnostic tests. Aging (Albany NY). 2020;12:24522‐24534. [DOI] [PMC free article] [PubMed] [Google Scholar]
- 34. Zhang Q, Bastard P, Cobat A, Casanova JL. Human genetic and immunological determinants of critical COVID‐19 pneumonia. Nature. 2022;603:587‐598. [DOI] [PMC free article] [PubMed] [Google Scholar]
- 35. Nissen SK, Shrivastava K, Schulte C, et al. Alterations in blood monocyte functions in Parkinson's disease. Mov Disord. 2019;34:1711‐1721. [DOI] [PubMed] [Google Scholar]
- 36. Jiang S, Gao H, Luo Q, Wang P, Yang X. The correlation of lymphocyte subsets, natural killer cell, and Parkinson's disease: a meta‐analysis. Neurol Sci. 2017;38:1373‐1380. [DOI] [PubMed] [Google Scholar]
- 37. Yan Z, Yang W, Wei H, et al. Dysregulation of the adaptive immune system in patients with early‐stage Parkinson disease. Neurol Neuroimmunol Neuroinflamm. 2021;8:e1036. [DOI] [PMC free article] [PubMed] [Google Scholar]
- 38. Wang Y, Shao WB, Gao L, et al. Abnormal pulmonary function and respiratory muscle strength findings in Chinese patients with Parkinson's disease and multiple system atrophy—comparison with normal elderly. PLoS One. 2014;9:e116123. [DOI] [PMC free article] [PubMed] [Google Scholar]
- 39. Colosimo C, Morgante L, Antonini A, et al. Non‐motor symptoms in atypical and secondary parkinsonism: the PRIAMO study. J Neurol. 2010;257:5‐14. [DOI] [PubMed] [Google Scholar]
- 40. Savica R, Grossardt BR, Bower JH, et al. Survival and causes of death among people with clinically diagnosed synucleinopathies with parkinsonism: a population‐based study. JAMA Neurol. 2017;74:839‐846. [DOI] [PMC free article] [PubMed] [Google Scholar]
- 41. Glasmacher SA, Leigh PN, Saha RA. Predictors of survival in progressive supranuclear palsy and multiple system atrophy: a systematic review and meta‐analysis. J Neurol Neurosurg Psychiatry. 2017;88:402‐411. [DOI] [PubMed] [Google Scholar]
- 42. Glass PG, Lees AJ, Bacellar A, Zijlmans J, Katzenschlager R, Silveira‐Moriyama L. The clinical features of pathologically confirmed vascular parkinsonism. J Neurol Neurosurg Psychiatry. 2012;83:1027‐1029. [DOI] [PubMed] [Google Scholar]
- 43. Wiblin L, Lee M, Burn D. Palliative care and its emerging role in multiple system atrophy and progressive supranuclear palsy. Parkinsonism Relat Disord. 2017;34:7‐14. [DOI] [PubMed] [Google Scholar]
- 44. Jecmenica‐Lukic M, Petrovic IN, Pekmezovic T, Kostic VS. Clinical outcomes of two main variants of progressive supranuclear palsy and multiple system atrophy: a prospective natural history study. J Neurol. 2014;261:1575‐1583. [DOI] [PubMed] [Google Scholar]
- 45. Rajgor DD, Lee MH, Archuleta S, Bagdasarian N, Quek SC. The many estimates of the COVID‐19 case fatality rate. Lancet Infect Dis. 2020;20:776‐777. [DOI] [PMC free article] [PubMed] [Google Scholar]
- 46. Dessie ZG, Zewotir T. Mortality‐related risk factors of COVID‐19: a systematic review and meta‐analysis of 42 studies and 423,117 patients. BMC Infect Dis. 2021;21:855. [DOI] [PMC free article] [PubMed] [Google Scholar]
- 47. Khoshnood RJ, Zali A, Tafreshinejad A, et al. Parkinson's disease and COVID‐19: a systematic review and meta‐analysis. Neurol Sci. 2022;43:775‐783. [DOI] [PMC free article] [PubMed] [Google Scholar]
- 48. Hariyanto TI, Putri C, Arisa J, Situmeang RFV, Kurniawan A. Dementia and outcomes from coronavirus disease 2019 (COVID‐19) pneumonia: a systematic review and meta‐analysis. Arch Gerontol Geriatr. 2021;93:104299. [DOI] [PMC free article] [PubMed] [Google Scholar]
- 49. July J, Pranata R. Prevalence of dementia and its impact on mortality in patients with coronavirus disease 2019: a systematic review and meta‐analysis. Geriatr Gerontol Int. 2021;21:172‐177. [DOI] [PubMed] [Google Scholar]
- 50. Saragih ID, Saragih IS, Batubara SO, Lin CJ. Dementia as a mortality predictor among older adults with COVID‐19: a systematic review and meta‐analysis of observational study. Geriatr Nurs. 2021;42:1230‐1239. [DOI] [PMC free article] [PubMed] [Google Scholar]
- 51. Tahira AC, Verjovski‐Almeida S, Ferreira ST. Dementia is an age‐independent risk factor for severity and death in COVID‐19 inpatients. Alzheimers Dement. 2021;17:1818‐1831. [DOI] [PMC free article] [PubMed] [Google Scholar]
- 52. Kim JH, Chang IB, Kim YH, Min CY, Yoo DM, Choi HG. The association of pre‐existing diagnoses of Alzheimer's disease and Parkinson's disease and Coronavirus disease 2019 infection, severity and mortality: results from the Korean National Health Insurance Database. Front Aging Neurosci. 2022;14:821235. [DOI] [PMC free article] [PubMed] [Google Scholar]
- 53. Pringsheim T, Jette N, Frolkis A, Steeves TD. The prevalence of Parkinson's disease: a systematic review and meta‐analysis. Mov Disord. 2014;29:1583‐1590. [DOI] [PubMed] [Google Scholar]
Associated Data
This section collects any data citations, data availability statements, or supplementary materials included in this article.
Supplementary Materials
Table S1
Data Availability Statement
The study data are available upon request.