Abstract
Coronavirus disease 2019 (COVID‐19) caused by severe acute respiratory syndrome coronavirus 2 (SARS‐CoV‐2) infection can result in severe immune dysfunction, hospitalization, and death. Many patients also develop long‐COVID‐19, experiencing symptoms months after infection. Although significant progress has been made in understanding the immune response to acute SARS‐CoV‐2 infection, gaps remain in our knowledge of how innate immunity influences disease kinetics and severity. We hypothesized that cytometry by time‐of‐flight analysis of PBMCs from healthy and infected subjects would identify novel cell surface markers and innate immune cell subsets associated with COVID‐19 severity. In this pursuit, we identified monocyte and dendritic cell subsets that changed in frequency during acute SARS‐CoV‐2 infection and correlated with clinical parameters of disease severity. Subsets of nonclassical monocytes decreased in frequency in hospitalized subjects, yet increased in the most severe patients and positively correlated with clinical values associated with worse disease severity. CD9, CD163, PDL1, and PDL2 expression significantly increased in hospitalized subjects, and CD9 and 6‐Sulfo LacNac emerged as the markers that best distinguished monocyte subsets amongst all subjects. CD9+ monocytes remained elevated, whereas nonclassical monocytes remained decreased, in the blood of hospitalized subjects at 3–4 months postinfection. Finally, we found that CD9+ monocytes functionally released more IL‐8 and MCP‐1 after LPS stimulation. This study identifies new monocyte subsets present in the blood of COVID‐19 patients that correlate with disease severity, and links CD9+ monocytes to COVID‐19 progression.
Keywords: CyTOF, long‐COVID‐19, nonclassical monocytes, SARS‐CoV‐2, Slan, T cells
Graphical Abstract
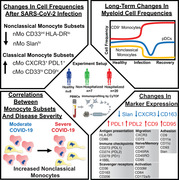
SARS‐CoV‐2 infection induces long‐lasting changes in the myeloid cell compartment, and novel monocyte subsets, distinguished by expression of CD9 and Slan, correlate with COVID‐19 severity.
Abbreviations
- cDC
classical dendritic cells
- cMo
classical monocytes
- COPD
chronic obstructive pulmonary disease
- COVID‐19
coronavirus disease 2019
- CyTOF
cytometry by time‐of‐flight
- DC
dendritic cell
- DN T cells
double negative T cells
- DP T cells
double positive T cells
- GLMM
Generalized Linear Mixed Model
- immature Mo
immature monocyte
- iMo
intermediate monocyte
- INR
international normalized ratio
- ITU
intensive treatment unit
- LDH
lactate dehydrogenase
- LIMMA
Linear Models for Microarray Data
- nMo
nonclassical monocyte
- pDCs
plasmacytoid dendritic cells
- PSGL‐1
Selectin P ligand‐1
- SARS‐CoV‐2
severe acute respiratory syndrome coronavirus 2
- Slan
6‐Sulfo LacNAc
- UMAP
Uniform Manifold Approximation and Projection plot
1. INTRODUCTION
Coronavirus disease 2019 (COVID‐19), caused by severe acute respiratory syndrome (SARS)‐coronavirus‐2 (SARS‐CoV‐2), has claimed over 6 million lives globally. 1 COVID‐19 patients present along a spectrum of severity, ranging from those with asymptomatic or mild flu‐like disease to those with critical disease and acute respiratory distress syndrome, which requires hospitalization and mechanically assisted ventilation. 2
An inflammatory immune response marked by lymphopenia, delayed T cell and antibody responses, increased numbers of monocytes and neutrophils with defective IFN antiviral responses, decreased plasmacytoid dendritic cells (pDCs), and increases of proinflammatory cytokines like TNF‐a and IL‐6 have all been correlated with increased COVID‐19 severity and worse patient outcomes. 3 , 4 , 5 , 6 , 7 , 8 Also, expansion of CD14+ HLA‐DRlo and immunosuppressive immature monocytes has been observed in BMCs from severely ill COVID‐19 patients. 6 , 7 , 9 , 10 A general loss of intermediate and/or nonclassical monocytes has also been observed in patients with acute and severe cases of COVID‐19, 6 , 7 , 10 , 11 , 12 with an increased proportion of nonclassical monocytes and DCs migrating to the lungs. 10 , 13 We have recently identified 8 monocyte subsets in healthy humans, 14 , 15 and we and others have observed that monocyte subsets can have unique contributions to the progression of disease, 14 , 16 but detailed analyses of monocyte subsets in COVID‐19 are still just emerging. 6 , 11 , 12 , 13 , 17 , 18
Herein, we utilized cytometry by time‐of‐flight (CyTOF) to identify monocyte (Mo) and DC subsets from healthy subjects and COVID‐19 patients that could regulate the immune response to SARS‐CoV‐2 infection. We also tracked monocyte frequencies at approximately 3 months postinfection in some of the hospitalized subjects. Together, these data generate a more detailed picture of how immune cells change during SARS‐CoV‐2 infection and identify new subsets of monocytes that may influence the clinical progression of COVID‐19.
2. METHODS
2.1. Patient samples
This study was approved by the Berkshire Research Ethics 20/SC/0155 (UK) and the Human Institutional Review board of La Jolla Institute for Immunology (LJI). Written, informed consent was obtained for all subjects. Healthy subjects (n = 8) donated blood at the San Diego Blood Bank or the LJI Clinical Core. Hospitalized subjects (n = 20) were treated in a teaching hospital in England, either in a general ward or the intensive treatment unit (ITU). SARS‐CoV‐2 infection was confirmed by reverse transcriptase polymerase reaction or detection of antispike protein antibodies. Single‐cell transcriptome analysis of virus‐reactive CD4+ and CD8+ memory T cells was performed by our colleagues using many of the same COVID‐19 patient samples in this study. 1 , 20
2.2. Sample processing
PBMCs from recovered COVID‐19 individuals or healthy subjects were barcoded with CD45 and stained with an established monocyte/T cell panel. 14 Samples were assayed in 5 CyTOF runs. A technical control of healthy PBMCs was CD45 barcoded and spiked into each sample. Data were bead‐based normalized using the Matlab‐based NormalizerR2013a_Win64. Only live cells were used for analysis.
2.3. CyTOF analysis
Each CyTOF sample was debarcoded using a deconvolution algorithm 21 implemented in the CATALYST Bioconductor package. Data were normalized using an arcsinh transformation (cofactor = 5). Batch correction was done using a quantile normalization method for the pooled distribution of each batch (a pair of sample and spike‐in control) in the function normalizeBatch from the CYDAR Bioconductor package (Figure S1). 22 We used the FlowSOM clustering method 23 with default parameters to identify major cell types from CD45+ live cells. Cell types were identified using lineage markers. Consensus clustering was used to justify the optimal number of clusters from k = 2–30 to based on the relative decrease in area under the cumulative distribution function curve. Clusters were merged based on the similarity of their representative protein markers. Heatmaps of median protein expression and Uniform Manifold Approximation and Projection plot (UMAP) deduction were generated using CATALYST.
2.4. Monocyte isolation
Healthy donor blood was obtained from the LJI Clinical Core. Whole blood was centrifuged at 500×g for 10 min. Plasma was discarded and remaining blood was mixed 1:1 with PBS (Corning Inc, Corning, NY) with 2% FBS (Omega Scientific, Tarzana, CA), layered on lymphoprep (Stemcell Technologies, Vancouver, BC) and centrifuged at 1200×g for 10 min. The buffy coat was isolated and enriched for monocytes using the MACS Pan Human Monocyte Isolation Kit (Miltenyi Biotec, Bergisch Gladbach, North Rhine‐Westphalia). 5 × 10⁶ monocytes were sorted by flow cytometry using CD14‐FITC (Biolegend, San Diego, CA clone M5E2), CD16‐BV421 (Biolegend clone B73.1), CD9‐PE (Biolegend clone HI9a), Dump‐PerCP‐Cy5.5 (CD19 (Biolegend clone HIB19), CD3 (BD Pharmingen clone UCHT1), CD56 (Biolegend clone MEM‐188) and CD66b (Biolegend clone G10F5)), and Live/Dead‐Yellow (Invitrogen).
2.5. Cytokine assays
0.5 × 10⁶ CD9+ and CD9– sorted monocytes were plated onto a 24‐well plate in DMEM (Gibco, Waltham, MA) with 10% FBS. Cells were stimulated for 16 h with 100 ng/ml of LPS (Enzo Biochem, Farmingdale, NY) or equal volume of vehicle control (DMSO). Supernatants were collected and measured for cytokine production using the LEGENDplex human essential immune response kit (Biolegend) and analyzed using LEGENDplex software.
2.6. Statistical analysis
Linear modeling, using the Linear Models for Microarray Data (LIMMA) package, was performed to detect statistically significant differentially expressed markers, 24 and a Generalized Linear Mixed Model (GLMM), used through a lme4 package, was used to determine statistically significant differential cell population abundances. 25 Correlations of T cell and monocyte/DC subset frequencies with clinical parameters were performed using Spearman rank correlation tests. Cytokine data were analyzed using GraphPad‐PRISM software.
3. RESULTS AND DISCUSSION
3.1. Immunoprofiling of PBMCs from COVID‐19 patients
In order to examine the immune compartment after SARS‐CoV‐2 infection, PBMCs and clinical data were obtained from 7 nonhospitalized and 20 hospitalized subjects with COVID‐19 and 8 healthy subjects who were age‐ and sex‐matched with the hospitalized subjects (Figures 1(A) and 1(B)). Comorbidities in hospitalized COVID‐19 patients were primarily cardiovascular in scope, including prior histories of myocardial infarction and hypertension (Table S1). PBMCs were analyzed using a 38‐marker CyTOF panel focused on identifying monocyte and DC subsets (Figure 1(C)).
FIGURE 1.
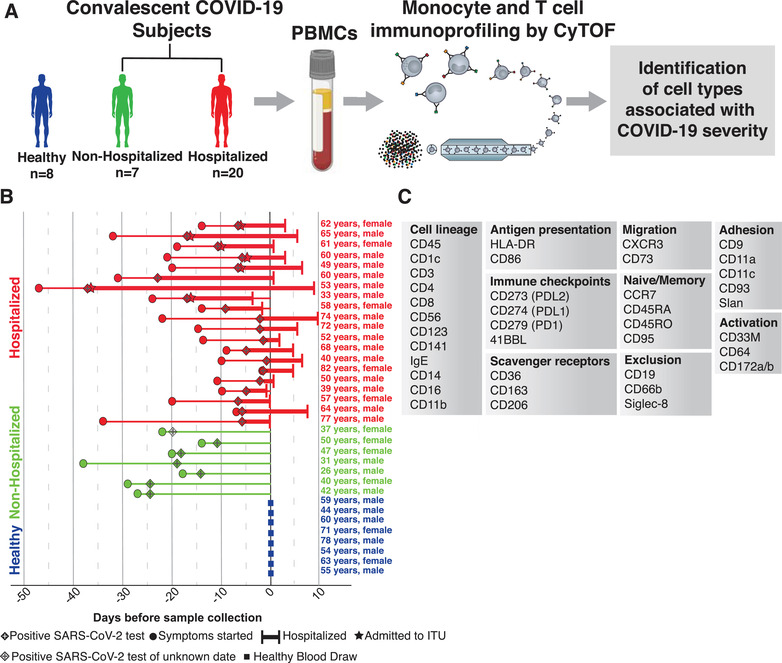
Experimental layout. Flowchart of experimental design (A). Chart of every subject included in our analysis, with their condition (healthy, nonhospitalized, and hospitalized), age, sex, date of symptom onset, date of positive SARS‐CoV‐2 test, ITU status, span of hospital admission, and date of blood draw (B). List of markers used in immunoprofiling CyTOF panel grouped by their biologic roles (C)
3.2. Changes in protein expression and immune cell frequencies during COVID‐19
Using the CyTOF data after batch correction (Figure S1), we first assessed changes in global cell surface marker expression and immune cell frequencies in individuals stratified by their hospitalization and infection status (healthy, nonhospitalized, hospitalized). Clusters were identified by referencing their median expression of 35 cell surface markers (Figures 2(A)–(2C)).
FIGURE 2.
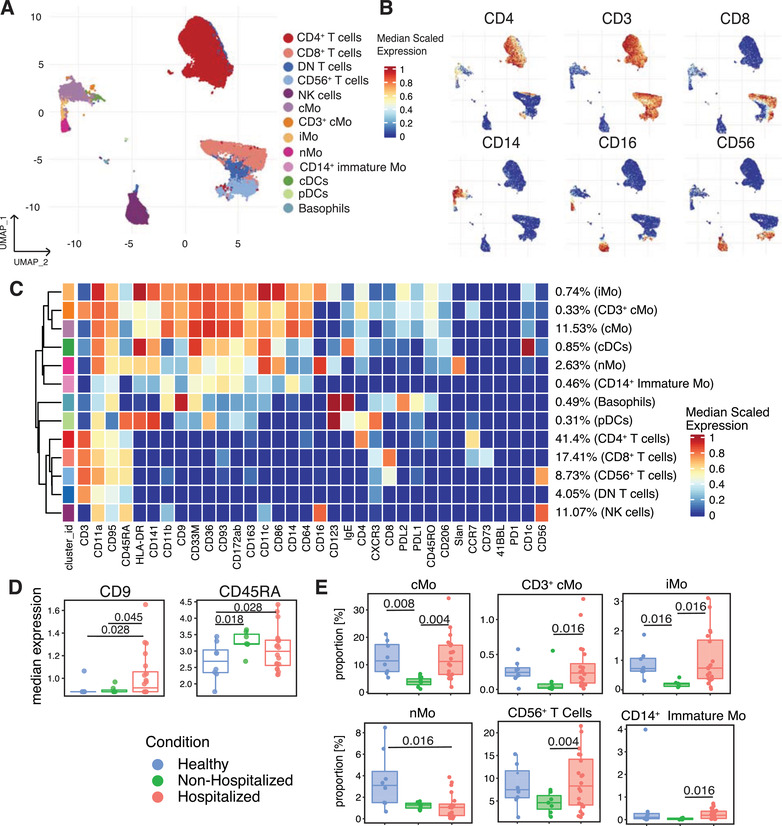
CyTOF‐mediated identification of changes in immune cell cluster frequencies and surface marker expression in convalescent COVID‐19 subjects. CD45+ Dump– leukocytes from healthy and COVID‐19 subjects clustered and projected onto a UMAP (A). Expression of cell surface markers projected onto the UMAP of (A) as feature plots (B). Heatmap displaying each cluster's scaled median expression for 34 markers (C). Box and whisker plots showing median expression of CD9 and CD45RA within the CD45+ Dump– cells for healthy, nonhospitalized, and hospitalized subjects (D). Box and whisker plots of individual cell clusters as a proportion of CD45+ Dump– cells between healthy, nonhospitalized, and hospitalized subjects (E). Statistically significant (p ≤ 0.05) changes were calculated using adjusted p values generated after a multiple‐comparisons correction. Changes in cluster frequencies were calculated using GLMM while changes in marker expression were calculated with LIMMA
Of the 35 surface markers, 16 were primarily markers of cell identity and lineage, so we chose to examine changes in expression of the remaining 19 markers (Table S2). Within these 19 markers, the expression of CD9 and CD45RA significantly increased in the hospitalized subjects (Figure 2(D)). Out of the 13 major immune cell clusters identified within the CD45+ cells for all subjects, the hospitalized subjects displayed a significant increase in the frequency of cMo, CD3+ cMo, iMo, CD56+ T cell, and CD14+ immature monocyte clusters compared with nonhospitalized subjects, and a decrease in the frequency of the nMo cluster compared with the healthy subjects (Figure 2(E)). Notably, none of the changes in cell cluster frequencies in this or subsequent analyses could be attributed to sex or age amongst the donors (Figure S2).
3.3. Subclustering of monocytes and DCs and characterization of CD9+ monocytes
All monocytes and DCs identified in Figure 2(A) were subclustered to obtain a more detailed characterization of the heterogeneity within these populations (Figure 3(A)). Identical subclustering and analysis was also performed for the T cell clusters (Figure S3). When comparing the median expression of the Table S2 markers, we found that expression of CD64, CD163, CD36, CD9, PDL1, and PDL2 all significantly increased, whereas CD95 and 6‐Sulfo LacNAc (Slan) expression significantly decreased and HLA‐DR trended lower in hospitalized subjects (Figures 3(B) and 3(C)). The increases in PDL1 and PDL2 expression suggest that these monocytes and DCs may be more immunosuppressive and capable of inhibiting T cell activity than their counterparts in healthy individuals. 26 , 27 Our finding that expression of HLA‐DR trended lower while CD163 increased has been seen by others 6 , 7 and has been suggested to cause monocytes to be less effective at presenting antigen. CD9 is a tetraspanin that serves as a scaffolding protein for a wide variety of cell surface receptors. 28 For example, CD9 is an important mediator of cell adhesion to the endothelium, MHCII presentation, T cell activation, and LPS‐induced TLR4 signaling in myeloid cells. 29 , 30 , 32 CD9 mRNA expression increases within classical monocytes of subjects with COVID‐19 compared with healthy controls, 18 but this is the first time that CD9 has also been observed to be affected at a protein level.
FIGURE 3.
Changes in monocyte and dendritic cell surface marker expression, subset frequencies and monocyte subset cytokine release in COVID‐19 subjects. Monocyte and dendritic cell clusters from Figure 2(A) were subclustered and displayed in their own UMAP (A). Heatmap displaying each subcluster's scaled median expression of 34 markers (B). Box and whisker plots showing median expression of cell surface markers within all monocytes and dendritic cells used in this subclustering analysis for healthy, nonhospitalized, and hospitalized subjects (C). Box and whisker plots of individual cell clusters as a proportion of all cells in this subclustering analysis between healthy, nonhospitalized, and hospitalized subjects (D). CD9+ and CD9– human monocytes were sorted from healthy human blood and 0.5 × 10⁶ monocytes were incubated with 100 ng/ml of LPS or vehicle control for 16 h. Cell supernatants were collected and used in Luminex analysis for cytokine release quantification (E). Stacked violin plots displaying median expression of CD9, Slan, PDL1, and PDL2 in healthy, nonhospitalized, and hospitalized subjects in each subcluster of monocytes and dendritic cells. The dots represent each individual's median expression levels and the black horizontal bars represent the median expression levels of each condition (F). Statistically significant (p ≤ 0.05) changes were calculated using adjusted p values generated after a multiple‐comparisons correction. Changes in cluster frequencies were calculated using GLMM, changes in marker expression were calculated with LIMMA and changes in cytokine release were calculated with one‐way ANOVA with a post hoc Tukey's test
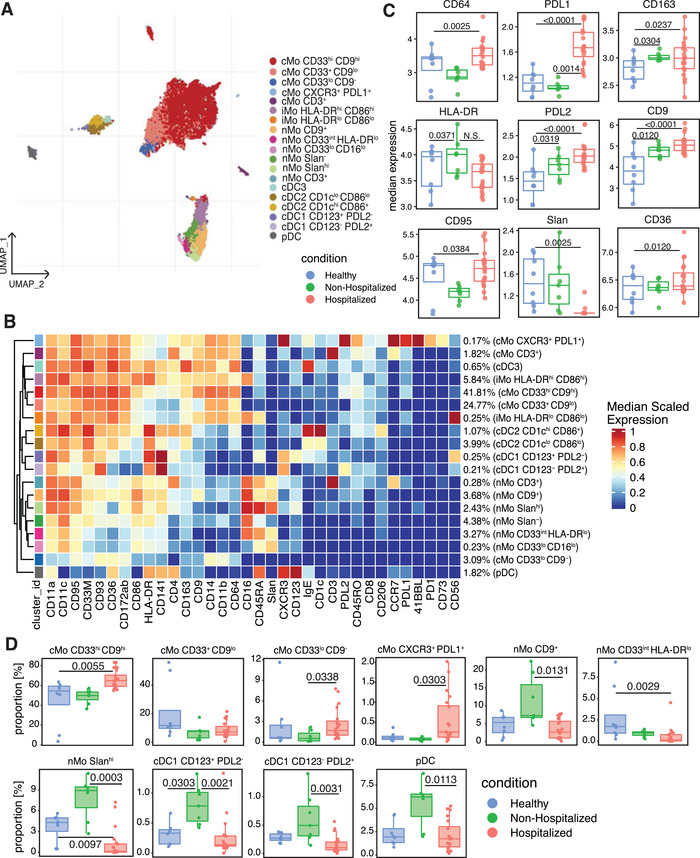
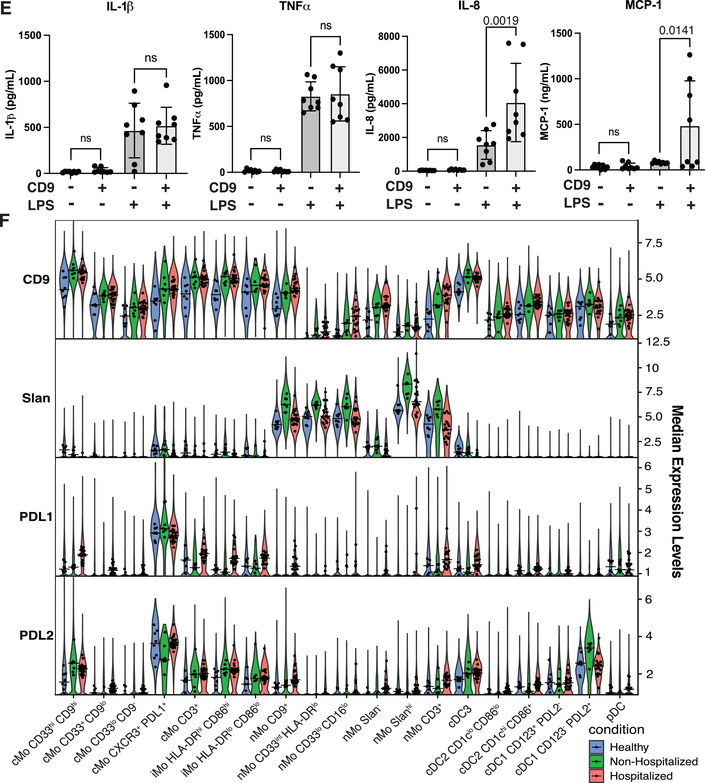
Our prior work on human cardiovascular disease demonstrates that monocytes can be classified into easily defined subsets with unique phenotypes. 14 After subclustering the monocytes and DCs in our COVID‐19 cohort, cMos grouped into 5 separate clusters. While examining markers defining the cMo subsets, we found that CD9 divided the majority of cMos into CD9hi and CD9lo or CD9– clusters (Figures 3(B) and 3(D)). CD9 has not previously been shown to differentiate between cMo subclusters. The CD33hi CD9hi, CD33lo CD9–, and CXCR3+ PD‐L1+ cMo clusters were significantly enriched in the hospitalized subjects compared with the healthy or nonhospitalized subjects (Figure 3(D)). Furthermore, CD9+ monocytes sorted from healthy PBMCs released similar levels of IL‐1β and TNFα, but significantly more IL‐8 and MCP‐1 than CD9– monocytes after LPS stimulation (Figure 3(E)). This increase in ability to release IL‐8 and MCP‐1 suggests that CD9+ monocytes may be some of the primary cells responsible for monocyte and neutrophil recruitment during SARS‐CoV‐2 infection.
nMos grouped into 6 separate clusters (Figure 3(A)), and as we have previously reported, 14 the marker that best differentiated between nonclassical monocyte subclusters was Slan, a glycosylated form of Selectin P ligand‐1 (Figure 3(B)). Slan expression was significantly lower in the hospitalized subjects compared with each other condition (Figure 3(C)), likely because a Slanhi nMo cluster was significantly decreased in the hospitalized COVID‐19 subjects compared with healthy and nonhospitalized subjects (Figure 3(D)). In addition, a nMo CD9+ cluster and a nMo CD33int HLA‐DRlo cluster in the hospitalized subjects both decreased in frequency compared to the nonhospitalized subjects (Figure 3(D)). The effect on CD9 expression caused by the decrease in the nMo CD9+ cluster was likely outweighed by the increase in the much larger cMo CD33hi CD9hi cluster, and there was a general increase of CD9, PDL1, and PDL2 expression and decrease of Slan expression within all monocytes and DCs of hospitalized subjects (Figure 3(F)).
Within the cDC subclusters, CD123+ PDL2– and CD123– PD‐L2+ cDC1s were significantly enriched in the nonhospitalized subjects. Also, pDCs were significantly decreased in frequency within the hospitalized condition compared with the nonhospitalized condition, matching what others have described. 7 , 33
3.4. Correlations between cell cluster frequencies and clinical parameters of clotting and inflammatory cell death in hospitalized COVID‐19 subject blood
After identifying clusters that significantly changed in frequency between subjects, we asked which of these clusters may influence disease progression by correlating their frequencies with known clinical parameters related to COVID‐19 severity in the hospitalized subjects (Figures 4(A) and 4(B)). While classical monocytes did not significantly correlate with any clinical measurement, nonclassical monocyte frequencies significantly correlated with higher D‐Dimer, INR, and LDH levels within COVID‐19 hospitalized patients (Figure 4(A)). The Slanhi nMo and CD33int HLA‐DRlo nMo subclusters that decreased in frequency within the hospitalized condition (Figure 3(D)) were positively correlated with INR, LDH, and D‐Dimer levels in hospitalized COVID‐19 subjects (Figure 4(B)). In opposition to the nonclassical monocytes, the CXCR3+ PDL1+ cMo subcluster that increased in the hospitalized subjects (Figure 3(D)) was negatively correlated with INR, LDH, and D‐Dimer values (Figure 4(B)). Considering their heightened expression of PDL1 and CXCR3, it is possible that these cMos could both respond to IFN‐inducible chemokines and travel to sites of infection while also suppressing T cell activity. Interestingly, each of the nonclassical monocyte clusters that positively correlated with clinical values of more severe disease were also clusters that significantly decreased in the hospitalized subjects compared with the healthy or nonhospitalized subjects (Figures 3(C) and 3(D)). Likewise, the classical monocyte clusters that negatively correlated with the clinical values was significantly increased in the hospitalized subjects (Figures 3(C) and 3(D)).
FIGURE 4.
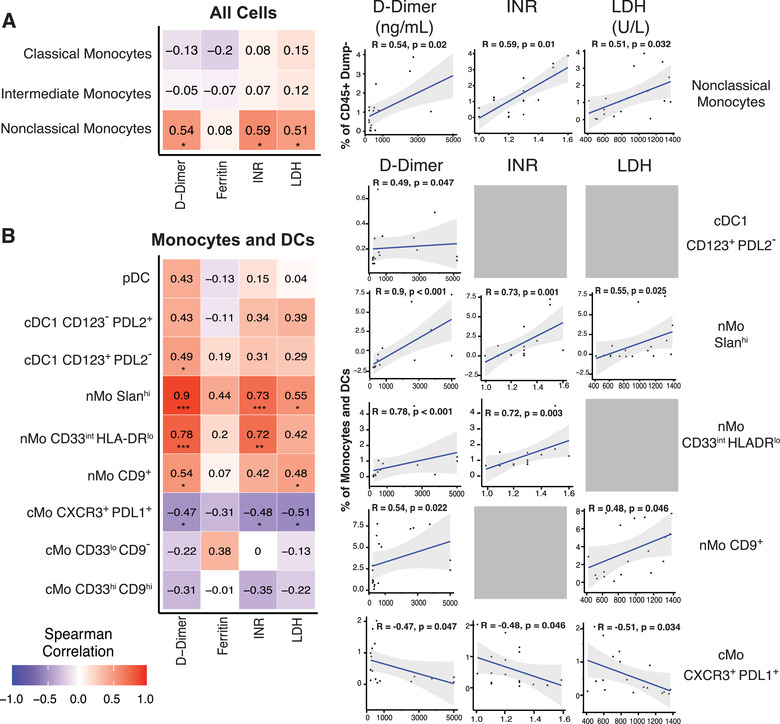
Monocyte and dendritic cell subsets in hospitalized subjects correlate with clinical parameters associated with COVID‐19 severity. Spearman correlation heatmaps and plots showing correlations between classical, intermediate and nonclassical monocyte clusters from Figure 2 and the clinical parameters (D‐Dimer, INR, LDH, and Ferritin values) obtained from 18 of the hospitalized subjects (A). Spearman Correlation heatmap and plots for correlations between monocyte and dendritic cell subclusters from Figure 3(A) and COVID‐19 clinical values as in Figure 4(A) and 4(B). R values are presented at the center of each heatmap block
We next looked more closely at hospitalized subjects by separating them int moderate disease or severe disease groups (Table S1). When we compared changes in overall marker expression and monocyte and DC subcluster frequencies between the moderate and severe disease subjects, each nMo cluster except for the CD3+ nMos, significantly increased in the severe disease subjects (Figure 5(A)). These increases in cluster frequencies could explain the positive correlations between nMo subset frequencies and the clinical values associated with more severe COVID‐19 and thus strengthen the argument that these cells may be pathogenic during COVID‐19. Similarly, the increase of CD163 and decrease of CD95 expression in the severe patients matches data in Figure 3(C), giving more credence to changes in these markers as strong indicators of severe disease (Figure 5(B)). However, the decrease in CD64 expression contradicts the increase in CD64 expression in Figure 3(C), suggesting that CD64 is not an ideal marker for severe COVID‐19. The decrease in CXCR3 expression in severe hospitalized subjects, coupled with decreased CXCR3 expression in the T cells of hospitalized subjects (Figure S3(B)), matches well with other data showing decreased CXCR3 expression in lung‐infiltrating T cells in severe COVID‐19. 34 CXCR3 is a receptor for CXCL9, CXCL10, and CXCL11, which are all IFN‐inducible genes and contribute to T cell migration and homing, 35 , 36 and the IFN response is one of the most vital antiviral responses and critical for control of COVID‐19. 18 , 37 Taken together, these findings help identify immune cell clusters that may influence COVID‐19 disease severity and suggest that nonclassical monocytes likely contribute to inflammatory cell death and clotting during COVID‐19.
FIGURE 5.
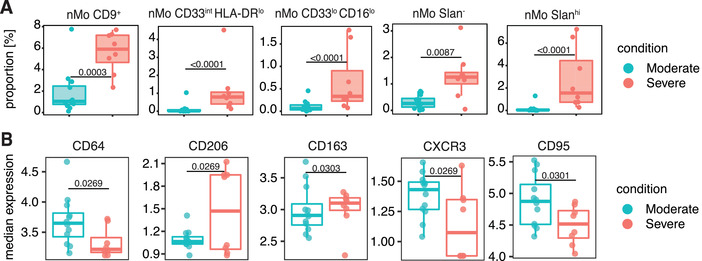
Changes in monocyte and dendritic cell subsets and surface marker expression in moderate and severe hospitalized COVID‐19 subjects. Box and whisker plots of individual cell clusters as a proportion of all cells in the Figure 3 subclustering analysis for moderate and severe hospitalized COVID‐19 subjects (A). Box and whisker plots showing median expression of cell surface markers within all monocytes and dendritic cells used in the Figure 3 subclustering analysis for moderate and severe hospitalized COVID‐19 subjects (B). Statistically significant (p ≤ 0.05) changes were calculated using adjusted p‐values generated after a multiple‐comparisons correction. Changes in marker expression were calculated with LIMMA
3.5. Longitudinal changes of immune cell frequencies in COVID‐19
While it is important to understand the acute pathogenesis of COVID‐19 and its effects on immune cell populations, there can also be long‐lasting and debilitating symptoms of infection in what has been termed long‐COVID‐19. 38 , 39 , 40 Given the timeframe needed to study long‐COVID‐19, there are still relatively few studies that have examined long‐term effects of COVID‐19 on immune cell populations. Fortunately, we were able to study longitudinal changes in the immune compartment after obtaining blood samples from hospitalized subjects approximately 90 days (Day 90) after their initial blood draw (Day 0). We applied a gating scheme to identify major cell types in our CyTOF data at both timepoints. These data showed that the frequency of pDCs in the hospitalized individuals increased at 90 days postinfection (Figure 6(A)). However, there were no significant changes in T cell, total monocyte, cMo, or iMo frequencies between timepoints in the hospitalized individuals (Figures 6(B)–6(E)). nMos, which decreased in frequency after acute infection, remained decreased during the 3‐month timeframe (Figure 6(F)). Further, the CD9+ monocytes remained elevated over time in hospitalized COVID‐19 subjects compared with healthy individuals (Figure 6(G)). While the Slan+ nMos did not significantly increase at Day 90 compared with Day 0, they were no longer significantly decreased in frequency compared to healthy controls (Figure 6(H)). These results suggest that SARS‐CoV‐2 infection results in long‐term changes in the immune cell compartment, and it is important to determine whether or not these changes impact symptoms experienced by patients with long‐COVID‐19.
FIGURE 6.
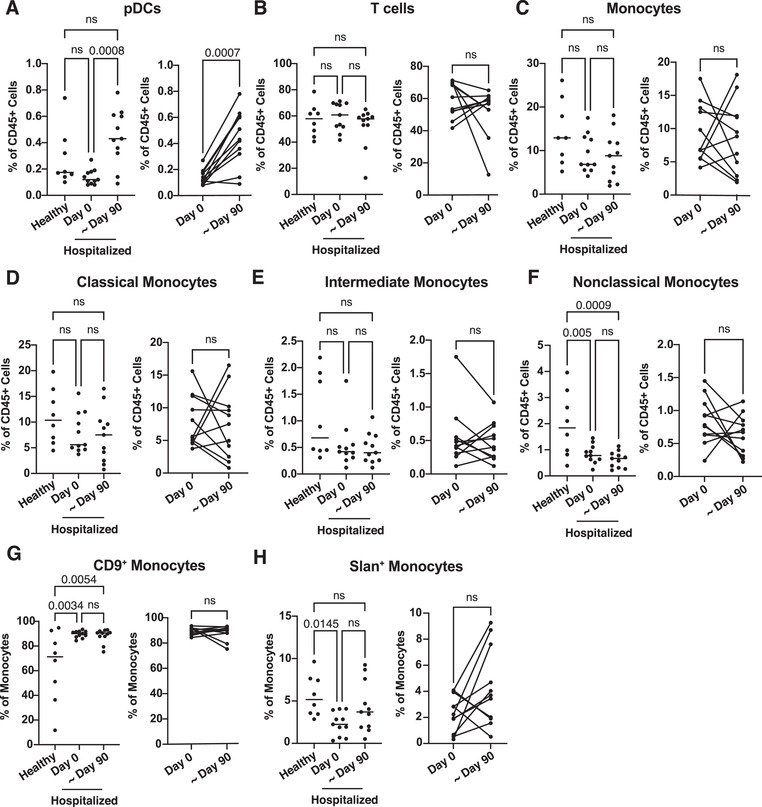
Comparison of immune cell cluster frequencies in hospitalized COVID‐19 patient blood through time and characterization of CD9+ monocyte cytokine release. PBMCs from healthy (n = 8) and SARS‐CoV‐2‐infected hospitalized (n = 11) individuals collected at the initial blood draw plotted in Figure 1(A) (Day 0) or approximately 3 months after initial blood collection (∼Day 90). CyTOF files were gated in Flowjo as shown in Figures S4 and S5. Relative changes in immune cell frequencies between healthy, hospitalized at Day 0 and hospitalized at ∼Day 90 PBMCs were calculated using GLMM and displayed in box and whisker plots (A–H). Statistically significant (p ≤ 0.05) changes calculated using one‐way ANOVA with Tukey's post hoc test for the comparisons between healthy, Day 0 or ∼Day 90 hospitalized subjects or Welch's T‐test for the comparison between only Day 0 or ∼Day 90 hospitalized subjects
Herein, we have generated a detailed picture of how monocytes and DCs are altered after SARS‐CoV‐2 infection of varying severity. Our study could be improved by adding more subjects. However, even with the current number of subjects we had enough statistical power to find significant novel changes in immune cell frequencies and make correlations between disease severity and immune cell subsets. In summary, we identified new cell clusters and markers that we predict contribute to immune response to SARS‐CoV‐2 and could be predictive of disease severity. We also classified CD9 as a marker that can both differentiate between subsets of monocytes and perhaps influence the response to viral infection for the first time. While decreases in nonclassical monocytes have previously been correlated with more severe disease and worse patient outcome, our data identify subsets of nonclassical monocytes that correlate with inflammatory cell death and clotting in hospitalized subjects and are enriched in the hospitalized subjects with the most severe disease. These data reinforce the need for further investigation into the functions of the monocyte subsets detailed here during SARS‐CoV‐2 infection. Finally, these data suggest that changes in nonclassical monocyte and CD9+ monocyte frequencies after SARS‐CoV‐2 infection can be long‐lasting and potentially contribute to long‐COVID‐19 symptoms. We believe these findings can direct future research in the SARS‐CoV‐2 field and lead to better diagnostics and treatment options for both acute and long‐COVID‐19.
AUTHORSHIP
W. J. P. designed and performed experiments, wrote the manuscript, analyzed all data, and generated the figures. L. E. P. designed and performed the experiments and contributed to writing the manuscript. A. A. analyzed all CyTOF data and performed correlational analyses. N. A. G. helped analyze data and generate figures. D. J. A. participated in study design, contributed to writing and editing of the manuscript, and participated in helpful discussions. C. J. H. helped perform experiments and analyze data. C. E. O. assisted with experimental design. H. Q. D. helped with study design and analysis. R. W. assisted with antibody conjugations and CyTOF analysis. P. V. participated in helpful discussions. S. J. C. recruited and cared for patients and obtained blood samples. C. H. O. led the clinical study in the UK, edited the manuscript, and participated in helpful discussions. C. C. H. directed the study and edited the manuscript. W. J. P. and L. E. P. contributed equally to this work.
DISCLOSURE
The authors declare no conflict of interest.
Supporting information
Supplementary Figure 1. Examples of CyTOF batch correction analysis. The density of protein markers CD45 (A), CD3 (B), CD4 (C) and CD14 (D) plotted before and after batch correction.
Supplementary Figure 2. Changes in UMAP cluster proportions by sex and age. Box and whisker plots of the clusters from the UMAP containing all cells (A) or the UMAP containing monocyte and dendritic cells only (B) that compare cluster proportions between donors of different sexes (F = Female, M = Male). Box and whisker plots of the clusters from the UMAP containing all cells (C) or the UMAP containing monocyte and dendritic cells only (D) that compare cluster proportions between donors of different ages (< 50, 50–65 or > 65 years old). Relative changes in immune cell frequencies between sexes were calculated using GLMM. Statistically significant (p ≤ 0.05) changes were calculated using adjusted p‐values after a multiple‐comparisons correction.
Supplementary Figure 3. Changes in T cell subsets and surface marker expression in COVID‐19 subjects. CD3+ CD14– T cell clusters from Fig. 2A were subclustered in a new UMAP (A). Box and whisker plots showing median expression of PD‐1 and the 5 markers that significantly changed in surface expression between conditions (B). Heatmap displaying each subcluster's scaled median expression of 34 markers (C). Box and whisker plots showing changes in cell cluster frequencies as a proportion of all cells included in this subclustering analysis between conditions (D). Statistically significant (p≤0.05) changes were calculated using adjusted p‐values generated after a multiple‐comparisons correction. Changes in cluster frequencies were calculated using GLMM while changes in marker expression were calculated with LIMMA.
Supplementary Table
Supplementary Table
ACKNOWLEDGMENTS
We would like to thank Cheryl Kim and the LJI Flow Cytometry Core for assistance. We also thank Luke Smith for patient recruitment and sample collection, Callum Dixon, Benjamin Johnson, Lydia Scarlett, and Silvia Austin for collection of clinical data, and Céline Galloway, Oliver Wood, Katy McCann, and Lindsey Chudley for sample processing. The Fluidigm CyTOF Helios mass cytometer was supported by 1S10OD018499 (to Shane Crotty, LJI). Dr. Padgett has been supported by T32 AI125279, 19POST34450020, and F32 HL146069‐01A1 (to L. E. P.). This work was supported in part by COVID‐19 supplemental funding through NIH NHLBI P01 HL136275‐S1 (to Dr. Hedrick), the Wessex Clinical Research Network, and National Institute for Health Research UK.
Pandori WJ, Padgett LE, Alimadadi A, et al. Single‐cell immune profiling reveals long‐term changes in myeloid cells and identifies a novel subset of CD9+ monocytes associated with COVID‐19 hospitalization. J Leukoc Biol. 2022;1‐11. 10.1002/JLB.4COVA0122-076R
Additional supporting information can be found online in the Supporting Information section at the end of this article.
REFERENCES
- 1. Dong E, Du H, Gardner L. An interactive web‐based dashboard to track COVID‐19 in real time. Lancet. 2020;20:533‐534. [DOI] [PMC free article] [PubMed] [Google Scholar]
- 2. Guan WJ, Ni ZY, Hu Y, et al. Clinical characteristics of coronavirus disease 2019 in China. N Engl J Med. 2020;382:1708‐1720. [DOI] [PMC free article] [PubMed] [Google Scholar]
- 3. Ren X, Wen W, Fan X, et al. COVID‐19 immune features revealed by a large‐scale single‐cell transcriptome atlas. Cell. 2021;184:1895‐1913.e19. [DOI] [PMC free article] [PubMed] [Google Scholar]
- 4. Arunachalam PS, Wimmers F, Mok CKP, et al. Systems biological assessment of immunity to mild versus severe COVID‐19 infection in humans. Science (80‐). 2020;369:1210‐1220. [DOI] [PMC free article] [PubMed] [Google Scholar]
- 5. Laing AG, Lorenc A, del Molino del Barrio I, et al. A dynamic COVID‐19 immune signature includes associations with poor prognosis. Nat Med. 2020;26:1623‐1635. [DOI] [PubMed] [Google Scholar]
- 6. Schulte‐Schrepping J, Reusch N, Paclik D, et al. Severe COVID‐19 is marked by a dysregulated myeloid cell compartment. Cell. 2020;182:1419‐1440.e23. [DOI] [PMC free article] [PubMed] [Google Scholar]
- 7. Liu C, Martins AJ, Lau WW, et al. Time‐resolved systems immunology reveals a late juncture linked to fatal COVID‐19. Cell. 2021;184:1836‐1857 e22. [DOI] [PMC free article] [PubMed] [Google Scholar]
- 8. Gibellini L, De Biasi S, Paolini A, et al. Altered bioenergetics and mitochondrial dysfunction of monocytes in patients with COVID‐19 pneumonia. EMBO Mol Med 12. 10.15252/emmm.202013001. Epub ahead of print December 7, 2020. [DOI] [PMC free article] [PubMed] [Google Scholar]
- 9. Giamarellos‐Bourboulis EJ, Netea MG, Rovina N, et al. Complex immune dysregulation in COVID‐19 patients with severe respiratory failure. Cell Host Microbe. 2020;27:992‐1000 e3. [DOI] [PMC free article] [PubMed] [Google Scholar]
- 10. Szabo PA, Dogra P, Gray JI, et al. Longitudinal profiling of respiratory and systemic immune responses reveals myeloid cell‐driven lung inflammation in severe COVID‐19. Immunity. 2021;54:797‐814. [DOI] [PMC free article] [PubMed] [Google Scholar]
- 11. Gatti A, Radrizzani D, Vigano P, et al. Decrease of non‐classical and intermediate monocyte subsets in severe acute SARS‐CoV‐2 infection. Cytom A. 2020;97:887‐890. [DOI] [PMC free article] [PubMed] [Google Scholar]
- 12. Silvin A, Chapuis N, Dunsmore G, et al. Elevated calprotectin and abnormal myeloid cell subsets discriminate severe from mild COVID‐19. Cell. 2020;182:1401‐1418. [DOI] [PMC free article] [PubMed] [Google Scholar]
- 13. Sanchez‐Cerrillo I, Landete P, Aldave B, et al. COVID‐19 severity associates with pulmonary redistribution of CD1c+ DC and inflammatory transitional and nonclassical monocytes. J Clin Invest. 2020;130:6290‐6300. [DOI] [PMC free article] [PubMed] [Google Scholar]
- 14. Thomas GD, Hamers AAJ, Nakao C, et al. Human blood monocyte subsets: a new gating strategy defined using cell surface markers identified by mass cytometry. Arter Thromb Vasc Biol. 2017;37:1548‐1558. [DOI] [PMC free article] [PubMed] [Google Scholar]
- 15. Hamers AAJ, Dinh HQ, Thomas GD, et al. Human monocyte heterogeneity as revealed by high‐dimensional mass cytometry. Arterioscler Thromb Vasc Biol. 2019;39:25‐36. [DOI] [PMC free article] [PubMed] [Google Scholar]
- 16. Krychtiuk KA, Lenz M, Richter B, et al. Monocyte subsets predict mortality after cardiac arrest. J Leukoc Biol. 2021;109:1139‐1146. [DOI] [PMC free article] [PubMed] [Google Scholar]
- 17. Combes AJ, Courau T, Kuhn NF, et al. Global absence and targeting of protective immune states in severe COVID‐19. Nature. 2021;591:124‐130. [DOI] [PMC free article] [PubMed] [Google Scholar]
- 18. van der Wijst MGP, Vazquez SE, Hartoularos GC, et al. Type I interferon autoantibodies are associated with systemic immune alterations in patients with COVID‐19. Sci Transl Med. 2021;13. 10.1126/scitranslmed.abh2624. Epub ahead of print. [DOI] [PMC free article] [PubMed] [Google Scholar]
- 19. Meckiff BJ, Ramirez‐Suastegui C, Fajardo V, et al. Imbalance of regulatory and cytotoxic SARS‐CoV‐2‐reactive CD4+ T cells in COVID‐19. Cell. 2020;183:1340‐1353. [DOI] [PMC free article] [PubMed] [Google Scholar]
- 20. Kusnadi A, Ramirez‐Suastegui C, Fajardo V, et al. Severely ill COVID‐19 patients display augmented functional properties in SARS‐CoV‐2‐reactive CD8+ T cells. Sci Immunol. 6. 10.1126/sciimmunol.abe4782. Epub ahead of print 2021. [DOI] [PMC free article] [PubMed] [Google Scholar]
- 21. Zunder ER, Finck R, Behbehani GK, et al. Palladium‐based mass tag cell barcoding with a doublet‐filtering scheme and single‐cell deconvolution algorithm. Nat Protoc. 2015;10:316‐333. [DOI] [PMC free article] [PubMed] [Google Scholar]
- 22. Lun ATL, Richard AC, Marioni JC. Testing for differential abundance in mass cytometry data. Nat Methods. 2017;14:707‐709. [DOI] [PMC free article] [PubMed] [Google Scholar]
- 23. Van Gassen S, Callebaut B, Van Helden MJ, et al. FlowSOM: using self‐organizing maps for visualization and interpretation of cytometry data. Cytom A. 2015;87:636‐645. [DOI] [PubMed] [Google Scholar]
- 24. Ritchie ME, Phipson B, Wu D, et al. Limma powers differential expression analyses for RNA‐sequencing and microarray studies. Nucleic Acids Res. 2015;43:e47. [DOI] [PMC free article] [PubMed] [Google Scholar]
- 25. Bates D, Mächler M, Bolker BM, et al. Fitting linear mixed‐effects models using lme4. 10.18637/jss.v067.i01. Epub ahead of print October 1, 2015. [DOI]
- 26. Freeman BGJ, Long AJ, Iwai Y, et al. Engagement of the PD‐1 immunoinhibitory receptor by a novel B7 family member leads to negative regulation of lymphocyte activation. J Exp Med. 2000;192:1028‐1034. [DOI] [PMC free article] [PubMed] [Google Scholar]
- 27. Latchman Y, Wood CR, Chernova T, et al. PD‐L2 is a second ligand for PD‐1 and inhibits T cell activation. Nat Immunol. 2001;2:261‐268. [DOI] [PubMed] [Google Scholar]
- 28. Brosseau C, Colas L, Magnan A, et al. CD9 tetraspanin: a new pathway for the regulation of inflammation?. Front Immunol. 2018;9:2316. 10.3389/fimmu.2018.02316. Epub ahead of print October 9. [DOI] [PMC free article] [PubMed] [Google Scholar]
- 29. Suzuki M, Tachibana I, Takeda Y, et al. Tetraspanin CD9 negatively regulates lipopolysaccharide‐induced macrophage activation and lung inflammation. J Immunol. 2009;182:6485‐6493. [DOI] [PubMed] [Google Scholar]
- 30. Rocha‐Perugini V, Martinez Del Hoyo G, Gonzalez‐Granado JM, et al. CD9 regulates major histocompatibility complex class II trafficking in monocyte‐derived dendritic cells. Mol Cell Biol. 2017;37. 10.1128/MCB.00202-17. Epub ahead of print. [DOI] [PMC free article] [PubMed] [Google Scholar]
- 31. Rocha‐Perugini V, González‐Granado JM, Tejera E, et al. Tetraspanins CD9 and CD151 at the immune synapse support T‐cell integrin signaling. Eur J Immunol. 2014;44:1967‐1975. [DOI] [PMC free article] [PubMed] [Google Scholar]
- 32. Kischel P, Bellahcene A, Deux B, et al. Overexpression of CD9 in human breast cancer cells promotes the development of bone metastases. Anticancer Res. 2012;32:5211‐5220. [PubMed] [Google Scholar]
- 33. Mann ER, Immunol S, Mann ER, et al. Longitudinal immune profiling reveals key myeloid signatures associated with COVID‐19. Sci Immunol 5. Epub ahead of print 2020. 10.1126/sciimmunol.abd6197 [DOI] [PMC free article] [PubMed] [Google Scholar]
- 34. Saris A, Reijnders TDY, Reijm M, et al. Enrichment of CCR6+CD8+ T cells and CCL20 in the lungs of mechanically ventilated patients with COVID‐19. Eur J Immunol. 2021: 1535‐1538. [DOI] [PMC free article] [PubMed] [Google Scholar]
- 35. Dengel LT, Norrod AG, Gregory BL, et al. Interferons induce CXCR3‐cognate chemokine production by human metastatic melanoma. J Immunother. 2010;33:965‐974. [DOI] [PMC free article] [PubMed] [Google Scholar]
- 36. Loetscher M, Gerber B, Loetscher P, et al. Chemokine receptor specific for IP10 and Mig: structure, function, and expression in activate T‐Lymphocytes. J Exp Med. 1996;184:963‐969. [DOI] [PMC free article] [PubMed] [Google Scholar]
- 37. Hadjadj J, Yatim N, Barnabei L, et al. Impaired type I interferon activity and inflammatory responses in severe COVID‐19 patients. Science (80‐). 2020;369:718‐724. [DOI] [PMC free article] [PubMed] [Google Scholar]
- 38. Sudre CH, Murray B, Varsavsky T, et al. Attributes and predictors of long COVID. Nat Med. 2021;27:626‐631. [DOI] [PMC free article] [PubMed] [Google Scholar]
- 39. Nalbandian A, Sehgal K, Gupta A, et al. Post‐acute COVID‐19 syndrome. Nat Med. 2021;27:601‐615. [DOI] [PMC free article] [PubMed] [Google Scholar]
- 40. Carfi A, Bernabei R, Landi F, et al. Persistent symptoms in patients after acute COVID‐19. JAMA. 2020;324:603‐605. [DOI] [PMC free article] [PubMed] [Google Scholar]
Associated Data
This section collects any data citations, data availability statements, or supplementary materials included in this article.
Supplementary Materials
Supplementary Figure 1. Examples of CyTOF batch correction analysis. The density of protein markers CD45 (A), CD3 (B), CD4 (C) and CD14 (D) plotted before and after batch correction.
Supplementary Figure 2. Changes in UMAP cluster proportions by sex and age. Box and whisker plots of the clusters from the UMAP containing all cells (A) or the UMAP containing monocyte and dendritic cells only (B) that compare cluster proportions between donors of different sexes (F = Female, M = Male). Box and whisker plots of the clusters from the UMAP containing all cells (C) or the UMAP containing monocyte and dendritic cells only (D) that compare cluster proportions between donors of different ages (< 50, 50–65 or > 65 years old). Relative changes in immune cell frequencies between sexes were calculated using GLMM. Statistically significant (p ≤ 0.05) changes were calculated using adjusted p‐values after a multiple‐comparisons correction.
Supplementary Figure 3. Changes in T cell subsets and surface marker expression in COVID‐19 subjects. CD3+ CD14– T cell clusters from Fig. 2A were subclustered in a new UMAP (A). Box and whisker plots showing median expression of PD‐1 and the 5 markers that significantly changed in surface expression between conditions (B). Heatmap displaying each subcluster's scaled median expression of 34 markers (C). Box and whisker plots showing changes in cell cluster frequencies as a proportion of all cells included in this subclustering analysis between conditions (D). Statistically significant (p≤0.05) changes were calculated using adjusted p‐values generated after a multiple‐comparisons correction. Changes in cluster frequencies were calculated using GLMM while changes in marker expression were calculated with LIMMA.
Supplementary Table
Supplementary Table


