

Abstract
Microglia play a role in several central nervous system (CNS) diseases and are a highly sought target for positron emission tomography (PET) imaging and therapeutic intervention. 5-Cyano-N-(4-(4-[11C]methylpiperazin-1-yl)-2-(piperidin-1-yl)phenyl)furan-2-carboxamide ([11C]CPPC) is a radiopharmaceutical designed to selectively target microglia via macrophage colony stimulating factor-1 receptor (CSF-1R) in the CNS. Herein, we report the first preclinical evaluation of [3H]CPPC using radioligand binding methods for the evaluation of putative CSF-1R inhibitors in rodent models of neuroinflammation. Distribution of [3H]CPPC by autoradiography did not align with 18 kDa translocator protein (TSPO) distribution using [3H]PBR28 and IBA-1 staining for microglia. In the CNS, [3H]CPPC had considerable non-specific binding, as indicated by a low displacement of the tritiated ligand by unlabeled CPPC, and the known CSF1R inhibitors BLZ-945 and PLX3397. Spleen was identified as a tissue that provided adequate signal-to-noise to enable screening with [3H]CPPC and a library of 20 novel PLX3397 derivatives. However, unlabeled CPPC lacked selectivity and showed off-target binding to a substantial number of kinase targets (204 of 403 tested) at a concentration relevant to in vitro radioligand binding assays (10 μM). These findings suggest that while [3H]CPPC may have utility as a tool radioligand for the evaluation of peripheral targets and screening of CSF-1R inhibitors, it may have limited utility as an in vivo CNS imaging probe based on the current evaluation.
Keywords: Positron emission tomography, PET, CSF-1R, autoradiography, CPPC, colony stimulating factor 1 receptor, in vitro
Graphical Abstract
Introduction
Macrophage colony stimulating factor-1 receptor (CSF-1R), also referred to as CD-115, is a receptor tyrosine kinase localized to the extracellular membrane of microglia, a small number of neurons, and peripheral macrophages.1–3 In the brain, CSF-1R signaling is mediated by two endogenous ligands: colony stimulating factor-1 (CSF-1) and interleukin-34 (IL-34), contributing to microglial migration, survival and proliferation. 3, 4 CSF-1R signaling is hypothesized to activate and enlist macrophages to a site of injury, 5 making CSF-1R an important therapeutic target. In Alzheimer’s disease (AD), CSF-1R expression is increased6, 7 and studies have shown beneficial effects of CSF-1R inhibition on neurodegeneration and neuroinflammation.8–12 Multiple efforts are ongoing to explore CSF-1R inhibitors in the CNS.
For example, the CSF-1R inhibitor pexidartinib (PLX3397; Turalio) has been approved by the U.S Food and Drug Administration for treatment of tenosynovial giant cell tumors, an illness characterized by peripheral macrophage infiltration. PLX3397 displays a high affinity for CSF-1R (10 nM), two-fold selectivity over c-kit (20 nM) 13, 14 and has been observed in cerebrospinal fluid, albeit at low concentrations, following oral administration indicating brain penetrability in non-human primates.15, 16 A recent phase 1b trial in patients with mild cognitive impairment has been initiated with the CSF-1R inhibitor JNJ 40346527 and results from this are pending completion of the trial (https://clinicaltrials.gov/ct2/show/NCT04121208). An additional CSF-1R inhibitor, BLZ945, is in currently in a phase 2 trial in patients with amyotrophic lateral sclerosis (ALS) (https://clinicaltrials.gov/ct2/show/NCT04066244).
As a result, several efforts have been made to develop a high-affinity and brain-penetrant positron emission tomography (PET) radiotracer that binds preferentially to CSF-1R,14, 17, 18 in order to visualize microglial activation.19–24 The most advanced radiotracer for neuroimaging of CSF-1R is 5-cyano-N-(4-(4-[11C]methylpiperazin-1-yl)-2-(piperidin-1-yl)phenyl)furan-2-carboxamide ([11C]CPPC).2 Preclinical PET studies were carried out in mouse and non-human primate models of neuroinflammation showing specific binding of [11C]CPPC.2 PET imaging in rodent models of CNS disease have included transgenic AD mice and an experimental autoimmune encephalopathy (EAE) model of multiple sclerosis which showed increased brain uptake in relevant brain regions of the disease. The radiopharmaceutical has recently been validated for human use and preliminary human imaging has been performed.25, 26
The present study aims to characterize [3H]CPPC as an in vitro tool for applications in the CNS and periphery and to screen a library of compounds derived from PLX3397 as potential PET imaging probes for CSF-1R. Specifically, preclinical in vitro studies were carried out using [3H]CPPC to: (i) establish distribution of [3H]CPPC in a rat intrastriatal lipopolysaccharide (LPS) and mouse glioblastoma (GL261-Luc; GBM) model of neuroinflammation compared to the 18kDa translocator protein (TSPO) shown by [3H]PBR28 autoradiography (ARG) and IBA-1 immunohistochemistry; (ii) determine the specific binding of [3H]CPPC by ARG using CSF-1R targeting reference compounds in intrastriatal LPS rat brain tissues and intraperitoneal (i.p.) LPS mouse spleen tissues; (iii) compare the target density given by both [3H]PBR28 and [3H]CPPC binding in CNS tissues compared to peripheral tissues; (iv) explore selectivity over CNS targets and kinases and; (v) utilize [3H]CPPC as a tool radioligand to screen novel therapeutics and diagnostic imaging agents in an array of compounds derived from PLX3397.
Results & Discussion
Distribution of inflammatory cells in the CNS with models of neuroinflammation (LPS and glioblastoma).
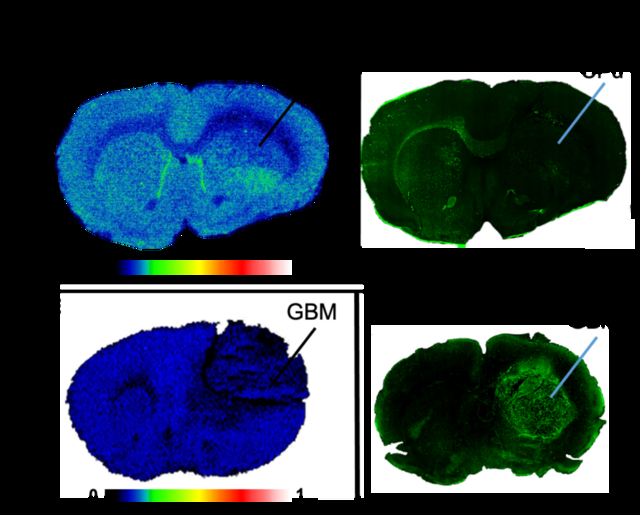
To establish the distribution of binding of [3H]CPPC in the CNS, robust rodent models of focal neuroinflammation were explored with LPS injection in addition to glioblastoma. The rodent models of LPS injection used adult male Sprague-Dawley rats sacrificed either 7-days or 30-days post-unilateral intrastriatal LPS injection (7-day LPS and 30-day LPS injection, respectively). ARG with [3H]CPPC was performed to evaluate distribution of CSF-1R specific binding in 7 (n = 2; Fig. 1A) and 30-days (n = 3). [3H]CPPC (3.5 nM) binding in 7-day post-LPS injection brain tissues showed little-to-no increase in the ipsilateral hemisphere (18.9 ± 1.7 nCi/mg; mean ± sd) compared to the contralateral hemisphere (17.9 ± 1.1 nCi/mg; mean ± sd, Fig. 1A), as well as poor signal-to-noise (49.9 ± 2.9 % inhibition at 10 μM unlabeled CPPC). Representative CSF-1R immunostaining showed clustered target availability on the ipsilateral and contralateral hemispheres in 7-days intrastriatal LPS tissues. CSF-1R immunofluorescence was elevated in the contralateral corpus callosum (Fig. 1B). Under conditions of central LPS-stimulated and GBM tumor-associated inflammation, microglia cells increase.27 As such, a positive relationship with CSF-1R density is expected, however this was not observed via [3H]CPPC ARG.
Figure 1. Distribution of inflammatory cells in LPS and GBM rodent model of neuroinflammation.
[3H]CPPC distribution in intrastriatal LPS rat and GBM mouse model does not align with inflammation as highlighted by [3H]PBR28 autoradiography and IBA-1 immunofluorescence. A) Representative autoradiography image of [3H]CPPC (3 nM) binding density in the ipsilateral caudate putamen unilaterally injected with 4 μL sterile saline containing 50 μg of LPS; Rats were sacrificed 7 days following injection. B) Immunofluorescent staining with an anti-CSF-1R (green) antibody in the 7-day LPS injected rat brain. C) [3H]PBR28 (3 nM) total binding to TSPO and D) IBA-1 immunofluorescence (red) targeting microglia and macrogphages in the 7-day LPS injected rat brain. E) [3H]CPPC (3 nM) total binding in a GBM mouse model. Unilateral injection of human GL251-Luc cells was carried out in mice. GBM sections display tumor burden 19-days after injection of 2.5e6 cells. F) Anti-CSF-1R immunofluorescence (green) within the GBM mouse model brain tissues. G) [3H]PBR28 (3 nM) autoradiography in the GBM mouse model tissues. H) IBA-1 immunofluorescence (red) in the GBM mouse model brain tissue. Intrastriatal (i.s.), Caudate Putamen (CPu; indicated by line, as assessed by anatomic brain atlas for rat); Glioblastoma (GBM; indicated by line as assessed by anti-luciferase immunostaining (data not shown)).
TSPO has been suggested to increase on microglia and macrophages when activated by neuroinflammatory processes. The second generation TSPO-targeting radioligand [3H]PBR28 was used to establish localization of inflammatory cells in LPS and glioblastoma CNS tissues. To support microglia distribution, IBA-1 immunofluorescence was employed. [3H]PBR28 ARG showed robust and reproducible specific binding that was greatly elevated in the ipsilateral hemisphere of rats sacrificed 7-days post-surgery (83.5 ± 48.9 nCi/mg; mean ± sd) and 30-days post-surgery (36.2 ± 4.07 nCi/mg) compared to the contralateral hemisphere of each (29.0 ± 3.1 nCi/mg and 14.0 ± 2.36 nCi/mg, respectively; Fig. 1C). TSPO distribution by [3H]PBR28 aligned with IBA-1 immunostaining for microglia and macrophages in adjacent sections (Fig. 1D) as upregulation of TSPO occurs in these cell types under conditions of neuroinflammation. Albeit, TSPO is also present on other cell types, as it is responsible for cholesterol transport within the outer membrane of the mitochondria.24,28 Immunostaining using an anti-CSF-1R antibody showed localized regions of elevation within the ipsilateral and contralateral hemispheres of injection; however, these regions did not align with [3H]PBR28 and IBA-1 signal. This result may indicate a favorable specific labeling of a subset of the immune cell population by [3H]CPPC in the LPS model, rather than an indication of overall immune cell expression.
Similar to the LPS model, brain tissues of a mouse model of human GBM also display an elevation of neuroinflammatory cells in the area of the tumor. Elevated CSF-1R has previously been reported in immunostaining of human tissue arrays and a rodent GBM model.29, 30 In the present studies, visualization of [3H]CPPC (5 nM) binding was not present in the area of the tumor (Fig. 1E) despite an elevation in CSF-1R immunostaining (Fig. 1F). In contrast, a high [3H]PBR28 specific signal was observed in the region of the tumor and immediately proximal areas (relative target density: 250500 MDC/mm2), corresponding to increased signals from IHC staining of markers for macrophages and microglia (Fig. 1G). Distribution of [3H]PBR28 aligned with IBA-1 immunostaining on adjacent tissue sections (Fig. 1H). By comparison, areas of decreased immunostaining for inflammatory cells exhibited low [3H]PBR28 binding density (620 MDC/mm2). Lack of [3H]CPPC signal in the tumor tissue at a 5 nM concentration suggests a lower affinity than that reported in the literature.2, 21 Concentrations of [3H]CPPC employed in the present assay conditions (3.5 and 5 nM) were approximately 4.5- and 6-fold the reported half maximal inhibitory concentration (IC50; 0.8 nM), respectively. The true binding affinity (Kd) of radiolabeled CPPC in mammalian tissues is yet to be reported via these methods, where Kd is the concentration at which one-half the maximum number of binding sites are occupied. Though impacted by the concentration of radioligand used in the assay, the rationale for using the IC50 concentration serves as a valid approximation of the affinity while also providing adequate counts to elicit an in vitro binding signal. The lack of observed signal present and quantifiable at 5 nM [3H]CPPC suggests the true affinity in innate tissue is likely lower than the IC50 of 0.8 nM reported in non-innate protein target 31. Further evidence is provided by the observation in mouse GBM brain sections that using an 18 nM concentration of [3H]CPPC yields ~60% specific signal as defined using unlabeled 10 μM CPPC (SI Fig. 1). Moreover, [3H]CPPC binding density did not align with the observed distribution of inflammatory cells. PET imaging with [11C]CPPC was able to show increased radioligand uptake and retention in a mouse model of LPS-induced inflammation 2- or 3- days after intracranial injection, however, ex vivo evaluation of radioligand binding in these models did not corroborate the in vivo signal. The inconsistent results between the in vivo and in vitro radioligand binding methods are unlikely to be attributed to physiochemical differences between labeling methods, for example, molar activity.
In contrast, [3H]PBR28 (3 nM) ARG provided a measurable and increased signal in the area of the inflamed cells correlating to increased IBA-1 immunostaining on the ipsilateral hemisphere of LPS injection in both 7-day and 30-day post-LPS rat brain tissues and the GBM mouse model. CSF-1R expression has not been fully characterized within the time-course of intra-striatal LPS injection and the window of elevated receptor density may not align with the timepoints used in these studies. Taken together, this model, under these timepoints may not be optimized for evaluation of [3H]CPPC. However, strong anti-CSF-1R immunofluorescence was observed in the mouse GBM model in the absence of [3H]CPPC signal at an assay concentration above the reported IC50 for CSF-1R.31 It should be noted that a lack of binding in vitro in the presence of robust immunostaining in the GBM tissues may also indicate a difference in receptor conformation post-mortem. Taken together, [3H]CPPC distribution in intrastriatal LPS rat and the GBM mouse model does not align with inflammation as highlighted by [3H]PBR28 autoradiography and IBA-1 immunofluorescence, suggesting that further assessment of [3H]CPPC as a CSF-1R radioligand for CNS applications via saturation binding in neuroinflammatory models was warranted.
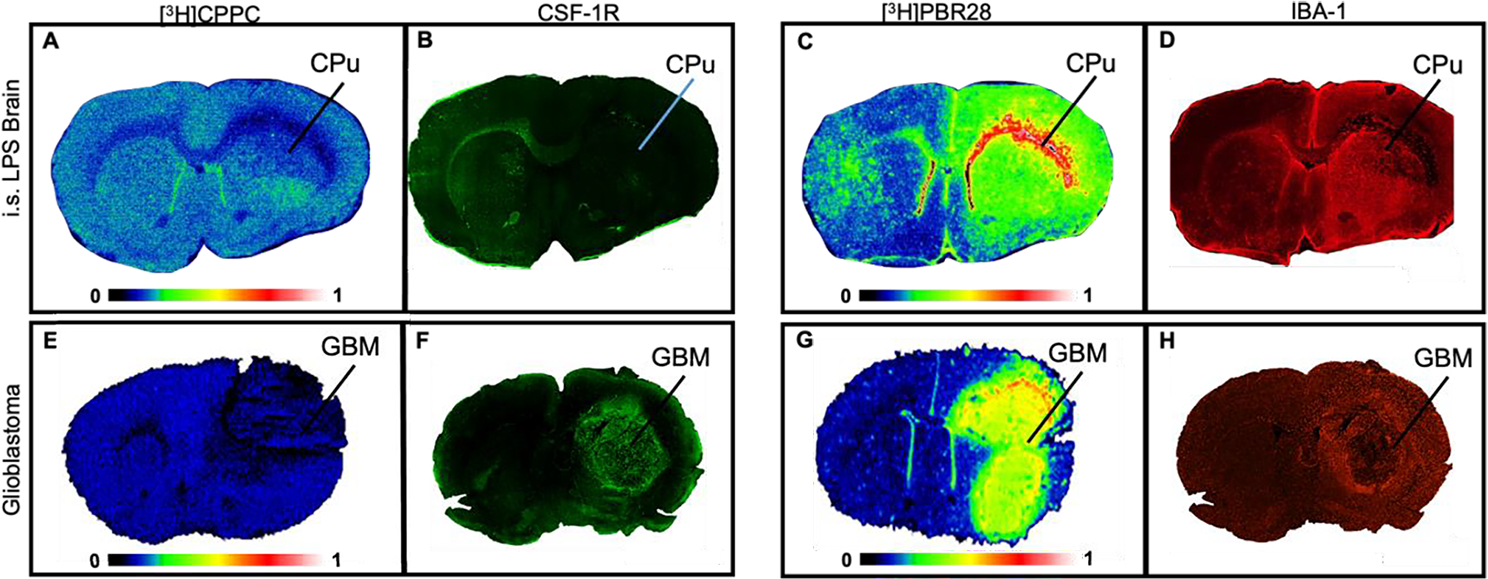
[3H]CPPC saturation binding in models of neuroinflammation.
To further explore the suitability of [3H]CPPC as a tool CSF-1R radioligand, quantitation of target density (Bmax) and Kd of [3H]CPPC to CSF-1R were assessed using saturation binding methods. Under conditions of increasing [3H]CPPC concentration, the specific binding window in brain increased minimally, and in 30-day LPS treatment brain sections, failed to saturate up to a radioligand concentration of 40 nM (Fig. 2A) using the rationale that this is approximately 40-fold above the reported binding affinity and thus an estimate of Bmax. Furthermore, [3H]CPPC binding density did not increase on the ipsilateral compared to the contralateral side of the injection site and in some cases, the contralateral hemisphere displayed higher binding than the side of injury (Fig. 2B). This may be due to the presence of non-specific binding of the radioligand, non-displaceable off-target binding or lack of sufficient target density in this model at this timepoint.
Figure 2. Saturability and distribution under conditions of increasing [3H]CPPC (top) or [3H]PBR28 (bottom) concentration.
[3H]CPPC fails to saturate in the CNS tissues evaluated, where [3H]PBR28 displays successful saturation. A) Non-linear regression fit of bound fmol/mg brain tissue using [3H]CPPC performed by autoradiography analysis in 30-day post-injection intrastriatal LPS rat brain tissues (n = 3). B) Total and non-specific (10 μM CPPC) binding in the ipsilateral and contralateral hemispheres of injection in nCi/mg tissue as determined by region of interest (ROI) analysis using tritium standards. C) Non-linear regression analysis of increasing [3H]PBR28 concentrations in adjacent sections within the 30-day intrastriatal LPS brain tissues. D) Increasing [3H]PBR28 concentrations displaced by 10μM FEPPA to define specific binding in the 7-day and e) 30-day LPS tissues.
[3H]PBR28 was utilized in this work as a control of the radioligand binding techniques employed to characterize CSF-1R targeting PET radioligands due to the favorable specific binding properties of [3H]PBR28. To confirm saturability, increasing concentrations of [3H]PBR28 quantified a Bmax of 620.7 fmol/mg at the ipsilateral hemisphere of the 30-day LPS (Fig. 2C). Total binding of [3H]PBR28 was elevated on the ipsilateral side of injection compared to the contralateral side and non-specific binding defined by 10 μM FEPPA, a TSPO-specific ligand,32 displaced greater than 95% of radioligand binding (Fig. 2D). It is noteworthy that TSPO is present on cell-types beyond microglia.33 Nonetheless, [3H]PBR28 displays low non-specific binding which permits the quantification of Bmax and Kd in this LPS model.
The poor specific binding observed in vitro in the rodent brain tissue with [3H]CPPC prevents an accurate estimate of CSF-1R density in these post-mortem tissues by ARG. Although the LPS model of neuroinflammation has limitations (vide supra), [3H]CPPC binding was observed in these tissues and was displaceable by 10 μM unlabeled CPPC up to 50% in the present conditions. Due to the nature of homologous competition, displacement of specific and non-specific sites of binding can result in skewing of data towards greater inhibition.
Specific binding of [3H]CPPC in the CNS and periphery in models of LPS-induced inflammation.
To further explore specific binding by removing potential artifacts that could distort interpretation of true specific binding, heterologous competition was assessed using structurally dissimilar inhibitors of CSF-1R. In this case, competition of [3H]CPPC (3 nM) was carried out comparing 10 μM CPPC to the same concentration of the small molecule CSF-1R inhibitors PLX3397, PLX5622, and BLZ945. Quantitation of the ipsilateral hemisphere of 30-day LPS tissues shows 15 nCi/mg total binding (Fig. 3A) while CPPC, PLX3397, PLX5622, and BLZ945 inhibited this binding by 60%, 15%, 16%, and 25%, respectively (Fig. 3B). Heterologous binding was expected to produce a lower percentage of inhibition than homologous binding and is consistent with ARG studies performed with [11C]CPPC.2 Though a 60% specific binding window was observed with CPPC, greater than 85% specific binding is preferable for execution of concentration response curves to investigate novel compounds.
Figure 3. Specific binding of [3H]CPPC in intrastriatal LPS rat brain and i.p. LPS mouse spleen.
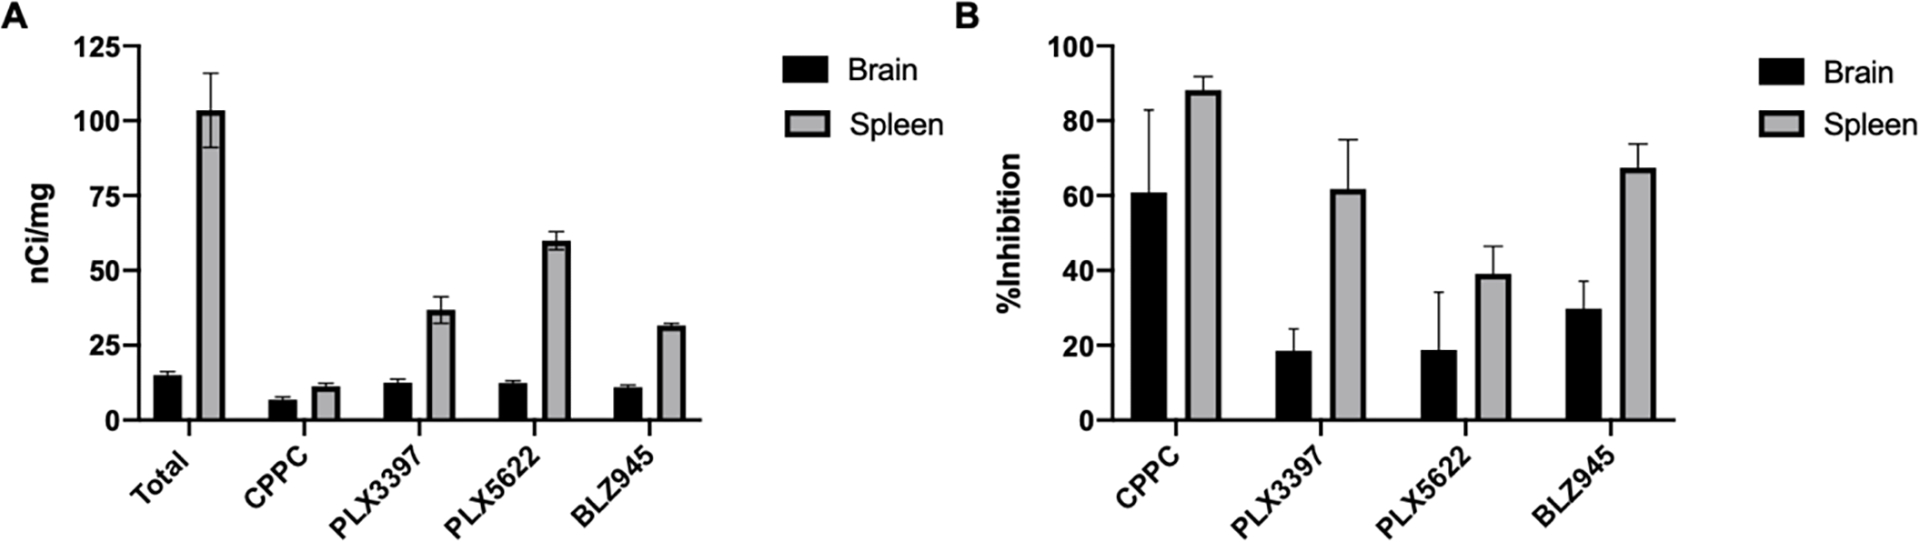
Increased [3H]CPPC signal-to-noise was observed in the i.p. LPS spleen, compared to the intrastriatal LPS rat brain. A) Binding density (nCi/mg tissue) of 3 nM [3H]CPPC in 30-day LPS rat brain tissues (n = 3) and i.p. LPS mouse spleen (n = 6) exposed to an equivalent volume of vehicle (DMSO) or 10 μM final concentration of unlabeled CPPC, PLX3397, PLX5622, or BLZ945. The bar graph displays mean ± sd. B) Percent inhibition of 3 nM [3H]CPPC is displayed as mean ± sd for 10 μM final concentration of unlabeled CPPC, PLX3397, PLX5622, or BLZ945. 100% binding was defined by 3nM [3H]CPPC with vehicle (DMSO)
Due to the challenges of low CSF-1R density and high non-specific binding in the LPS brain tissue, alternative tissues were explored to act as a positive control for CSF-1R expression. Spleen was identified as tissue that possesses numerous peripheral macrophages expressing CSF-1R and these tissues permitted both increased baseline radioligand binding (100 nCi/mg, Fig. 3A) and improved signal-to-noise. [3H]CPPC (3 nM) was inhibited by CPPC, PLX3397, PLX5622, and BLZ945 by 85%, 60%, 40%, and 65%, respectively in an i.p. LPS injection mouse model (n = 6; Fig. 3B). [3H]CPPC and [3H]PBR28 were also evaluated for specific binding in the LPS-treated spleen and the 7-day and 30-day post LPS injected brains under “No-Wash Assay” conditions described by Patel et al 34 (SI Fig. 2). Under these conditions there was a lack of specific binding with [3H]CPPC in all tissues, compared to >60% specific binding of [3H]PBR28 in the same tissues. The poor [3H]CPPC specific binding under these in vitro conditions indicates a poor specific signal would likely be observed in vivo, a factor that was highlighted by Jain, et al. 20 Representative images demonstrate total [3H]CPPC binding and adjacent tissues co-incubated with CPPC, PLX3397, PLX5622, and BLZ945 in both intrastriatal LPS treated brains and i.p. LPS treated mouse spleens (SI Fig. 3), with the improved displaceability by the CSF-1R inhibitors in the spleen compared to the brain tissues. The increased specific binding widow in spleen tissues (>80% inhibition by 10 μM CPPC) is ideal for evaluation of novel CSF-1R targeting compounds. Heterologous binding in spleen displays decreased inhibition compared to homologous binding and is consistent with trends produced in LPS brain tissues. Percent inhibition in LPS brain tissue under these conditions is similar to that reported for [11C]CPPC.2 Using ARG [11C]CPPC binding was assessed in human post-mortem parietal lobe tissue from three AD cases and one control case. In total baseline conditions without removal of non-specific binding, 75–99% increase in [11C]CPPC binding was reported. Evaluation of specific binding of [11C]CPPC signal was carried out using CSF-1R inhibitors, unlabeled CPPC, compound 8, BLZ945, and PLX3397. Inhibition by these compounds was reported as a ratio of total baseline binding to the inhibited condition. The greatest inhibition in AD tissues was observed by unlabeled CPPC (1.7–2.7), followed by compound 8 (2.0 ± 0.23), BLZ945 (1.79 ± 0.88), and PLX3397 (1.25 ± 0.25). Reference compounds targeting CSF-1R have been indicated to present as type II or type I inhibitors binding an unphosphorylated inactive or auto-phosphosphorylated activation-state, respectively 35. This may contribute to the reduced and variable inhibition by the included reference compounds.
Comparison of [3H]CPPC and [3H]PBR28 in spleen tissues.
Binding of [3H]CPPC (Fig. 4A) and [3H]PBR28 (Fig. 4B) at 2 nM radioligand concentration shows displaceable binding in i.p. LPS spleen tissues. Immunofluorescent staining of CSF-1R in the spleen shows target availability. Observed binding density of [3H]PBR28 is elevated compared to [3H]CPPC and saturation analysis was performed to quantify these differences. Unlike brain tissues, [3H]CPPC saturated in spleen from the i.p. LPS mouse model of inflammation. Under conditions of increasing [3H]CPPC concentration, radioligand binding plateaus and calculates a Bmax of 1339 fmol/mg tissue and a Kd of 4.3 nM (Fig. 4D). Adjacent sections of spleen treated with increasing concentration of [3H]PBR28 show saturability and quantified a Bmax of 14771 fmol/mg tissue, a Kd of 2.4 nM (Fig. 4E) and specific binding of 99 ± 0.03% was defined using unlabeled 10 μM FEPPA to carry-out heterologous binding.32 This target density is more than 10-fold higher for TSPO in spleen than CSF-1R, however TSPO is noted in the literature to be expressed on a greater number of cell-types.33
Figure 4. CSF-1R distribution and saturability in i.p. LPS spleen.
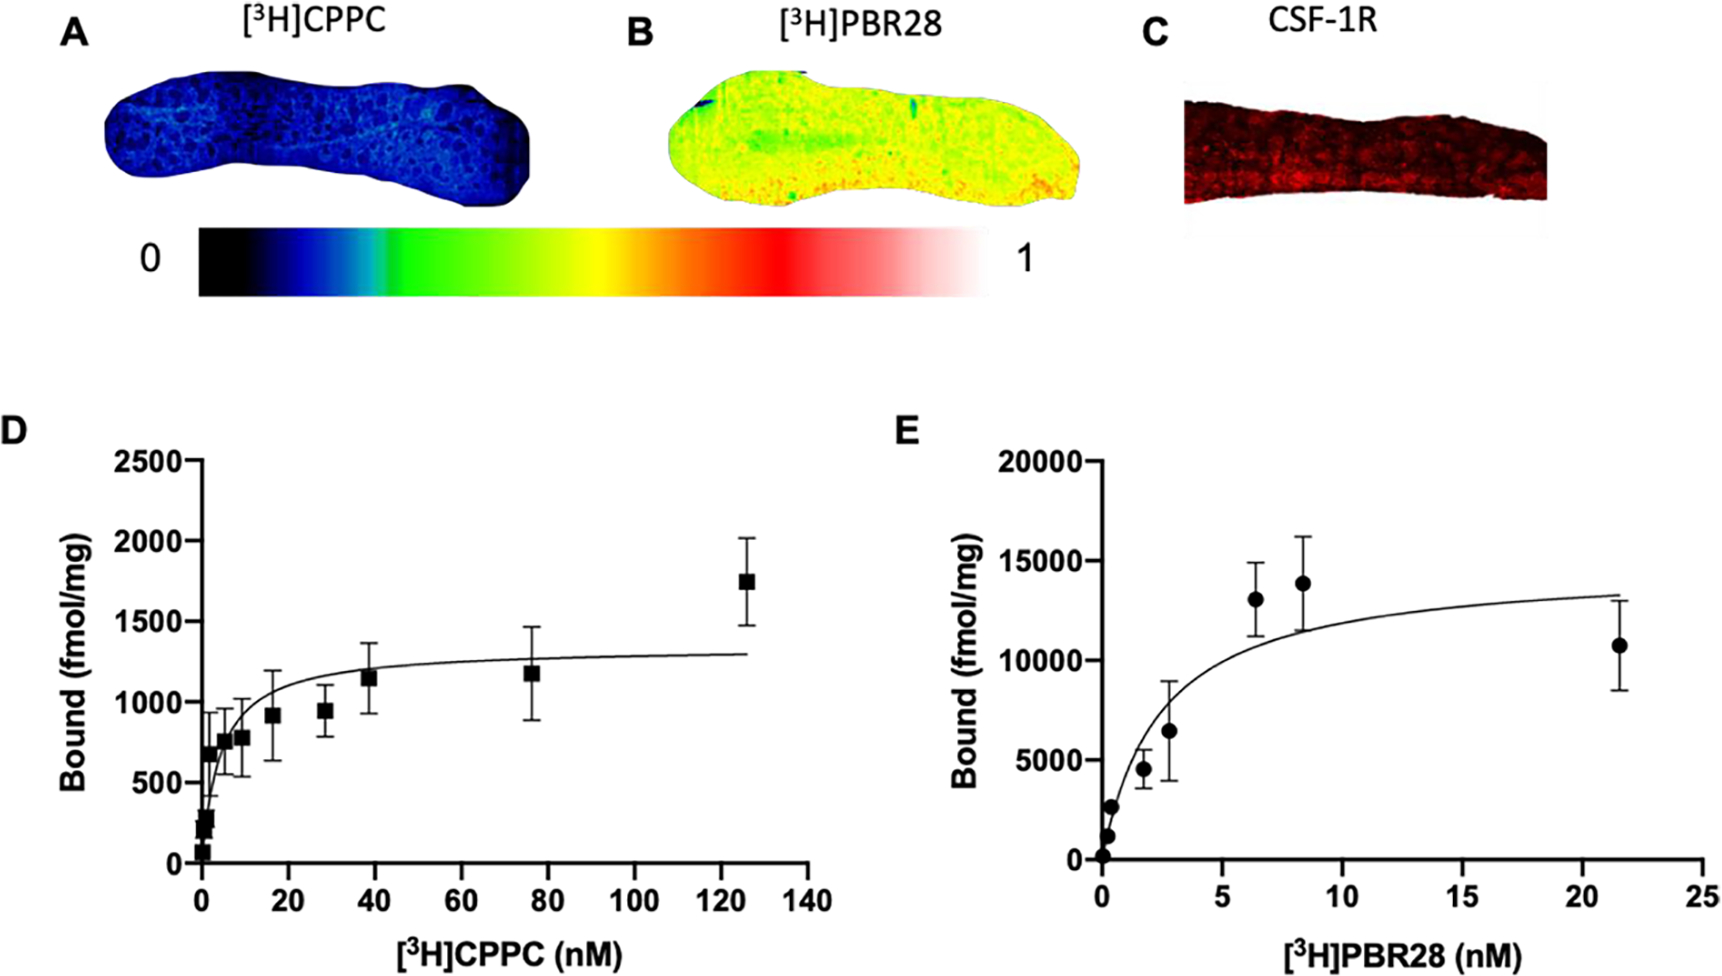
Both [3H]CPPC and [3H]PBR28 display successful saturation in i.p. LPS spleen. Radioligand binding of A) [3H]CPPC (2 nM) and B) [3H]PBR28 (2 nM) in i.p. LPS mouse spleen tissues. C) Immunofluorescent staining of CSF-1R in i.p. LPS mouse spleen tissues. Saturation analysis of D) [3H]CPPC and E) [3H]PBR28 in i.p. LPS spleen tissues.
In vitro screening of CSF-1R targeting compounds in spleen using [3H]CPPC.
To demonstrate the potential application of [3H]CPPC in drug development for neuroinflammation pharmacology, we evaluated an array of 20 derivatives of PLX3397 in spleen tissue, with the goal of identifying a novel high affinity CSF-1R selective compound as a next-generation PET radiotracer. Employing the most promising assay conditions observed, the structural derivatives of PLX3397 (Fig. 5) were investigated by ARG in the i.p. LPS mouse spleen. A concentration of radioligand yielding the highest signal-to-noise ratio was chosen following saturation analysis. A minimal criterion of 80% inhibition was required for a compound to pass the initial screen. Of the 20 PLX3397 derivatives, two compounds (2 and 6) exceeded this initial criterion at a concentration 6.6 nM [3H]CPPC displaced by a 10 μM concentration of each compound. Additionally, compound 1 was minimally below the cut-off criteria (77.5% inhibition) and was included with compounds 2 and 6 for further screening due to the structural ease for tritiomethylation (Fig. 5).
Figure 5. Percent inhibition of [3H]CPPC by PLX3397-derivatives.
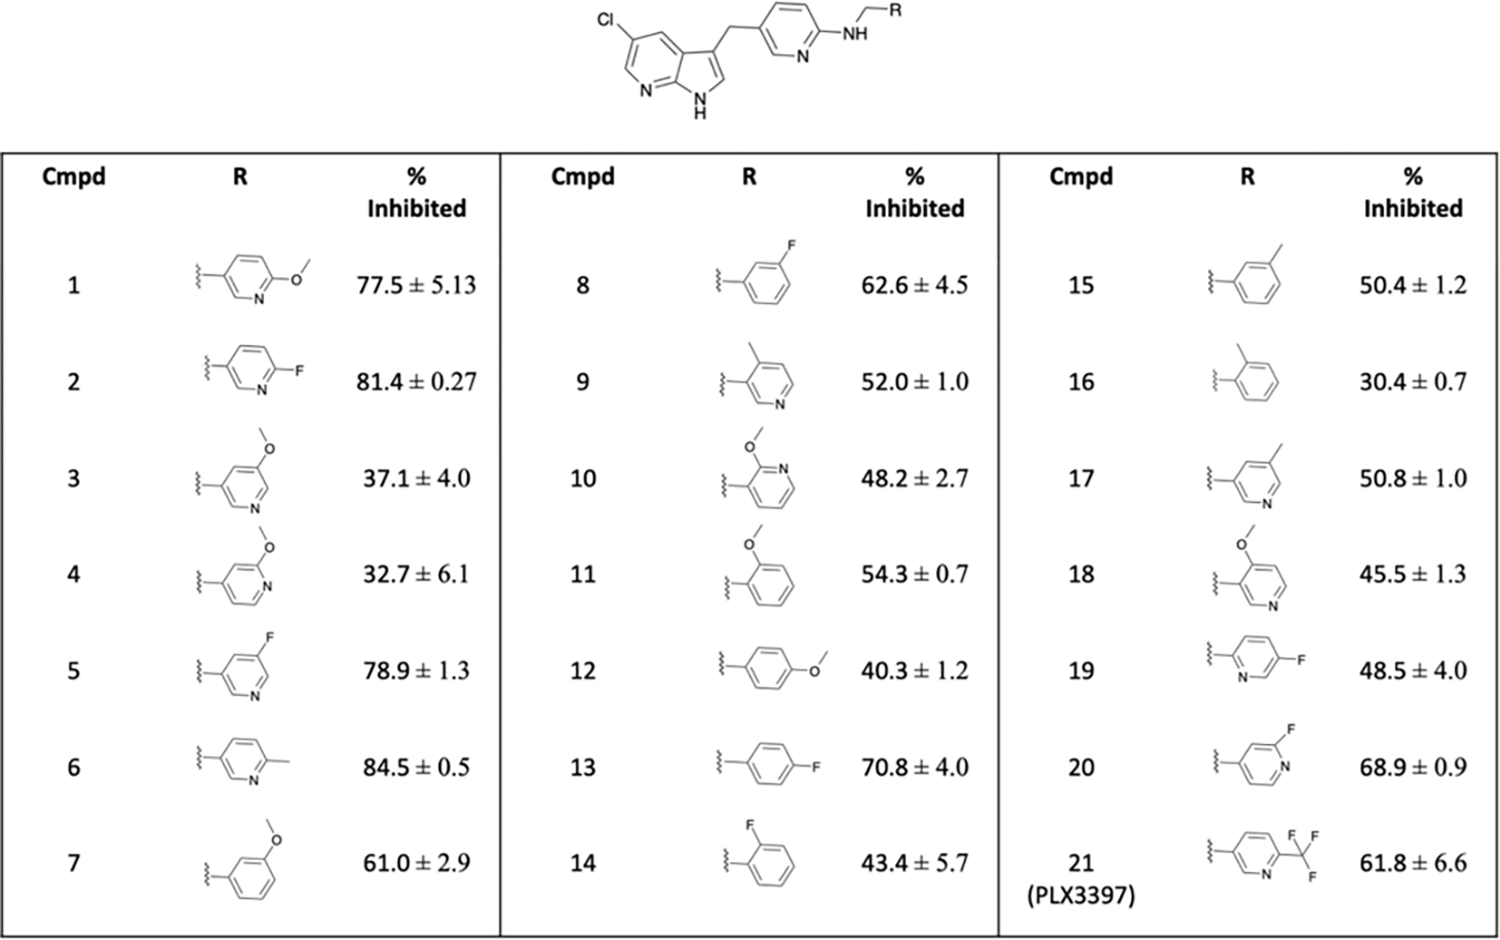
Each value represents mean ± sd of inhibition of each compound in a cross-section of whole i.p. LPS spleen from mouse (n = 6). Baseline binding with vehicle only (DMSO) was used to define 0% inhibition and 10 μM CPPC defined 100% inhibition.
To rank-order the compounds by apparent affinity (Ki), concentration response curves (Fig. 6A) were generated for each compound yielding IC50 values which were converted to apparent affinity (Fig. 6B) using the Cheng-Prussof equation.36 Although the identified leads displayed micromolar Ki values (> 1 μM) for CSF-1R when using [3H]CPPC as a screening tool, compound 1 was chosen for further evaluation due to the mentioned structural ease for tritiomethylation. The assay conditions employed resulted in minimal specific binding in rodent CNS tissues and was determined not useful for further development (SI Fig. 4 and 5).
Figure 6. Concentration response curves of PLX3397-derivatives.
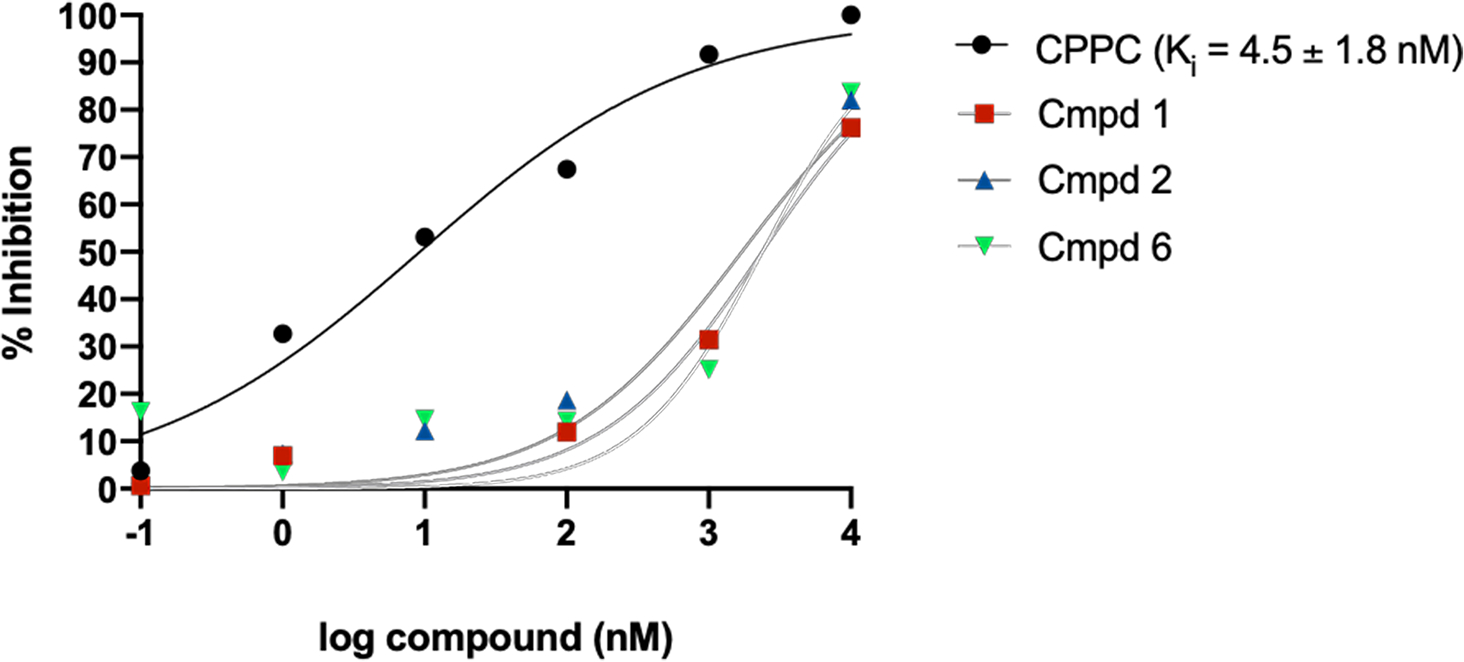
A) Non-linear regression analysis plots percent inhibition of [3H]CPPC binding by increasing concentrations of unlabeled PLX-3397 derivatives 1, 2, and 6 curves. CPPC (10 μM) was used to normalize NS as 100% inhibition and baseline nCi/mg was used to define 0% inhibition. The Cheng-Prusoff equation was used to convert IC50 to Ki. NS – non-specific binding. PLX3397 derivatives (compounds 1, 2 and 6) had Ki >1 μM.
The determined IC50 (9.4 nM) was converted to Ki using the Kd established by saturation binding experiments in i.p. LPS spleen tissues. The Ki (4.5 nM) is approximately 5.6-fold higher than the reported IC50 for CPPC.31 The compounds identified from the PLX3397-derivative library yielded Ki values in the micromolar range, far above the low to sub-nanomolar affinity required for successful PET imaging agents. The hill slope (nH) may be used as an indicator of the number of binding populations with shallow curves sometimes indicating more than one compound-target interaction. Under these conditions, the CPPC concentration curve resulted in a hillslope of 0.46, consistent with multiple binding sites with different affinities for CPPC.
Illig et al. noted off-target binding of CPPC (compound 8) to kinases Kit, Axl, TrkA, Flt-3, and IRKβ at concentrations less than 0.1 μM.31 In light of this potential selectivity concern with CPPC, a scanMAX KINOMEscan™ profile of 403 known kinases (SI Table 1) and a CNS safety panel of 78 known targets (SI Table 2) was solicited (Eurofins DiscoverX Corporation, San Diego, CA, USA). The kinase panels identified a number of off-target kinases at a concentration (10 μM) of unlabeled CPPC relevant to in vitro radioligand binding assays. The Eurofins DiscoverX SAFETYscan identified three CNS targets with IC50 values in the micro-molar range including the serotonin 5-HT3A receptor (5.86 μΜ), α4β2 nicotinic acetylcholine receptor (4.88 μM), and the NAV 1.5 sodium-gated channel (6.51 μM). Expectedly, three kinase hits yielded sub-micomolar IC50 values including an insulin receptor (0.070 μΜ), Tyrosine protein kinase LCK (0.022 μΜ), vascular endothelial growth factor receptor 2 (0.074 μΜ). Based on the IC50 values generated from the CNS safety panel for the three kinase hits, [3H]CPPC used at non-saturating concentrations would not likely confound analysis. Without the affinity values of CPPC to the numerous hits identified by the kinase screen, conclusions pertaining to the selectivity of [11C]CPPC cannot be made from this study. For use as an in vitro radioligand tool for screening putative CSF-1R targeting compounds, where balance of signal-to-noise and using a concentration high enough for detection by the methods employed in these studies, [3H]CPPC was useful in the absence of an alternative 3H-labeled CSF-1R inhibitors, but comes with caveats of potential off-target binding sites. Structure-activity relationships based on CPPC or PLX-3397 should consider off-target binding for PET radiotracer design.
Conclusions
Herein we report the first in vitro evaluation of [3H]CPPC as a tool radioligand in several rodent models of neuroinflammation where both adequate saturability or specific binding were not observed. Non-specific binding of [3H]CPPC was high in normal rodent brain tissue. When compared to TSPO ([3H]PBR28) binding and IBA-1 immunofluorescence, [3H]CPPC did not align with expression of inflammation and appeared to have a lower affinity than previously reported. Because of poor signal-to-noise observed in CNS tissues, saturation binding assays were carried out in LPS-treated spleen tissues. A Bmax of 1339 fmol/mg and a Kd for CSF-1R of 4.3 nM was calculated with [3H]CPPC. Using this in vitro assay system, [3H]CPPC was applied to screen a novel library of CSF-1R inhibitors as potential PET radioligand leads, where the potential for multiple binding sites was observed. The target selectivity of CPPC was then evaluated against 403 kinases and 78 CNS targets, where it was found to inhibit several CNS targets and kinases. Due to the identified off-target binding and low specific binding in the CNS under the employed conditions, [3H]CPPC may not be a suitable tool radioligand for in vitro evaluation of novel CSF-1R targeting compounds.
Materials and Methods
General
Radiolabeled [3H] 5-cyano-N-(4-(4-methylpiperazin-1-yl)-2-(piperidin-1-yl)phenyl)furan-2-carboxamide ([3H]CPPC) (80 Ci/mmol; 1 mCi/mL) was prepared by Novandi Chemistry AB (Södertälje, Sweden) along with reference compound CPPC. When stored at −20 °C in ethanol, the rate of decomposition of [3H]CPPC is less than 3% over the first 6 months, with measurements taken at 2, 4 and 6 months. The experiments were all carried out within the first two months following radiosynthesis. CSF-1R inhibitor and parent compound, 5-((5-chloro-1H-pyrrolo[2,3-b]pyridin-3-yl)methyl)-N-((6-(trifluoromethyl)pyridin-3-yl)methyl)pyridin-2-amine (PLX3397, 21) and tyrosine kinase inhibitor GW2580 were purchased from Cedarlane (Burlington, ON, Canada). LPS was purchased from Sigma-Aldrich (St. Louis, MO, USA). For evaluation of fresh-frozen intrastriatal LPS rat brain tissues, an anti-IBA-1(635)-conjugated antibody was obtained from FUJIFILM Wako. An anti-CSF-1R (SP211) primary antibody was purchased from Abcam (Cambridge, MA, USA) and used in intrastriatal LPS rat brain and I.P.LPS mouse spleen tissues as well as GBM mouse brain tissues.
Compound Synthesis
Potential CSF-1R ligands are shown in SI Fig. 1. Compound structures were derived from the structure 21 and supplied by MedChem Imaging, Inc. (Boston, MA, USA).
Neuroinflammation Models
Rodent models of neuroinflammation were generated in-house under approval of the institutional animal care and use committee. A rat model of acute neuroinflammation was generated by unilateral intra-striatal injection of LPS. Adult male Sprague Dawley rats (n = 5; 250–300 g) were anesthetized and positioned in a stereotactic head frame. Neuroinflammation was induced by a single striatal injection of 50 μg LPS dissolved in 4 μl of sterile saline at a flow rate of 0.5 μl/min. Rats were sacrificed at 7- or 30-days post-injection.
A model of sub-chronic neuroinflammation was generated as previously described by Neal, et al. 11. Adult male C57bl/6 mice (10 weeks) were intraperitoneally (IP) administered 1mg/kg LPS dissolved in normal saline for 3 (n=6) or 4 (n=4) consecutive days and sacrificed on day 5 or 6, respectively.
Glioblastoma Model
A mouse model of glioblastoma was generated by InviCRO, LLC (San Diego, CA). Cells at a concentration of 2.5e6 were injected unilaterally into the striatum. Ten days later MRI was performed to select mice with tumor burden for enrollment into the study. Mice were euthanized 9 days later based on determined MRI tumor volumes and processed for formalin-fixed paraffin-embedded (FFPE) immunohistochemistry. Tissue for ARG were fresh-frozen for analysis.
Tissue Section Preparation
For ARG and immunostaining, rodents were sacrificed, and brains and spleen were slow-frozen in powdered dry ice. Fresh frozen brains were cryosectioned (Leica CM3050S; 10 μm), thaw-mounted on glass slides and stored at −80oC for later use.
Autoradiography
CSF-1R ARG was carried out with modifications in accordance with Horti, et al. 2 To evaluate specific binding, tissues were incubated with 3 nM or 6 nM [3H]CPPC with 10μM reference compound (unlabeled CPPC, PLX3397, PLX5622, BLZ945, GW2580, 6-OH BTA) or vehicle in 100% fetal bovine serum for 2 hours at room temperature. Tissue sections were subsequently washed with 0.5% bovine serum albumin (4°C) and de-ionized water (4°C). Slides were air dried and exposed to phosphorscreens (BAS-IP TR4020; GE Healthcare) for 5 days. Images were generated by scanning with an Amersham Typhoon phosphorimager (GE Healthcare). Region of interest (ROI) analysis was performed using MCID 7.0 imaging suite (Interfocus Imaging, Cambridge UK). Raw nCi/mg, percent specific binding, or percent inhibition are reported. For saturation analysis, tissue sections were incubated with ascending concentrations of radioligand under the same conditions described. Non-specific binding was defined by 10μM CPPC, alone.
Immunofluorescence
Fresh frozen intrastriatal LPS rat tissues were acclimated to room temperature and then exposed to post-fixation by acetone. Formalin-Fixed paraffin embedded GBM brain tissue sections were deparaffinized and underwent antigen retrieval by sodium citrate (pH 6) for 20 minutes. Following a 10-minute wash in wash buffer (tris-HCl buffered saline (TBS) containing 0.1% Triton-X), tissues were exposed to animal-free protein block (Vector laboratories; Burlingame, CA, USA). Tissues were incubated with rabbit anti-IBA-1(635)-conjugated primary antibody (Fujifilm Wako), anti-CSF-1R (SP211; Abcam, Cambridge, MA USA), or antibody diluent overnight at 4°C and then washed with TBS buffer 3× 5 minutes. For CSF-1R detection, a goat anti-rabbit secondary antibody conjugated to Alexa-Fluor-488 was applied at room temperature for 60 minutes. Following washing and 10-minutes incubation with DAPI, slides were washed with distilled water and cover-slipped. Slides were imaged using a Zeiss Axioscan Z.1 (Zeiss, Germany) and an Olympus VS200 (Olympus Corporation, Japan).
Supplementary Material
ACKNOWLEDGEMENTS:
N.V. thanks the National Institute on Ageing of the NIH (R01AG054473 and R01AG052414), the Azrieli Foundation, Canada Foundation for Innovation, Ontario Research Fund, the Canada Research Chairs Program, and Celgene, as well as members of the CAMH Brain Health Imaging Centre for support.
Footnotes
Conflict of interest statement: L.J. and N.V. are co-founders and S.H.L is a consultant of MedChem Imaging, Inc. All other authors declare no conflict of interest.
Supporting Information:
Representative image of specific binding in GBM model at a concentration higher than Kd, graph representing results of a “no wash assay”,34 representative images of brain and spleen displaced with CSF-1R reference compounds, graphical analysis and representative images from studies of 1, 2, and 6 displacing [3H]CPPC, representative images of [3H]1 distribution and displacement, full results of off-target binding screens, CNS MPO for CPPC, and additional Methods.
REFERENCES:
- 1.Obst J; Simon E; Mancuso R; Gomez-Nicola D (2017) The Role of Microglia in Prion Diseases: A Paradigm of Functional Diversity, Front. Aging Neurosci. 2017, DOI: 10.3389/fnagi.2017.00207. [DOI] [PMC free article] [PubMed] [Google Scholar]
- 2.Horti AG; Naik R; Foss CA; Minn I; Misheneva V; Du Y; Wang Y; Mathews WB; Wu Y; Hall A; et al. PET imaging of microglia by targeting macrophage colony-stimulating factor 1 receptor (CSF1R), Proc Natl Acad Sci U S A 2019, 116, 1686–1691. [DOI] [PMC free article] [PubMed] [Google Scholar]
- 3.Stanley ER; Chitu V CSF-1 receptor signaling in myeloid cells, Cold Spring Harb Perspect Biol, 2014, DOI: 10.1101/cshperspect.a021857. [DOI] [PMC free article] [PubMed] [Google Scholar]
- 4.Elmore MR; Najafi AR; Koike MA; Dagher NN; Spangenberg EE; Rice RA; Kitazawa M; Matusow B; Nguyen H; West BL; et al. Colony-stimulating factor 1 receptor signaling is necessary for microglia viability, unmasking a microglia progenitor cell in the adult brain, Neuron, 2014, 82, 380–397. [DOI] [PMC free article] [PubMed] [Google Scholar]
- 5.Tang R; Beuvon F; Ojeda M; Mosseri V; Pouillart P; Scholl S M-CSF (monocyte colony stimulating factor) and M-CSF receptor expression by breast tumour cells: M-CSF mediated recruitment of tumour infiltrating monocytes?, J. Cell Biochem, 1992, 50, 350–356. [DOI] [PubMed] [Google Scholar]
- 6.Akiyama H; Nishimura T; Kondo H; Ikeda K; Hayashi Y; McGeer PL Expression of the receptor for macrophage colony stimulating factor by brain microglia and its upregulation in brains of patients with Alzheimer’s disease and amyotrophic lateral sclerosis, Brain Res, 1994, 639, 171–174. [DOI] [PubMed] [Google Scholar]
- 7.Akiyama H; Barger S; Barnum S; Bradt B; Bauer J; Cole GM; Cooper NR; Eikelenboom P; Emmerling M; Fiebich BL; et al. Inflammation and Alzheimer’s disease, Neurobiol. Aging, 2000, 21, 383–421. [DOI] [PMC free article] [PubMed] [Google Scholar]
- 8.Spangenberg E; Severson PL; Hohsfield LA; Crapser J; Zhang J,;Burton EA; Zhang Y; Spevak W; Lin J; Phan NY; et al. Sustained microglial depletion with CSF1R inhibitor impairs parenchymal plaque development in an Alzheimer’s disease model, Nat. Commun, 2019, 10, DOI: 10.1038/s41467-019-11674-z [DOI] [PMC free article] [PubMed] [Google Scholar]
- 9.Sosna J; Philipp S; Albay R; Reyes-Ruiz JM; Baglietto-Vargas D; LaFerla FM; Glabe CG Early long-term administration of the CSF1R inhibitor PLX3397 ablates microglia and reduces accumulation of intraneuronal amyloid, neuritic plaque deposition and pre-fibrillar oligomers in 5XFAD mouse model of Alzheimer’s disease, Mol. Neurodegener., 2018, 13, DOI: 10.1186/s13024-018-0244-x. [DOI] [PMC free article] [PubMed] [Google Scholar]
- 10.Olmos-Alonso A; Schetters ST; Sri S; Askew K; Mancuso R,;Vargas-Caballero M; Holscher C; Perry VH; Gomez-Nicola D Pharmacological targeting of CSF1R inhibits microglial proliferation and prevents the progression of Alzheimer’s-like pathology, Brain, 2016, 139, 891–907. [DOI] [PMC free article] [PubMed] [Google Scholar]
- 11.Neal ML; Fleming SM; Budge KM; Boyle AM; Kim C; Alam G; Beier EE; Wu L-J; Richardson JR Pharmacological inhibition of CSF1R by GW2580 reduces microglial proliferation and is protective against neuroinflammation and dopaminergic neurodegeneration, FASEB J, 2020, 34, 1679–1694. [DOI] [PMC free article] [PubMed] [Google Scholar]
- 12.Mancuso R; Fryatt G; Cleal M; Obst J; Pipi E; Monzón-Sandoval J; Ribe E; Winchester L; Webber C; Nevado A; et al. CSF1R inhibitor JNJ-40346527 attenuates microglial proliferation and neurodegeneration in P301S mice, Brain, 2019, 142, 3243–3264. [DOI] [PMC free article] [PubMed] [Google Scholar]
- 13.Cannarile MA; Weisser M; Jacob W; Jegg AM; Ries CH; Rüttinger D Colony-stimulating factor 1 receptor (CSF1R) inhibitors in cancer therapy, J Immunother Cancer, 2017, 5, DOI: 10.1186/s40425-017-0257-y. [DOI] [PMC free article] [PubMed] [Google Scholar]
- 14.Tanzey SS; Shao X; Stauff J; Arteaga J; Sherman P; Scott PJH; Mossine AV Synthesis and Initial In Vivo Evaluation of [11C]AZ683-A Novel PET Radiotracer for Colony Stimulating Factor 1 Receptor (CSF1R), Pharmaceuticals (Basel), 2018, DOI: 10.3390/ph11040136. [DOI] [PMC free article] [PubMed] [Google Scholar]
- 15.Shankarappa PS; Peer CJ; Odabas A; McCully CL; Garcia RC; Figg WD; Warren KE Cerebrospinal fluid penetration of the colony-stimulating factor-1 receptor (CSF-1R) inhibitor, pexidartinib. In Cancer Chemother. Pharmacol, 2020, 1003–1007. [DOI] [PMC free article] [PubMed] [Google Scholar]
- 16.Odabas A; McCully CML; Cruz R; Figg WD; Glod J; Rymar A; Peer C; Warren KE Phrm-03. Cerebrospinal fluid penetration of pexidartinib (PLX3397), A CSF1R inhibitor, in a nonhuman primate model, Neuro. Oncol. 2018, DOI: 10.1093/neuonc/noy059.581 [DOI] [Google Scholar]
- 17.Naik R; Misheneva V; Minn I; Melnikova T; Mathews W; Dannals R; Pomper M; Savonenko A; Pletnikov M; Horti A PET tracer for imaging the macrophage colony stimulating factor receptor (CSF1R) in rodent brain, J. Nucl. Med, 2018, 59, 547.29146693 [Google Scholar]
- 18.Bernard-Gauthier V; Schirrmacher R 5-(4-((4-[18F]Fluorobenzyl)oxy)-3-methoxybenzyl)pyrimidine-2,4-diamine: a selective dual inhibitor for potential PET imaging of Trk/CSF-1R. Bioorg. Med. Chem. Lett, 2014, 4784–4790. [DOI] [PubMed] [Google Scholar]
- 19.Narayanaswami V; Dahl K; Bernard-Gauthier V; Josephson L; Cumming P; Vasdev N Emerging PET Radiotracers and Targets for Imaging of Neuroinflammation in Neurodegenerative Diseases: Outlook Beyond TSPO, Mol. Imaging., 2018, 17, DOI: 10.1177/1536012118792317. [DOI] [PMC free article] [PubMed] [Google Scholar]
- 20.Jain P; Chaney AM; Carlson ML; Jackson IM; Rao A; James ML Neuroinflammation PET Imaging: Current Opinion and Future Directions, J. Nucl. Med, 2020, 61, 1107–1112. [DOI] [PMC free article] [PubMed] [Google Scholar]
- 21.Janssen B; Mach RH. Development of brain PET imaging agents: Strategies for imaging neuroinflammation in Alzheimer’s disease. Progress in Molecular Biology and Translational Science; In Brain Imaging, 1st Ed.; Becker JT, and Cohen AD, Ed.; Academic Press, 2019; pp 371–399. [DOI] [PubMed] [Google Scholar]
- 22.Janssen B; Vugts DJ; Windhorst AD; Mach RH PET Imaging of Microglial Activation-Beyond Targeting TSPO, Molecules, 2018, DOI: 10.3390/molecules23030607. [DOI] [PMC free article] [PubMed] [Google Scholar]
- 23.Downer OM; Marcus REG; Zürcher NR; Hooker JM Tracing the History of the Human Translocator Protein to Recent Neurodegenerative and Psychiatric Imaging, ACS Chem. Neurosci., 2020, 11, 2192–2200. [DOI] [PubMed] [Google Scholar]
- 24.Zhang L; Hu K; Shao T; Hou L; Zhang S; Ye W; Josephson L; Meyer JH; Zhang M-R; Vasdev N; et al. Recent developments on PET radiotracers for TSPO and their applications in neuroimaging, Acta Pharm. Sin. B, 2020, 11, 373–393. [DOI] [PMC free article] [PubMed] [Google Scholar]
- 25.Pomper M Imaging brain inflammatory states: Focus on CSF-1R, In Alzheimer’s Drug Discovery Foundation (Medicine N. L. o., Ed.), 2020, Virtual. [Google Scholar]
- 26.Mathews WB; Wu Y; Horti AG; Naik R; Hall AW; Holt DP; Dannals RF Radiosynthesis and validation of [5-cyano-N-(4-(4-[11C]methylpiperazin-1-yl)-2-(piperidin-1-yl)phenyl) furan-2-carboxamide] ([11C]CPPC), a PET radiotracer for imaging CSF1R, a microglia-specific marker, J. Labelled Comp. Radiopharm, 2019, 62, 903–908. [DOI] [PubMed] [Google Scholar]
- 27.Komohara Y; Ohnishi K; Kuratsu J; Takeya M Possible involvement of the M2 anti-inflammatory macrophage phenotype in growth of human gliomas, J. Pathol, 2008, 216, 15–24. [DOI] [PubMed] [Google Scholar]
- 28.Cumming P; Burgher B; Patkar O; Breakspear M; Vasdev N; Thomas P; Liu GJ; Banati R Sifting through the surfeit of neuroinflammation tracers, J. Cereb. Blood Flow Metab, 2018, 38, 204–224. [DOI] [PMC free article] [PubMed] [Google Scholar]
- 29.Sun L; Liang H; Yu W; Jin X Increased invasive phenotype of CSF-1R expression in glioma cells via the ERK1/2 signaling pathway, Cancer Gene Ther, 2019, 26, 136–144. [DOI] [PubMed] [Google Scholar]
- 30.Cho HR; Jeon H; Park CK; Park SH; Choi SH Radiogenomics Profiling for Glioblastoma-related Immune Cells Reveals CD49d Expression Correlation with MRI parameters and Prognosis. Sci. Rep, 2018, DOI: 10.1038/s41598-018-34242-9. [DOI] [PMC free article] [PubMed] [Google Scholar]
- 31.Illig CR; Chen J; Wall MJ; Wilson KJ; Ballentine SK; Rudolph MJ; DesJarlais RL; Chen Y; Schubert C; Petrounia I; et al. Discovery of novel FMS kinase inhibitors as anti-inflammatory agents. Bioorg. Med. Chem. Lett, 2008, 1642–1648. [DOI] [PubMed] [Google Scholar]
- 32.Wilson AA; Garcia A; Parkes J; McCormick P; Stephenson KA; Houle S; Vasdev N Radiosynthesis and initial evaluation of [18F]-FEPPA for PET imaging of peripheral benzodiazepine receptors. Nucl. Med. Biol, 2008, 305–314. [DOI] [PubMed] [Google Scholar]
- 33.Gui Y; Marks JD; Das S; Hyman BT; Serrano-Pozo A Characterization of the 18 kDa translocator protein (TSPO) expression in post-mortem normal and Alzheimer’s disease brains, Brain Pathol,2020, 30, 151–164. [DOI] [PMC free article] [PubMed] [Google Scholar]
- 34.Patel S; Hamill T; Hostetler E; Burns HD; Gibson RE An in vitro assay for predicting successful imaging radiotracers, Mol. Imaging Biol, 2003, 5, 65–71. [DOI] [PubMed] [Google Scholar]
- 35.Wodicka LM; Ciceri P; Davis MI; Hunt JP; Floyd M; Salerno S; Hua XH; Ford JM; Armstrong RC; Zarrinkar PP; Treiber DK Activation State-Dependent Binding of Small Molecule Kinase Inhibitors: Structural Insights from Biochemistry, Chem. Biol, 2010, 17, 1241–1249. [DOI] [PubMed] [Google Scholar]
- 36.Cheng Y; Prusoff WH Relationship between the inhibition constant (K1) and the concentration of inhibitor which causes 50 per cent inhibition (IC50) of an enzymatic reaction. Biochem. Pharmacol, 1973, 3099–3108. [DOI] [PubMed] [Google Scholar]
Associated Data
This section collects any data citations, data availability statements, or supplementary materials included in this article.