

Abstract
Focal liver lesions are commonly encountered. Grey‐scale and Doppler sonographic characteristics of focal liver lesions are often non‐specific and insufficient to conclusively characterise lesions as benign or malignant. Contrast‐enhanced ultrasound is useful for the characterisation of FLLs in patients who are unable to undergo contrast‐enhanced computed tomography or magnetic resonance imaging. It is also easily available and relatively cheap. However, interpretation of contrast‐enhanced ultrasound can be challenging without a systematic approach. In this pictorial essay, we highlight an algorithm‐based approach to FLLs and discuss the characteristic contrast‐enhanced ultrasound features of commonly encountered and clinically significant focal liver lesions.
Keywords: algorithm, contrast, liver neoplasms, ultrasonography
Introduction
Focal liver lesions (FLLs) are commonly encountered in grey‐scale ultrasound, contrast‐enhanced computed tomography (CECT) and contrast‐enhanced magnetic resonance imaging (CEMRI). However, ultrasound lacks specificity in characterisation of solid liver lesions. Other cross‐sectional imaging modalities offer superior diagnostic capability but also have disadvantages such as exposure to ionising radiation and contrast‐induced nephropathy in the context of CECT and nephrogenic systemic fibrosis in patients with end‐stage renal failure on dialysis and acute kidney injury when subject to Gadolinium‐based contrast media. Issues are also faced in patients with claustrophobia and metallic implants/foreign bodies. 1 , 2 And MRI may not be readily accessible in less developed areas.
In patients with contraindication to CT and MRI contrast media, contrast‐enhanced ultrasound (CEUS) can be extremely useful to further investigate FLLs. 3 CEUS has high spatial and temporal resolution, thus allowing for real‐time evaluation of enhancement characteristics in the early arterial phase. If necessary, CEUS also allows repeated injections of ultrasound contrast agent (UCA) in a single examination. In this pictorial essay, we propose a simple and practical algorithm‐based approach to various FLLs on CEUS, and briefly review the characteristic imaging features of various commonly encountered and clinically significant FLLs with clinical examples.
Ultrasound contrast agents
Albunex was the first commercial UCA approved in 1994 by the United States Food and Drug Administration (FDA). SonoVue® was approved in 2001 and 2004 (after withdrawal), now available as Lumason®, followed by Sonozoid®, which was approved in 2007. 4 UCAs consist of a microbubble suspension injected intravenously during CEUS studies. Microbubbles are slightly smaller than red blood cells (about 2.4–2.5 μm), thus allowing them to pass through the pulmonary capillary bed. However, they are comparatively larger than the molecules in iodinated contrast media or gadolinium and, in contrast, do not pass through the endovascular border, remaining strictly intravascular in nature. 5 Two types of UCAs are commonly used for liver CEUS in our institution: SonoVue® (Bracco, Milan, Italy), a purely blood‐pool agent, and Sonazoid® (GE Healthcare, Oslo, Norway), which has the added benefit of a Kupffer phase. 6 , 7 Their differences are summarised in Table 1.
Table 1.
Differences between SonoVue® (Lumason®) and Sonazoid® ultrasound contrast agents
| SonoVue® (Lumason®) | Sonazoid® | |
|---|---|---|
| Diameter | 2.5 μm | 2.4–2.5 μm |
| Composition |
Sulphur hexafluoride (gas core) Phospholipid (shell) |
Perfluorobutane (gas core) Phospholipid (shell) |
| Imaging time | 3–6 min | 10–30 min |
| Producer/Distributor | Bracco Diagnostics, Milano, Italy |
GE Healthcare, Buckinghamshire, UK Daiichi‐Sankyo, Tokyo, Japan |
| Countries Available | US, Europe, China | Japan, South Korea |
Ultrasound contrast agents have gaseous cores of sulphur hexafluoride in SonoVue® and perfluorobutane in Sonazoid® 8 that are stabilised by shells made up of phospholipids, albumin or polymer to prevent the microbubbles from bursting. They are diffused by the lungs at first pass, prolonging its half‐life. This allows for sufficient time to image FLLs. UCAs are metabolised in the liver and excreted via the lungs. 5 As UCAs are not excreted by the kidneys, they can be used safely in patients with impaired renal function. UCAs are well tolerated and have a good safety profile. The incidence of anaphylactoid reactions associated with the use of SonoVue® is much lower (<1%) than that of iodinated contrast (CT). 8 Many of the previously quoted contraindications of UCAs (such as severe pulmonary hypertension, acute coronary syndrome and right‐to‐left shunts) are currently controversial. 9 As SonoVue® contains polyethylene glycol in the excipient (vehicle or inactive ingredient), the use of UCAs is contraindicated in patients with a history of allergy to polyethylene glycol. 10
In this algorithm‐based approach, we have elected to use SonoVue® only. As previously mentioned, Sonazoid® has an additional post‐vascular phase known as the Kupffer phase. During this Kupffer phase (10‐ to 60‐min post‐contrast injection), there is increased contrast between normal liver parenchyma and the FLL, which lacks a reticuloendothelial system. Lesions that do not contain normal hepatic tissue appear as ‘defects’ on the Kupffer phase, both malignant (hepatocellular carcinoma (HCC), intrahepatic cholangiocarcinoma (ICC) and metastases) and benign (cysts, haematoma and abscesses); hence, this additional information has to be interpreted in conjunction with other enhancement characteristics and grey‐scale ultrasound appearances. Hypoechogenicity on the Kupffer phase has high sensitivity and specificity for diagnosis of malignancy. 11 The Kupffer phase even allows for ‘defect reperfusion imaging’ of lesions that are occult on B‐mode US. 12 While these additional characteristics make Sonazoid® helpful to further differentiate and diagnose FLLs, we feel usage of this UCA would be better addressed in a separate algorithm to avoid confusion.
Imaging technique
The evaluation of FLLs should begin with morphological assessment and localisation of the lesion using grey‐scale B‐mode ultrasound. Doppler interrogation is routinely performed in order to exclude a vascular lesion such as an aneurysm. Once the lesion has been identified, the transducer should remain focused on the lesion, while a low mechanical index CEUS protocol (recommended value between 0.08 and 0.3) is turned on. We use a dual‐screen (grey‐scale and harmonics) display because it enables real‐time confirmation of the position of the FLLs during contrast administration. The timer is started immediately after a bolus injection of UCA, followed by a 10 mL normal saline bolus through a 20‐gauge venous cannula set in a large bore vein (preferably in the antecubital fossa). Recording the time during video capture is essential for retrospective review of the dynamic CEUS phases (e.g. arterial, portal venous and late phases). The timing of arterial phase, portal venous phase, and late phase is outlined in Table 2.
Table 2.
Timing of AP, PVP and LP
| AP | PVP | LP | |
|---|---|---|---|
| Starts at | 10–20 s | 30–45 s | >120 s |
| Ends at | 25–35 s | ≤120 s | <3–5 min |
AP, arterial phase; PVP, portal venous phase; LP, late phase.
Algorithm‐based approach to FLLs
Most articles in the current literature discuss the imaging features of FLLs on CEUS in a categorical manner. We propose an algorithmic approach to evaluating FLLs on CEUS, which could be easier to implement in daily clinical practice (Figure 1).
Figure 1.

Algorithm‐based approach to focal liver lesions using SonoVue®. [Colour figure can be viewed at wileyonlinelibrary.com]
We have devised a 3‐step approach to characterise FLLs on CEUS.
First, the arterial phase should be used to categorise the lesion either non‐enhancing, iso‐enhancing, hyper‐enhancing or hypo‐enhancing based on the degree of enhancement of lesions in relation to the background liver parenchyma. Non‐enhancing lesions demonstrate no internal enhancement, though thin wall and septal enhancement is acceptable (e.g. abscess, infected cyst and haematoma can demonstrate these features and may be categorised as non‐enhancing). Iso‐enhancing lesions are defined as lesions that enhance in tandem with the background liver on all CEUS phases. Common iso‐enhancing lesions are focal fatty infiltration/ sparing (pseudolesions) and regenerative nodules (RN). 6 Hypo‐enhancing lesions are defined as lesions that show some arterial enhancement but less than the background liver. Common examples are ICC, metastasis and dysplastic nodules (especially high‐grade dysplastic nodules). If the lesions demonstrate arterial enhancement greater than the background liver, they are considered to be hyper‐enhancing lesions.
Second, the late phase should be assessed before the portal venous phase. We regard the late phase as the most important phase of all the three CEUS phases because it allows broad categorisation of the hyper‐enhancing lesions into either benign or malignant lesions with good degree of specificity. 7 , 13 This approach is also supported by consensus guidelines by the Korean Association for the Study of Contrast enhanced Ultrasonography. 13 Benign lesions are generally iso‐to‐hyper‐enhancing in the late phase; while malignant lesions show washout. 5 , 13 , 14 When assessing washout, it is important to assess both the timing (early vs late) and intensity (marked vs mild). ‘Early’ washout occurs prior to 1 min and is suggestive of non‐hepatocellular malignancies (e.g. ICC and metastasis), whereas ‘late’ washout occurs after 1 min and is suggestive of HCC. ‘Marked’ washout is used when the lesions demonstrate a ‘punched‐out’ appearance relative to the background liver and is suggestive of non‐hepatocellular malignancies, while ‘mild’ washout is seen when residual microbubbles are still visible within the washed out region and is suggestive of HCC. 15
Third, to make the final diagnosis, the pattern of enhancement on the PVP should be reviewed and arterial phase images revisited to pick up typical features (e.g. spoke‐wheel enhancement in focal nodular hyperplasia (FNH) and discontinuous peripheral nodular enhancement in haemangioma). The arterial phase in CEUS has been reported to show high concordance rate with CECT and CEMRI, up to 92%. 6 , 16 Correlation with relevant clinical information such as risk factors of cirrhosis, history of primary malignancy and recent steroid use is vital for making an accurate diagnosis. We leave it to the preference of the reader to either start with clinical information or imaging algorithm (steps 1–3).
Non‐enhancing lesions
Liver cyst, abscess and haematoma
The simple liver cyst is often an unequivocal diagnosis on ultrasound. Simple cysts are well‐defined anechoic lesions with posterior acoustic enhancement in grey‐scale ultrasound. There should be no internal vascularity on Doppler interrogation. However, when liver cysts are complicated by haemorrhage or infection, accurate diagnosis can be difficult as they can mimic solid lesions on ultrasound due to the presence of debris, wall‐thickening or septations. 13 In the complicated cyst, CEUS is extremely useful to exclude any solid enhancing component. If no enhancement is seen, the lesion is almost certainly benign. Typical abscesses usually present as a thin‐walled rim enhancing lesions with a non‐enhancing centre and characteristic ‘honeycomb’ appearance. These features are helpful to differentiate an abscess from malignancy. 17 However, some abscesses have thick enhancing walls that can mimic necrosis in malignancy and would require CT and/or MRI, or even biopsy for diagnosis.
Iso‐enhancing lesions
Focal fatty infiltration or sparing
Focal fatty change is typically seen in classical locations, such as adjacent to the falciform ligament, gallbladder fossa or portal veins. It is believed to be associated with aberrant hepatic venous drainage without portal venous inflow, thus resulting in local haemodynamic anomalies and fat deposition. 18 Focal fatty change can have varied appearances that mimic FLLs on grey‐scale ultrasound. Focal fatty sparing can be considered if a vessel is seen traversing rather than being displaced by the lesion on imaging. The diagnosis can be confirmed with CEUS when the ‘lesion’ is demonstrated to be iso‐enhancing to the background liver parenchyma in all the three phases of imaging (Figure 2). 7 If the diagnosis remains equivocal, chemical shift technique (in‐phase and opposed‐phase) on MRI is usually sufficient to clinch the diagnosis. The areas involved by focal fatty change will demonstrate signal dropout in the opposed‐phase MR images.
Figure 2.

A 73‐year‐old male patient with focal fatty sparing. Grey‐scale ultrasound (a, c) shows a rounded hypoechoic ‘lesion’ adjacent to the gallbladder fossa (arrow). Doppler interrogation (b) reveals no clear internal vascularity. The ‘lesion’ shows similar enhancement to the background liver parenchyma in all the three phases of contrast‐enhanced ultrasound (SonoVue®), that is arterial (d), portal venous (e) and late phase (f), consistent with a focal fatty sparing. The lesion has been stable for 5 years (not shown). [Colour figure can be viewed at wileyonlinelibrary.com]
Regenerative nodules are described under the section of HCC.
Hypo‐enhancing lesions
Commonly encountered hypo‐enhancing liver lesions include ICC and liver metastasis (from primary malignancies of the lung, breast or colon). Since they can also frequently present as rim or diffusely hyper‐enhancing lesions, these two conditions are discussed under the section of ‘hyper‐enhancing’ lesions. The majority of dysplastic nodules are hypo‐enhancing in nature. As precursors of HCC, these lesions are discussed under the HCC section (below).
Hyper‐enhancing lesions
Haemangioma
Haemangiomata are the most common benign lesions in the liver and can be found in approximately 20% of the population. 19 It is a developmental malformation, consisting of blood‐filled vascular sinusoids separated by connective tissue septae. 19 The majority of individuals with haemangiomata are asymptomatic, though lesions larger than 5 cm can potentially rupture. 19 Rarely, hepatic haemangiomata may be associated with syndromes such as Kasabach–Merritt syndrome or Bornman–Terblanche–Blumgart syndrome.
On grey‐scale ultrasound, haemangiomata commonly present as homogeneously hyperechoic lesions. 13 Similar to CECT and MRI, haemangiomata on CEUS classically demonstrate discontinuous peripheral nodular enhancement in the arterial phase, followed by centripetal filling‐in, 13 remaining iso or hyper‐enhancing to the liver parenchyma in the portal venous and late phases. (Figure 3) The specificity of CEUS in the diagnosis of a classic haemangioma is as high as 82%. 20 Haemangiomata, which are complicated by sclerosis or thrombosis, may not demonstrate complete fill‐in after the arterial phase. Regardless, they should not show washout in the later phases.
Figure 3.

A 34‐year‐old female patient with haemangioma. Grey‐scale ultrasound (a) shows a hypoechoic lesion with thin hyperechoic rim in the right lobe of liver (arrow). Contrast‐enhanced ultrasound using SonoVue® in the arterial (b), portal venous (c) and late phases (d, e) demonstrates discontinuous peripheral nodular enhancement with centripetal fill‐in (arrows), consistent with a haemangioma. [Colour figure can be viewed at wileyonlinelibrary.com]
Diagnosis can be challenging on CECT and MRI when the haemangioma shows flash enhancement, or is associated with sclerosis or thrombosis. In flash‐enhancing haemangiomata, real‐time evaluation with CEUS is useful in depicting peripheral nodular enhancement. 13
Focal nodular hyperplasia
Focal nodular hyperplasia (FNH) is the second most common benign liver lesion after haemangiomata. 21 It is a congenital vascular disorder, occurring more frequently in young to middle‐aged individuals, has a female predilection (up to 80% of cases) 19 and is often discovered incidentally. Focal nodular hyperplasia is believed to be the result of a repair mechanism due to previous vascular injury, and it is histologically characterised by normal hepatocytes with malformed bile ducts. 22 , 23 The classical FNH has a central stellate scar containing a large central artery and branching fibrous septae, which contain small branching vessels.
Grey‐scale ultrasound features of FNH are non‐specific (can be hypoechoic, isoechoic or hyperechoic to background hepatic parenchyma). 13 Anecdotally, FNH has been isoechoic to the liver. CEUS is diagnostic when the pathognomonic ‘spoke‐wheel’ sign is seen, comprising of a central enhancing artery with radiating vessels to the periphery. 13 , 24 The rapid centrifugal pattern of enhancement 13 can be easily missed when observing enhancement in real time, and thus, reviewing the AP's cine images is important (Figure 4). As with other benign FLLs, FNH is hyper‐to‐iso‐enhancing in the late phase of CEUS with no appreciable washout except for possible small central stellate scar.
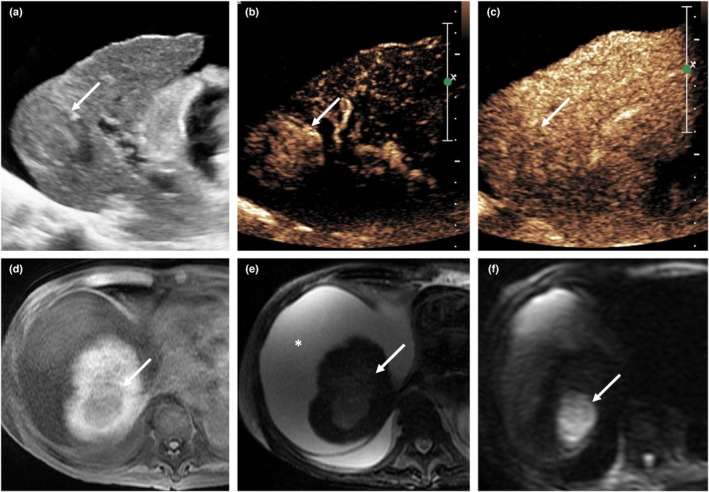
Figure 4.

A 48‐year‐old female patient with FNH. Grey‐scale ultrasound (a) shows an isoechoic mass in left lobe of liver (arrow), measuring approximately 5 × 4 cm in size. On contrast‐enhanced ultrasound (Sonozoid®), the mass demonstrates ‘spoke‐wheel’ sign on the arterial phase (b), centrifugal pattern of enhancement on the portal venous phase (c) and iso‐enhancement to background liver on the Kupffer phase (d), consistent with FNH. On MRI, there is presence of uptake of contrast (Primovist®) on the 20‐min T1‐weighted hepatobiliary phase (e). FNH, focal nodular hyperplasia. [Colour figure can be viewed at wileyonlinelibrary.com]
Hepatic adenoma
Hepatic adenoma (HA) is a rare benign tumour in the liver, with about 5–10% risk of malignant transformation in beta‐catenin subtypes. 25 It commonly occurs in young females with more than 2–5 years of oral contraceptive pill use and may also be associated with anabolic steroid use and some congenital abnormalities. 13 , 25 The clinical presentation is often non‐specific, with abdominal discomfort being the most common symptom, followed by early satiety and nausea. 19
There are four subtypes of HA, which are better differentiated using MRI. These subtypes are classified on the basis of genetic and pathological analysis: inflammatory/telangiectatic (45–50%), hepatocyte nuclear factor 1 alpha (HNF‐1⍺) (30–35%), β‐catenin‐mutated (10–15%) and unclassified (5–10%) HA. 25 The different subtypes tend to show different imaging features on MRI and are associated with different complications. For example, inflammatory/telangiectatic subtype of HA may display the characteristic ‘atoll sign’ (characterised by T2‐weighted hyperintense rim around the lesion in MRI). This subtype is associated with risk of bleeding and 10% risk of malignant transformation. HNF‐1⍺ subtype usually contains intratumoral fat and is not believed to carry malignant potential. The β‐catenin‐mutated subtype is often found in men and associated with glycogen storage disease, and carries approximately 5–10% risk of malignant transformation to HCC. 25 The last subtype (unclassified) is poorly understood and lacks any specific genetic abnormality or specific imaging features.
The grey‐scale and Doppler ultrasound features of HA are again non‐specific. 19 Due to variable haemorrhagic content, HA can present with increased echogenicity on grey‐scale ultrasound. In CEUS, HA shows a centripetal pattern of enhancement, due to the higher density of multiple arteries at the periphery of lesion. 13 In the late phase of CEUS, HA can show either iso‐enhancement or mild washout (Figure 5). Iso‐enhancement is attributed to the microbubbles retained in the sinusoids of the lesion, whereas mild washout in some HAs can be explained by the lack of portal venous supply since the lesions are predominantly fed by arterioles. 13 , 20
Figure 5.
A 48‐year‐old male patient with HA. Grey‐scale ultrasound (a) demonstrates a 4.6 cm hypoechoic mass in the right lobe of liver (arrow). On contrast‐enhanced ultrasound (SonoVue®), the mass shows early stippled enhancement (no spoke‐wheel sign) which then enhances homogeneously in the arterial phases (b, c) without washout in the PVP (d) and remains iso‐enhancing to background liver in late phase (e). On MRI liver (Primovist), the mass shows hypointense signal in T2‐weighted image (f), fairly homogeneous arterial enhancement (g) and iso‐enhancement in the PVP (h). The lack of uptake of hepatobiliary‐specific contrast agent (i) is suggestive of a HA, which was subsequently confirmed on histopathology. PVP, portal venous phase; HA, hepatic adenoma. [Colour figure can be viewed at wileyonlinelibrary.com]
If the diagnosis of HA cannot be confidently made with CEUS, further evaluation with a CEMRI liver using hepatobiliary‐specific contrast agent is required. In the absence of a confident imaging diagnosis, and given the risks of malignant transformation in inflammatory and β‐catenin‐mutated subtypes, biopsy should be considered. The differences of FNH and HA are briefly summarised in Table 3.
Table 3.
Differences between FNH and HA
| FNH | HA | ||
|---|---|---|---|
| Clinical |
Young to middle‐aged adults Asymptomatic |
Young female patient with history of oral contraceptive pill use Abdominal discomfort is common Risk of bleeding and development of HCC |
|
| CEUS | AP |
Spoke‐wheel sign (i.e. stellate artery) Centrifugal enhancement |
Centripetal enhancement Diffuse enhancement |
| PVP/LP | Iso‐to‐hyper‐enhancement (except for the central scar) | Iso‐enhancement (can show ‘mild’ washout) | |
AP, arterial phase; CEUS, contrast enhanced ultrasound; FNH, focal nodular hyperplasia; HA, hepatic adenoma; HCC, hepatocellular carcinoma; LP, late phase; PVP, portal venous phase.
Hepatocellular carcinoma
Hepatocellular carcinoma (HCC) is the most common primary malignancy in the liver. 26 Globally, approximately 782,000 cases were reported in 2012, with 83% of the cases diagnosed in less developed countries. 27 The main risk factors are hepatitis B virus (HBV) (with or without cirrhosis), hepatitis C virus (HCV) and chronic alcohol consumption with cirrhosis. 14 There is also a recent rising trend of Non‐alcoholic steatohepatitis (NASH)‐related cirrhosis and HCC. 28 In patients with risk factors for HCC, a liver lesion that is more than 1 cm, with arterial phase hyper‐enhancement and washout appearance on CT/MRI is diagnostic of HCC based on multiple consensus guidelines. 14 If the alpha fetoprotein (AFP) is elevated (more than 400 nm/mL) or shows an increasing trend, the diagnostic confidence for HCC is further increased. However, it is important to be aware that about 20% of patients with HCC can have normal AFP levels. 13
Hepatocellular carcinoma has variable grey‐scale and Doppler ultrasound appearances. 19 The role of CEUS emerges in situations where CECT and CEMRI are contraindicated due to renal impairment or if the patient is allergic to CT/MRI contrast media. CEUS can also serve as a problem‐solving tool in lesions that remain inconclusive after CECT or CEMRI. 14
On CEUS, progressed HCCs show non‐rim APHE due to the abnormally increased arterial neovascularisation. This is followed by late mild washout in the late phase 13 , 14 (Figure 6). Furthermore, real‐time imaging in CEUS is able to detect arterial hyper‐enhancement in HCC, which is often missed on CECT and CEMRI due to mistiming of the arterial phase. 13 A small subset of HCCs (e.g. early or well differentiated HCC) may exhibit atypical CEUS features such as hypovascularity on the arterial phase and lack of contrast washout due to different degrees of cellular differentiation. They may mimic a dysplastic or RN. 13 Conversely, poorly differentiated HCC may also demonstrate early (within 60 s of contrast administration) and marked washout which can be confused with non‐HCC malignancies such as cholangiocarcinoma or metastasis.
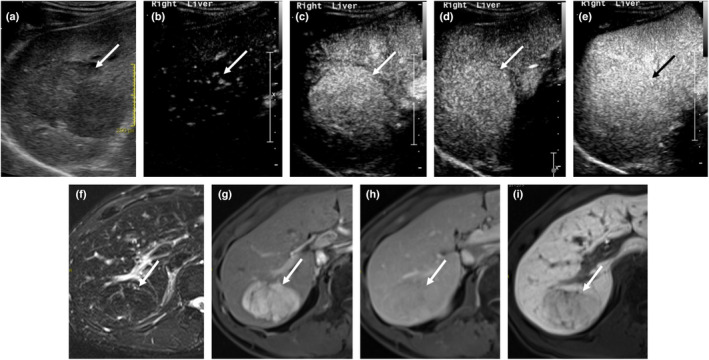
Figure 6.
A 81‐year‐old male patient with background cirrhosis, renal impairment and HCC. Grey‐scale ultrasound (a) demonstrates a hypoechoic lesion in segment 7 of a cirrhotic liver (arrow). The presence of ascites suggests associated portal hypertension. Contrast‐enhanced ultrasound (CEUS) (SonoVue®) reveals hyper‐enhancement (arrow) in the arterial phase (b) and washout (arrow) in the late phase (c), compatible with HCC. On MRI, the lesion shows hypointense signal (arrow) in the T1‐weighted image (d), intermediate signal in the T2‐weighted image (e) and restricted diffusion in the DWI image (f). Non‐contrast MRI liver was performed due to the patient's impaired renal function. CEUS provided vital information. CEUS, contrast‐enhanced ultrasound; HCC, hepatocellular carcinoma. [Colour figure can be viewed at wileyonlinelibrary.com]
The Liver Imaging Reporting and Data System (LIRADS) now recommends CEUS as an accepted imaging modality to risk stratify FLLs in patients at risk of HCC. 29 A lesion at least 1 cm in size with typical imaging characteristics of HCC is assigned to the CEUS LR‐5 category. The different LIRADS categories based on CEUS are summarised in Table 4. 29
Table 4.
Liver imaging reporting and data system (LIRADS) 27
| APHE | No APHE | APHE | ||
|---|---|---|---|---|
| Size | <20 mm | ≥2 mm | <10 mm | ≥10 mm |
| No WO | CEUS LR‐3 | CEUS LR‐3 | CEUS LR‐3 | CEUS LR‐4 |
| Late and mild WO | CEUS LR‐3 | CEUS LR‐4 | CEUS LR‐4 | CEUS LR‐5 |
APHE, arterial phase hyper‐enhancement; CEUS, contrast‐enhanced ultrasound; LR, LIRADS category; WO, washout. The significance for color values helps to categorize visually (CEUS LR3 yellow; CEUS LR4 orange; CEUS LR5 red).
Regenerative nodules and DNs are cirrhosis‐associated nodules. They are also known as pre‐malignant nodules. RNs, which still contain the normal hepatic arterial and portal venous supply, demonstrate iso‐enhancement to the background liver parenchyma in all phases of CEUS. A majority of dysplastic nodules show hypo‐enhancement in the arterial phase. The higher the grade of dysplasia, the more likely the enhancement of the nodules will deviate from that of the liver parenchyma. 6 The different enhancement patterns of HCC, RN and DN are briefly summarised in Table 5.
Table 5.
Different enhancement patterns of HCC, DN and RN
| HCC | DN | RN | ||
|---|---|---|---|---|
| Clinical |
HBV with or without cirrhosis HCV Chronic alcoholism with cirrhosis |
|||
| CEUS | AP | Arterial enhancement | Hypo‐enhancement | Iso‐enhancement |
| PVP/LP | Late mild washout | Hypo‐enhancement | Iso‐enhancement | |
| Atypical |
Hypovascular (on AP) Lack of washout (on PVP/LP) |
|||
AP, arterial phase; CEUS, contrast‐enhanced ultrasound; DN, dysplastic nodule; HBV, hepatitis B virus; HCC, hepatocellular carcinoma; HCV, hepatitis C virus; LP, late phase; PVP, portal venous phase; RN, regenerative nodule.
Intrahepatic cholangiocarcinoma
Intrahepatic cholangiocarcinoma is an adenocarcinoma that arises from the epithelium of the bile ducts, 19 representing 20% of primary liver neoplasms. 30 It occurs more commonly in elderly men (mean age of 65 years) and is believed to be predisposed by chronic inflammatory processes, such as primary sclerosing cholangitis, recurrent pyogenic cholangitis, cirrhosis, choledochal cysts and Caroli disease. 19 , 31 Patients with ICC usually present with constitutional symptoms such as loss of weight and appetite. 31 Painless, progressive jaundice can be seen in some patients if the mass causes biliary obstruction. Tumour markers such as CA 19–9, carcinoembryogenic antigen and AFP may be elevated, but CA 19–9 has the highest sensitivity (89%) and specificity (86%) for ICC. 32
Grey‐scale ultrasound features of ICC are not specific. It may present as an isoechoic or hypoechoic nodule (when small in size) or a heterogeneous mass (when it is larger in size). 11 If a lesion occurs in a patient with intrahepatic biliary ductal dilatation and capsular retraction, without known history of primary malignancy, ICC should be suspected. 31
In the arterial phase of CEUS, ICC can demonstrate rim‐like hyper‐enhancement, 13 which subsequently shows early marked washout in the portal venous and late phase (Figure 7). This is contrary to the enhancement pattern seen on CEMRI and CECT, where ICCs typically show prolonged delayed enhancement. This is because, unlike gadolinium and iodine‐based contrast media in CT/MRI studies, which diffuse into the interstitium of tumours in the late phase, 6 , 13 CEUS contrast agents that remain entirely within the blood‐pool. The early marked washout pattern of ICC may make them indistinguishable from metastases (similar diagnostic challenges are encountered in CT/MRI) and will require histology for confirmation.
Figure 7.
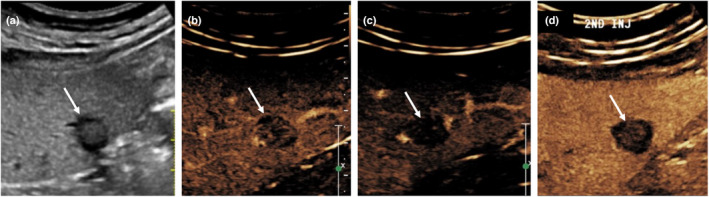
A 52‐year‐old male patient with intrahepatic cholangiocarcinoma (ICC). Grey‐scale ultrasound (a) shows a solitary hypoechoic lesion in a non‐cirrhotic liver. On contrast‐enhanced ultrasound (SonoVue®), it shows early arterial enhancement (b), rapid, strong washout (c) and hypo‐enhancing in the late phase (d). Note that the ‘apparent’ central enhancement in (d) is likely due to by the non‐linear artefact from the echogenic central portion of the tumour which has been present on the grey‐scale image (a). Biopsy of this lesion shows adenocarcinoma. In the absence of primary malignancy elsewhere in the body, the lesion is suspicious for primary ICC. [Colour figure can be viewed at wileyonlinelibrary.com]
Liver metastases
The liver is the most common organ involved in metastatic disease, postulated to be due to high blood inflow from both the hepatic artery and portal vein supply. 33 Common primary malignancies, which metastasise to the liver, arise from the lungs, breast, colon and pancreas. 19 They usually present as multiple lesions (in 80% of cases) compared to a solitary lesion (in 20%). 20 The majority of liver metastases are hypovascular (about 85–90%), while hypervascular metastases account for 10–15% of cases. 34
The vascularity of a metastatic lesion determines its appearance on CEUS. Liver metastases on CEUS can present as peripheral rim or diffuse enhancement in the arterial phase. 13 The peripheral ‘rim’ enhancement is often due to the transient central hyper‐enhancing component which washes out early, which can occur in approximately 53% of the initial diffusely enhancing lesions, typically seen at approximately 30–60 s after the administration of UCA. 14 The different enhancement patterns on CEUS can also be attributed to the proportion of extracellular and intravascular spaces in these lesions. 35 The washout depicted by liver metastases is described as early and marked washout, as opposed to late and mild washout in HCC 13 (Figure 8). In MRI, the ‘peripheral washout’ sign is reported to have a high specificity for hepatic metastases (as high as 100%). 36
Figure 8.

A 65‐year‐old male patient with adenocarcinoma liver metastasis from primary lung malignancy. Unenhanced CT of the abdomen (a) shows a hypoattenuating lesion in segment 6 of the liver (arrow). Due to impaired renal function, the patient was unable to receive intravenous iodinated contrast media; thus, CEUS was performed. (b) The lesion is hypoechoic on grey‐scale ultrasound (arrow). On CEUS (SonoVue®), the lesion shows diffuse arterial enhancement (c), rapid washout (d) and hypo‐enhancement in the late phase (e), suspicious for liver metastasis. The lesion is confirmed to be adenocarcinoma on histology, with mucinous features from the lung primary. CEUS, contrast‐enhanced ultrasound. [Colour figure can be viewed at wileyonlinelibrary.com]
Other rare FLLs such as angiomyolipoma and haemangioendothelioma can mimic HCC and ICC/metastasis, respectively. The detailed description of these lesions is beyond the scope of this paper.
Conclusion
Contrast‐enhanced cross‐sectional imaging is often required for the evaluation of focal liver lesions. In patients who are unable to undergo contrast‐enhanced computed tomography or contrast‐enhanced magnetic resonance imaging, contrast‐enhanced ultrasound can be a useful alternative imaging modality. We present an algorithm‐based approach to assist the radiologist in reaching an accurate diagnosis when assessing focal liver lesions with contrast‐enhanced ultrasound.
Author contributions
K.S. conceptualised the study. H.M., R.L., T.C., A.L. and C.H. supervised the study. K.S., C.Y., H.M., R.L., T.C., A.L. and C.H. validated the document. K.S., C.Y., H.M., A.L. and C.H. involved in visualisation. K.S., C.Y., H.M., T.C., A.L. and C.H. wrote original data, and reviewed and edited the manuscript. All authors have read and approved the final manuscript.
References
- 1. Leow KS, Wu YW, Tan CH. Renal‐related adverse effects of intravenous contrast media in computed tomography. Singap Med J 2015; 56: 186–93. [DOI] [PMC free article] [PubMed] [Google Scholar]
- 2. Morris MF, Zhang Y, Zhang H, Prowda JC, Silvers DN, Fawwaz RA, et al. Features of nephrogenic systemic fibrosis on radiology examinations. Am J Roentgenol 2009; 193: 61–9. [DOI] [PubMed] [Google Scholar]
- 3. Burrowes DP, Medellin A, Harris AC, Milot L, Wilson SR. Contrast‐enhanced US approach to the diagnosis of focal liver masses. Radiographics 2017; 37: 1388–400. [DOI] [PubMed] [Google Scholar]
- 4. Paefgen V, Doleschel D, Kiessling F. Evolution of contrast agents for ultrasound imaging and ultrasound‐mediated drug delivery. Front Pharmacol 2015; 6: 197. [DOI] [PMC free article] [PubMed] [Google Scholar]
- 5. Piscaglia F, Lencioni R, Sagrini E, Pina CD, Cioni D, Vidili G, et al. Characterization of focal liver lesions with contrast‐enhanced ultrasound. Ultrasound Med Biol 2010; 36: 531–50. [DOI] [PubMed] [Google Scholar]
- 6. Wilson SR, Burns PN. Microbubble‐enhanced US in body imaging: what role? Radiology 2010; 257: 24–39. [DOI] [PubMed] [Google Scholar]
- 7. Nicolau C, Ripollés T. Contrast‐enhanced ultrasound in abdominal imaging. Abdom Imaging 2012; 37: 1–19. [DOI] [PubMed] [Google Scholar]
- 8. Claudon M, Dietrich CF, Choi BI, Cosgrove DO, Kudo M, Nolsøe CP, et al. Guidelines and good clinical practice recommendations for contrast enhanced ultrasound (CEUS) in the liver – update 2012: a WFUMB‐EFSUMB initiative in cooperation with representatives of AFSUMB, AIUM, ASUM. FLAUS and ICUS Ultraschall Med 2013; 34: 11–29. [DOI] [PubMed] [Google Scholar]
- 9. Appis AW, Tracy MJ, Feinstein SB. Update on the safety and efficacy of commercial ultrasound contrast agents in cardiac applications. Echo Res Pract 2015; 2: R55–62. [DOI] [PMC free article] [PubMed] [Google Scholar]
- 10. Lindner JR, Belcik T, Main ML, Montanaro A, Mulvagh SL, Olson J, et al. Expert consensus statement from the American Society of Echocardiography on hypersensitivity reactions to ultrasound enhancing agents in patients with allergy to polyethylene glycol. J Am Soc Echocardiogr 2021; 34: 707–8. [DOI] [PMC free article] [PubMed] [Google Scholar]
- 11. D'Onofrio M, Martone E, Faccioli N, Zamboni G, Malagò R, Mucelli RP. Focal liver lesions: sinusoidal phase of CEUS. Abdom Imaging 2006; 31: 529–36. [DOI] [PubMed] [Google Scholar]
- 12. Kudo M, Hatanaka K, Maekawa K. Sonazoid‐enhanced ultrasound in the diagnosis and treatment of hepatic tumors. J Med Ultrasound 2008; 16: 130–9. [Google Scholar]
- 13. Jang JY, Kim MY, Jeong SW, Kim TY, Kim SU, Lee SH, et al. Current consensus and guidelines of contrast enhanced ultrasound for the characterization of focal liver lesions. Clin Mol Hepatol 2013; 19: 1–16. [DOI] [PMC free article] [PubMed] [Google Scholar]
- 14. Quaia E, Calliada F, Bertolotto M, Rossi S, Garioni L, Rosa L, et al. Characterization of focal liver lesions with contrast‐specific US modes and a sulfur hexafluoride‐filled microbubble contrast agent: diagnostic performance and confidence. Radiology 2004; 232: 420–30. [DOI] [PubMed] [Google Scholar]
- 15. Burrowes DP, Medellin A, Harris AC, Milot L, Lethebe BC, Wilson SR. Characterization of focal liver masses: a multicenter comparison of contrast‐enhanced ultrasound, computed tomography, and magnetic resonance imaging. J Ultrasound Med 2021; 40: 2581–93. [DOI] [PubMed] [Google Scholar]
- 16. Burns PN, Wilson SR. Focal liver masses: enhancement patterns on contrast‐enhanced images ‐ concordance of US scans with CT scans and MR images. Radiology 2007; 242: 162–74. [DOI] [PubMed] [Google Scholar]
- 17. Popescu A, Sporea I, Şirli R, Dănilă M, Mare R, Grădinaru Taşcău O, et al. Does contrast enhanced ultrasound improve the management of liver abscesses? A single centre experience. Med Ultrason 2015; 17: 451–5. [DOI] [PubMed] [Google Scholar]
- 18. Décarie P‐O, Lepanto L, Billiard J‐S, Olivié D, Murphy‐Lavallée J, Kauffmann C, et al. Fatty liver deposition and sparing: a pictorial review. Insights Imaging 2011; 2: 533–8. [DOI] [PMC free article] [PubMed] [Google Scholar]
- 19. Assy N, Nasser G, Djibre A, Beniashvili Z, Elias S, Zidan J. Characteristics of common solid liver lesions and recommendations for diagnostic workup. World J Gastroenterol 2009; 15: 3217–27. [DOI] [PMC free article] [PubMed] [Google Scholar]
- 20. Dietrich CF, Mertens JC, Braden B, Schuessler G, Ott M, Ignee A. Contrast‐enhanced ultrasound of histologically proven liver hemangiomas. Hepatology 2007; 45: 1139–45. [DOI] [PubMed] [Google Scholar]
- 21. de Buy M, Wenniger L, Terpstra V, Beuers U. Focal nodular hyperplasia and hepatic adenoma: epidemiology and pathology. Dig Surg 2010; 27: 24–31. [DOI] [PubMed] [Google Scholar]
- 22. Kondo F. Benign nodular hepatocellular lesions caused by abnormal hepatic circulation: etiological analysis and introduction of a new concept. J Gastroenterol Hepatol 2001; 16: 1319–28. [DOI] [PubMed] [Google Scholar]
- 23. Wanless IR, Mawdsley C, Adams R. On the pathogenesis of focal nodular hyperplasia of the liver. Hepatology 1985; 5: 1194–200. [DOI] [PubMed] [Google Scholar]
- 24. Yen YH, Wang JH, Lu SN, Chen TY, Changchien CS, Chen CH, et al. Contrast‐enhanced ultrasonographic spoke‐wheel sign in hepatic focal nodular hyperplasia. Eur J Radiol 2006; 60: 439–44. [DOI] [PubMed] [Google Scholar]
- 25. Katabathina VS, Menias CO, Shanbhogue AKP, Jagirdar J, Paspulati RM, Prasad SR. Genetics and imaging of hepatocellular adenomas: 2011 update. Radiographics 2011; 31: 1529–43. [DOI] [PubMed] [Google Scholar]
- 26. Mittal S, El‐Serag HB. Epidemiology of hepatocellular carcinoma: consider the population. J Clin Gastroenterol 2013; 47: S2–6. [DOI] [PMC free article] [PubMed] [Google Scholar]
- 27. Marrero JA, Kulik LM, Sirlin CB, Zhu AX, Finn RS, Abecassis MM, et al. Diagnosis, staging, and management of hepatocellular carcinoma: 2018 practice guidance by the American Association for the Study of Liver Diseases. Hepatology 2018; 68: 723–50. [DOI] [PubMed] [Google Scholar]
- 28. Cholankeril G, Patel R, Khurana S, Satapathy SK. Hepatocellular carcinoma in non‐alcoholic steatohepatitis: current knowledge and implications for management. World J Hepatol 2017; 9: 533–43. [DOI] [PMC free article] [PubMed] [Google Scholar]
- 29. Quaia E. State of the art: LI‐RADS for contrast‐enhanced US. Radiology 2019; 293: 4–14. [DOI] [PubMed] [Google Scholar]
- 30. Landis SH, Murray T, Bolden S, Wingo PA. Cancer statistics, 1998. CA Cancer J Clin 1998; 48: 6–29. [DOI] [PubMed] [Google Scholar]
- 31. Han JK, Choi BI, Kim AY, An SK, Lee JW, Kim TK, et al. Cholangiocarcinoma: pictorial essay of CT and cholangiographic findings. Radiographics 2002; 22: 173–87. [DOI] [PubMed] [Google Scholar]
- 32. Nichols JC, Gores GJ, LaRusso NF, Wiesner RH, Nagorney DM, Ritts RE. Diagnostic role of serum CA 19‐9 for cholangiocarcinoma in patients with primary sclerosing cholangitis. Mayo Clin Proc 1993; 68: 874–9. [DOI] [PubMed] [Google Scholar]
- 33. Sica GT, Ji H, Ros PR. CT and MR imaging of hepatic metastases. Am J Roentgenol 2000; 174: 691–8. [DOI] [PubMed] [Google Scholar]
- 34. Nicolau C, Brú C. Focal liver lesions: evaluation with contrast‐enhanced ultrasonography. Abdom Imaging 2004; 29: 348–59. [DOI] [PubMed] [Google Scholar]
- 35. Kong WT, Ji ZB, Wang WP, Cai H, Huang BJ, Ding H. Evaluation of liver metastases using contrast‐enhanced ultrasound: enhancement patterns and influencing factors. Gut Liver 2016; 10: 283–7. [DOI] [PMC free article] [PubMed] [Google Scholar]
- 36. Mahfouz AE, Hamm B, Wolf KJ. Peripheral washout: a sign of malignancy on dynamic gadolinium‐enhanced MR images of focal liver lesions. Radiology 1994; 190: 49–52. [DOI] [PubMed] [Google Scholar]