Significance
Here, we show that transcription factor EB (TFEB), thought to be a key regulator of autophagy and lysosome function, can be regulated by T regulatory (Treg)-related cues in a mechanistic target of rapamycin complex 1-independent manner and is crucial for Treg cell generation and function. TFEB deficiency affects Treg mitochondrial fitness and could result in impaired generation and function of Treg cells in autoimmune disease and tumors irrespective of autophagy and lysosome activity. These data demonstrate that TFEB acts as a critical regulator for orchestrating Treg generation and function in response to local environmental cues.
Keywords: TFEB, Treg, mitochondrial, mTORC1, Myc
Abstract
T regulatory (Treg) cells are essential for self-tolerance whereas they are detrimental for dampening the host anti-tumor immunity. How Treg cells adapt to environmental signals to orchestrate their homeostasis and functions remains poorly understood. Here, we identified that transcription factor EB (TFEB) is induced by host nutrition deprivation or interleukin (IL)-2 in CD4+ T cells. The loss of TFEB in Treg cells leads to reduced Treg accumulation and impaired Treg function in mouse models of cancer and autoimmune disease. TFEB intrinsically regulates genes involved in Treg cell differentiation and mitochondria function while it suppresses expression of proinflammatory cytokines independently of its established roles in autophagy. This coordinated action is required for mitochondria integrity and appropriate lipid metabolism in Treg cells. These findings identify TFEB as a critical regulator for orchestrating Treg generation and function, which may contribute to the adaptive responses of T cells to local environmental cues.
T regulatory (Treg) cells are essential for self-tolerance but detrimental for dampening anti-tumor immunity (1, 2). Treg cells respond to cues within local tissues, such as nutritional availability and abundance of cytokines to coordinate their homeostasis, survival, and stability to execute their functions (3, 4). Interleukin (IL)-2 is required for the maintenance of Treg cells through activation of STAT5, which is known to enhance expression of Foxp3 (5–8). In addition to STAT5 activation, IL-2 activates mammalian target of rapamycin (mTOR), yet inhibition of mTOR enhances Treg differentiation (9).
Treg cells favorably accumulate within the tumors to maintain an immunosuppressive environment (10, 11), despite the harsh conditions within the tumor microenvironments that is often acidic, hypoxic with a lack of critical nutrients such as glucose and glutamine. Nutrient deprivation has been associated with enhanced Treg generation, consistent with mTOR inhibition (12). Treg cells, in contrast with effector T cells, have been shown to rely on fatty acid oxidation for their generation and function rather than glycolysis (13–15), although this has been recently disputed (16–18).
Transcription factor EB (TFEB), encoded by Tcfeb gene, was identified as a master transcription factor for lysosome biogenesis and autophagy (19). TFEB expression is up-regulated in mouse kidney, liver, and fat tissues in response to starvation, which subsequently controls lipid metabolism to maintain host homeostasis (20). Moreover, TFEB plays a key role in differential regulation of the presentation of exogenous antigens by DCs (21). TFEB is largely regulated through a variety of posttranslational modifications, which affect its dynamic subcellular localization and activity (22, 23). Mechanistic target of rapamycin complex 1 (mTORC1) phosphorylates TFEB on Serine 142 and Serine 211 residues under nutrient-rich conditions (24, 25). Once these serines are phosphorylated, TFEB remains cytosolic and inactive. The role of TFEB in T cell development and function remains largely unknown.
We report here that diverse Treg-related stimuli including T cell receptor (TCR) and IL-2 stimulation in vitro or nutrition deprivation in vivo induced TFEB expression in CD4+ T cells, which promotes Treg differentiation. Deletion of TFEB in Treg cells leads to reduced Treg accumulation and impaired suppressive function. Deficiency of TFEB affected neither autophagy nor lysosome activity in Treg cells. Transcriptome analysis revealed TFEB regulates genes associated with Treg cell generation and mitochondria organization. The loss of TFEB in Treg cells resulted in mitochondrial dysfunction and impaired fatty acid oxidation. Mice bearing Tcfeb deficiency in Treg cells had enhanced anti-tumor immunity in a xenograft mouse model. In summary, our data identified TFEB as a regulator of Treg generation and function with both a distinct and a shared program with mTORC1.
Results
TFEB Is Induced in T Cells by Diverse Stimuli.
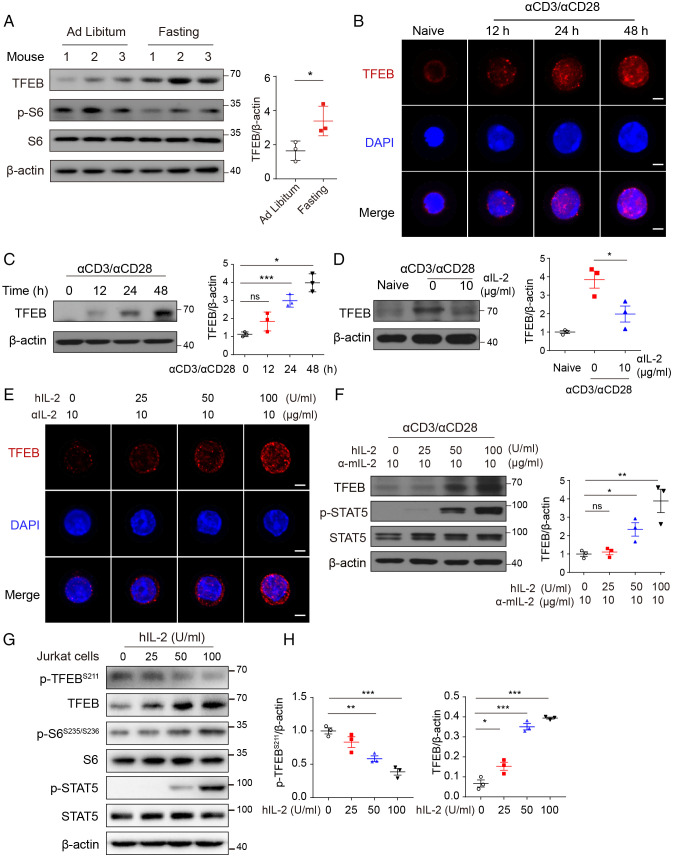
To investigate the potential function of TFEB in response to nutrient deprivation in immune cells, mice were fasted for 24 h, and TFEB expression in splenocytes was determined using immunofluorescent staining. Nutrient deprivation enhanced TFEB expression in the spleen (SI Appendix, Fig. S1A), which was accompanied with reduced mTORC1 activity measured by p-S6 levels in CD4+ T cells (SI Appendix, Fig. S1B). This was confirmed with immunoblotting in isolated CD4+ T cells (Fig. 1A). Consistent with a previous study (26), starvation resulted in increased Treg population in the periphery blood (SI Appendix, Fig. S1C), suggesting a possible association of TFEB with Treg generation.
Fig. 1.
TFEB is induced in T cells by diverse stimuli. (A) Immunoblot analysis (Left) and quantitative results (Right) of TFEB expression in splenic CD4+ T cells isolated from C57/BL6 mice given ad libitum access to normal chow diet or starved for 36 h (n = 3 mice per group). (B) Confocal microscopy analysis of TFEB (Red) expression in naïve CD4+ T cells stimulated with anti-CD3/anti-CD28 (5 μg/mL) for 0, 12, 24, and 48 h. (Scale bars: 5 µm.) (C) Immunoblotting analysis and quantitative results of TFEB expression under anti-CD3/anti-CD28 stimulation (5 μg/mL) for the indicated time. (D) Naïve CD4+ T cells were stimulated with anti-CD3/anti-CD28 (5 µg/mL of each) for 72 h in the absence or presence of anti-IL-2 (10 µg/mL). TFEB expression was determined with immunoblotting and band intensities were quantified. (E and F) Confocal microscopy (E) and immunoblot (F) analysis of TFEB expression in activated CD4+ T cells in the presence of anti-mIL-2 and varying amounts of hIL-2 for 12 h. (Scale bars: 5 µm.) (G and H) Immunoblot analysis (G) and quantitative results (H) of p-TFEBSer211 and TFEB in Jurkat cells stimulated with varying amounts of hIL-2. Data are representative of three experiments. Data are means ± SEM and were analyzed by two-tailed, unpaired Student’s t test.
Stimulation of TCR induced TFEB expression in a time-dependent manner and enhanced its nuclear localization (Fig. 1B and C), despite well-documented mTORC1 activation upon TCR stimulation (27, 28). Blockade of IL-2 with neutralizing antibodies against murine IL-2 resulted in both band shift and significant inhibition of TCR-induced TFEB expression (Fig. 1D). Conversely, exogenous IL-2 enhanced TFEB expression in a dose-dependent manner (Fig. 1E and F). Further analysis showed IL-2 enhanced the presence of TFEB in both cytosol and nucleus (SI Appendix, Fig. S1D), indicating both induction and translocation of TFEB are regulated by IL-2. To investigate the mechanism underlying this, we measured phosphorylation of TFEB at serine 211 in Jurkat T cells. We found that despite the enhanced mTORC1 activation, IL-2 inhibited the phosphorylation of TFEB (Fig. 1G and H), indicating that a dominant dephosphorylation of TFEB is induced by IL-2. Together, these data demonstrate that both nutrient deprivation and IL-2 can induce TFEB expression in CD4+ T cells, which was irrespective of the status of mTORC1 activity.
TFEB Regulates Treg Differentiation In Vitro.
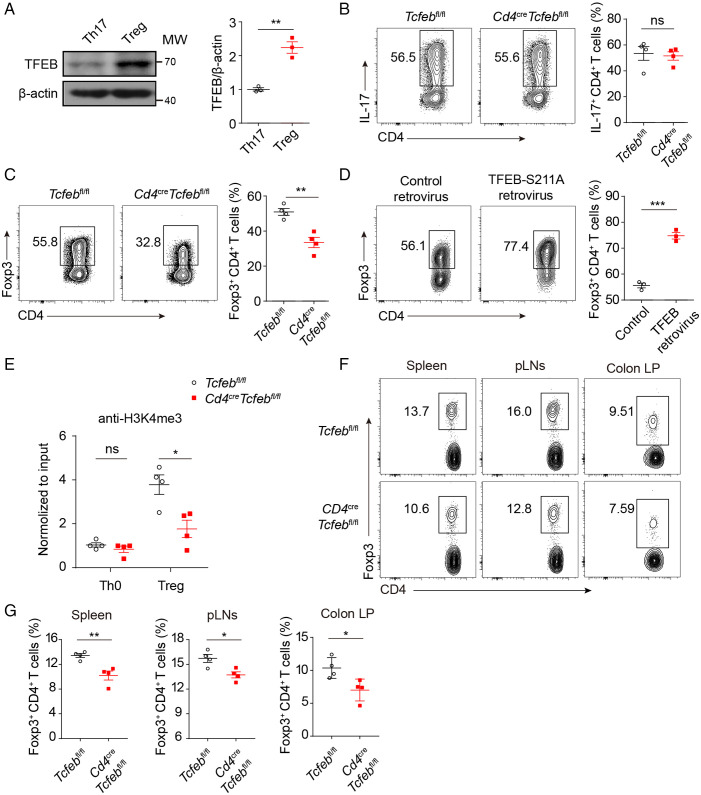
Th17 and Treg differentiation are conversely regulated by IL-2 (29). Compared with in vitro differentiated Th17 cells, iTreg cells had significantly up-regulated TFEB expression (Fig. 2A). To investigate the potential function of TFEB in Treg cells, we generated Tcfeb-deficient mice in the T cell compartment by crossed mice carrying loxp-flanked Tcfeb (Tcfebfl/fl) to Cd4-Cre transgenic mice. The deletion in CD4+ T cells was confirmed by quantitative polymerase chain reaction (qPCR), immunoblotting, and immunofluorescence assays (SI Appendix, Fig. S2A–C). Tcfeb-deficient T cells had comparable Th17 polarization with wild-type (WT) cells in vitro (Fig. 2B). However, the polarization of naïve T cells into Treg cells in vitro was significantly inhibited in the absence of TFEB (Fig. 2C). Conversely, overexpression of a constitutive TFEB S211A mutant with retroviral particles significantly enhanced Treg differentiation (Fig. 2D). The presence of H3K4me3 within the promoter of Foxp3 was significantly reduced in Tcfeb-deficient Treg cells (Fig. 2E).
Fig. 2.
TFEB regulates Treg differentiation in vitro. (A) Immunoblot analysis (Left) and quantitative results (Right) of TFEB in Th17 and Treg cells. (B and C) WT and Tcfeb-deficient naïve CD4+ T cells were differentiated under Th17 (B) and Treg (C) conditions for 3 d. Representative flow cytometry plots and frequencies of IL-17+ T cells (B) and Foxp3+ T cells (C). (D) Activated CD4+ T cells were transduced with control retrovirus or TFEB-S211A retrovirus and then differentiated under Treg conditions. Representative flow cytometry plots and frequencies of Foxp3+ cells were shown. (E) The occupancies of H3K4me3 in the Foxp3 promoter were determined by chromatin immunoprecipitation and reverse transcription–PCR. (F and G) Representative flow cytometry plot (F) and frequencies (G) of CD4+ Foxp3+ Treg cells in spleen, pLNs, and colonic lamina propria (LP) of 20-wk-old Tcfebfl/fl and CD4CreTcfebfl/fl mice (n = 4). ns, no significance; *P < 0.05, **P < 0.01, ***P < 0.001. Data are representative of three (A, D, E) or four (B, C) experiments. Data are means ± SEM and were analyzed by two-tailed, unpaired Student’s t test.
Next, we asked whether deletion of TFEB in the CD4 compartment would affect Treg development and T cell homeostasis. The percentages and numbers of CD4+Foxp3+ Treg cells were significantly lower in the spleen, periphery lymph nodes (pLNs), and colon LP of 20-wk-old knockout (KO) mice, compared to WT controls (Fig. 2F and G). Both CD4+NRP1+Foxp3+ tTreg and CD4+NRP1−Foxp3+ pTreg were affected by the TFEB deficiency (SI Appendix, Fig. S2D and E). The total numbers of CD4+ and CD8+ T cells, as well as the percentages of CD44highCD62Llow activated CD4+ and CD8+ T cells, were higher in the spleen and pLNs isolated from KO mice (SI Appendix, Fig. S2F and G). The percentages of interferon (IFN)-γ-producing CD4+ T cells and CD8+ T cells in the spleens were also higher (SI Appendix, Fig. S2H). Taken together, these data demonstrate that TFEB positively regulates Treg cell differentiation both in vitro and in vivo.
TFEB Is Critical for Treg Suppressive Function.
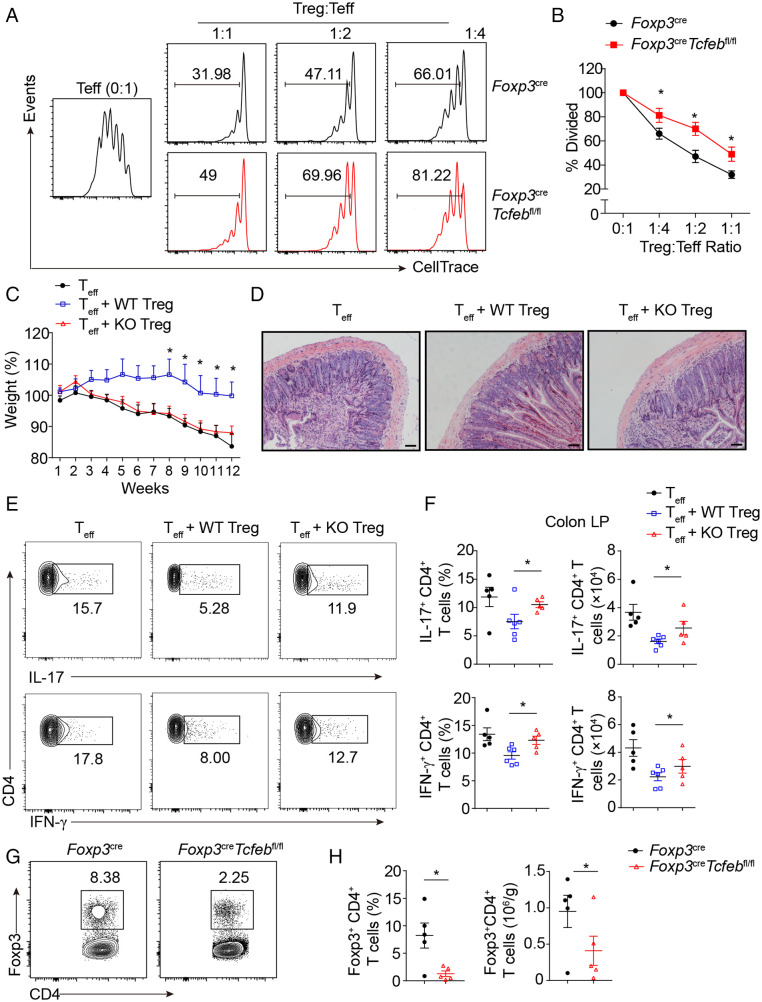
To investigate the function of TFEB in Treg cells, we generated the Foxp3YFP-CreTcfebfl/fl mice, in which Tcfeb is deleted in the Treg compartment. These mice had increased cell numbers in the spleen and lymph nodes and reduced Treg cell numbers (SI Appendix, Fig. S3A and B), indicating that TFEB is indispensable for Treg homeostasis. To test whether TFEB is required for the suppressive activity of Treg cells, we sorted YFP+ Treg cells from Foxp3YFP−Cre or Foxp3YFP−CreTcfebfl/fl mice, cocultured them with fluorescence-labeled naïve CD4+ T cells at different ratios, and the cells were stimulated with plate-bound anti-CD3/CD28 for 3 d. While both WT and TFEB KO Treg cells suppressed CD4+ T cell proliferation in a dose-dependent manner, Tcfeb-deficient Treg cells were significantly less able to suppress effector T cell expansion, compared with WT Treg cells at all tested ratios (Fig. 3A and B).
Fig. 3.
TFEB is critical for Treg suppressive function. (A and B) Cell trace-labeled WT naïve CD4+ T cells were stimulated with anti-CD3/anti-CD28 (1 µg/mL of each) in the absence or presence of Treg cells sorted from Foxp3YFP-Cre mice or Foxp3YFP-CreTcfebfl/fl mice at indicated ratios for 72 h. Representative histograms (A) and the mean percentages of divided cells (B) were shown. (C–H) Rag2−/− mice received 4 × 10⁵ CD4+CD25−CD45RBhigh T cells alone or in combination with 2 × 10⁵ WT or Tcfeb-knockout Treg cells. (C) Weight changes of mice post T cell transfer were shown (n = 5 or 6). (D) Representative images of colon sections. (Scale bars: 100 µm.) (E, F) Representative flow cytometry plots and frequencies of IL-17- and IFN-γ-producing CD4+ cells in colonic LP. (G, H) Representative flow cytometry plots and frequencies of CD4+Foxp3+ Treg cells in the spleens. *P < 0.05. Data are representative of two independent experiments with similar results. Data are means ± SEM and were analyzed by two-tailed, unpaired Student’s t test.
We next investigated Treg cell function in vivo using a transfer colitis model. We adoptively transferred sorted CD4+CD25−CD45RBhi naïve T cells alone or with YFP+ Treg cells from Foxp3YFP−Cre or Foxp3YFP−CreTcfebfl/fl mice into Rag2-deficient mice. Naïve T cells induced gradual weight loss and colitis of Rag2−/− mice, whereas cotransfer of WT Treg cells reversed the weight loss and colitis (Fig. 3C and D). By contrast, Tcfeb-deficient Treg cells did not prevent weight loss and failed to suppress T cell-mediated colitis (Fig. 3C and D). In addition, WT Treg cells, but not Tcfeb−/− Treg cells, reduced effector cell-induced spleen weight loss (SI Appendix, Fig. S3C). While transfer of CD4+CD25−CD45RBhi T cells alone led to the presence of IFN-γ+ and IL-17+ effector Th cells in the lamina propria, cotransfer of WT Treg cells significantly suppressed the percentages and total numbers of IFN-γ+ and IL-17+ effector Th cells (Fig. 3E and F). The inhibitory effect was diminished by the cotransfer of Tcfeb-deficient Treg cells (Fig. 3E and F). Similar results were obtained in the mesenteric lymph nodes (SI Appendix, Fig. S3D). Furthermore, the spleens isolated from the mice cotransferred with WT Treg had significantly higher percentages and numbers of Foxp3+CD4+ T cells (Fig. 3G and H), compared with the group cotransferred with Tcfeb-deficient Treg cells. Together, these data demonstrate that TFEB is essential for the immunosuppressive function of Treg cells both in vitro and in vivo.
TFEB Regulates Treg Homeostasis in a Cell-Intrinsic Manner.
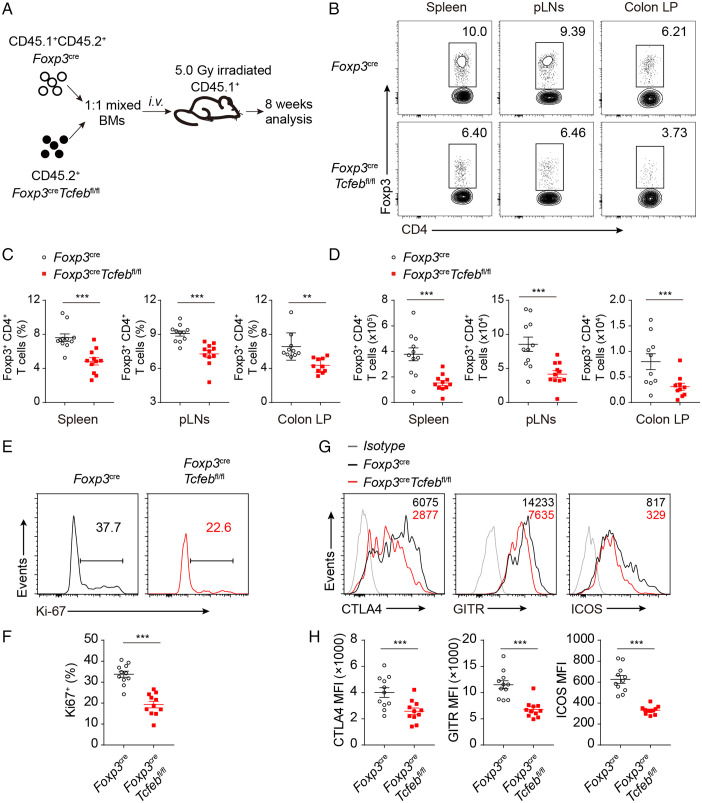
To test whether TFEB intrinsically regulates Treg cell homeostasis, we transferred mixed bone marrows from congenic CD45.1+CD45.2+ Foxp3YFP-Cre and CD45.2+ Foxp3YFP-CreTcfebfl/fl mice into sublethal irritated CD45.1+ C57BL/6 mice (Fig. 4A). After 8 wk, we analyzed the Treg percentages and numbers in the spleens, mesenteric lymph nodes, and lamina propria (Fig. 4B). CD4+ T cells were gated on the congenic mark (SI Appendix, Fig. S4A). We found significantly higher percentages and numbers of WT Foxp3+ cells in both secondary lymphoid organs and small intestines, compared to their Tcfeb-deficient counterparts (Fig. 4C and D). The median fluorescence intensity (MFI) of Foxp3 in Treg cells were significantly lower in the Tcfeb-deficient populations, compared with WT populations (SI Appendix, Fig. S4B), indicating an intrinsic regulation of Treg cell generation by TFEB. In line with this, loss of TFEB also affected the stability of in vitro-generated Treg cells (SI Appendix, Fig. S4C). The recovered Tcfeb-deficient Treg cells had significantly reduced proliferative and anti-apoptotic activities measured by Ki-67 staining and anti-apoptotic BCL-2 expression (Fig. 4E and F and SI Appendix, Fig. S4D). The expression of Treg function related molecules including CTLA-4, GITR, and ICOS were also reduced in Tcfeb-deficient Treg cells (Fig. 4G and H).
Fig. 4.
TFEB regulates Treg homeostasis in a cell-intrinsic manner. (A) Schematic of bone marrow (BM) chimera mice generation. (B–D) Representative flow cytometry plots (B), frequencies (C), and numbers (D) of wild-type Foxp3YFP-Cre (CD45.1+ CD45.2+) and Foxp3YFP-CreTcfebfl/fl (CD45.1− CD45.2+) CD4+Foxp3+ Treg cells recovered in the spleens, pLNs, and colonic LP from chimera (n = 10 or 11). (E and F) Representative flow cytometry plots (E) and frequencies (F) of Ki-67+ cells in wild-type and Tcfeb-deficient Treg cells from the spleens of chimera (n = 11). (G and H) Representative histogram (G) and MFI quantitation (H) of CTLA-4, GITR and ICOS in WT and Tcfeb-deficient Treg cells from chimeric mice (n = 11). *P < 0.05. Data are means ± SEM and were analyzed by two-tailed, paired Student’s t test.
Together, these data demonstrate that TFEB regulates Treg cell homeostasis in a Treg cell-intrinsic manner.
TFEB Does Not Regulate Autophagy and Lysosome Activity in Treg Cells.
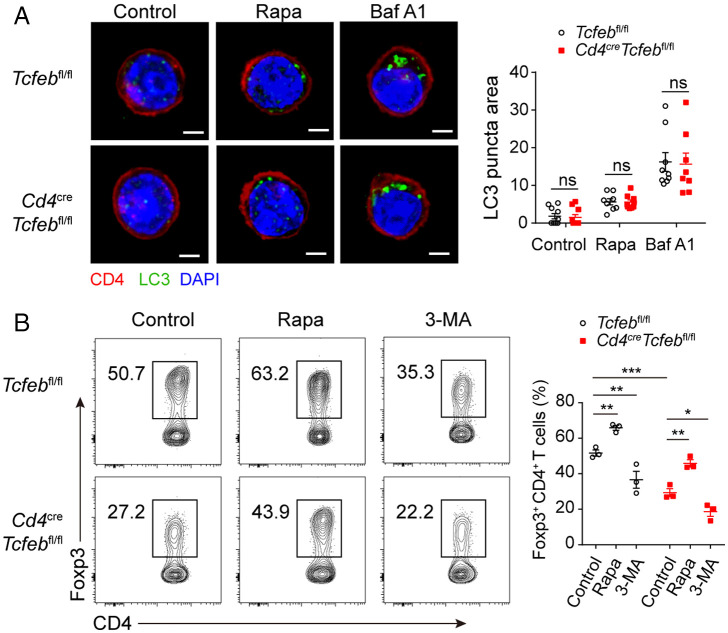
Next, we asked whether TFEB regulates genes that are associated with autophagy and the lysosome in in vitro differentiated Treg cells. Treatment with rapamycin significantly induced autophagy and lysosome-related genes including Atg5, Atg7, Atg10, Atg16l, Vsp34, Ctsf, Clcn7, and Lamp2, and to a lesser extent for other test genes in WT Treg cells (SI Appendix, Fig. S5A and B). However, deletion of Tcfeb in Treg cells did not affect the induction pattern for the autophagy- and lysosome-related genes (SI Appendix, Fig. S5A and B). Of note, expression of Atg5 and Beclin1 induced by rapamycin was slightly reduced in the absence of TFEB (SI Appendix, Fig. S5A and B). To test if TFEB affected autophagy in Treg cells, we compared the amounts of LC3 puncta in WT or Tcfeb-deficient Treg cells treated with rapamycin or bafilomycin A (BafA1). Rapamycin treatment induced comparable amounts of LC3 puncta in WT and Tcfeb-deficient Treg cells (Fig. 5A). Similarly, the lysosomal inhibitor bafilomycin A led to accumulation of LC3 puncta, and the amounts of LC3 puncta were comparable (Fig. 5A). Deletion of TFEB did not affect Lysotracker staining (SI Appendix, Fig. S5C), indicating the absence of TFEB did not impair the lysosome activity. Consistent with this, the LC3 levels after rapamycin and bafilomycin A treatment were comparable (SI Appendix, Fig. S5D). BafA1 suppressed the maturation of Cathepsin B in both WT and KO groups; however, the amounts of cleaved Cathepsin B were comparable between WT and KO Treg cells (SI Appendix, Fig. S5D), indicating deletion of TFEB does not affect lysosomal activity. Of note, the amounts of phosphorylated S6 were not affected by the deficiency of TFEB (SI Appendix, Fig. S5D).
Fig. 5.
TFEB does not regulate autophagy and lysosome activity in Treg cells. (A) WT or Tcfeb-deficient naïve CD4+ T cells were differentiated under Treg condition for 3 d in the absence or presence of rapamycin (100 nM) or BafA1 (100 nM). LC3 puncta was stained with immunofluorescent antibodies and analyzed with confocal microscopy, and the amounts were quantified with Image J. (B) WT or Tcfeb-deficient naïve CD4+ T cells were differentiated under Treg conditions, in the presence of rapamycin (100 nM), or 3-MA (5 mM) for 3 d. Representative flow cytometry plots and frequencies of CD4+Foxp3+ Treg cells were determined. ns, no significance; *P < 0.05, **P < 0.01, ***P < 0.001. Data are representative of three experiments. Data are means ± SEM and were analyzed by two-way ANOVA.
TFEB is a known mTORC1 substrate, and we asked whether TFEB mediates the enhancement of Treg differentiation by rapamycin. Consistent with the literature (9), rapamycin significantly enhanced Treg differentiation in both WT and Tcfeb-deficient group (Fig. 5B and SI Appendix, Fig. S5E and F). While BafA1 had no effects on Treg differentiation, 3-methyladenine (3-MA), an autophagy inhibitor, suppressed Treg cell differentiation in both WT and Tcfeb-deficient group (Fig. 5B and SI Appendix, Fig. S5E and F). Nevertheless, Treg differentiation ability of Tcfeb-deficient cells was impaired in the presence of 3-MA or BafA (Fig. 5B and SI Appendix, Fig. S5F). The induction of autophagy by Rapamycin was confirmed by enhanced LC3II expression and degradation of p62; 3-MA had the opposite effects (SI Appendix, Fig. S5G). However, there was no difference between WT and KO iTreg cells (SI Appendix, Fig. S5G). Together, these data demonstrate that TFEB regulates Treg differentiation independent of the autophagy-lysosomal pathway.
TFEB Regulates Mitochondria Fitness and Fatty Acid Oxidation in Treg Cells.
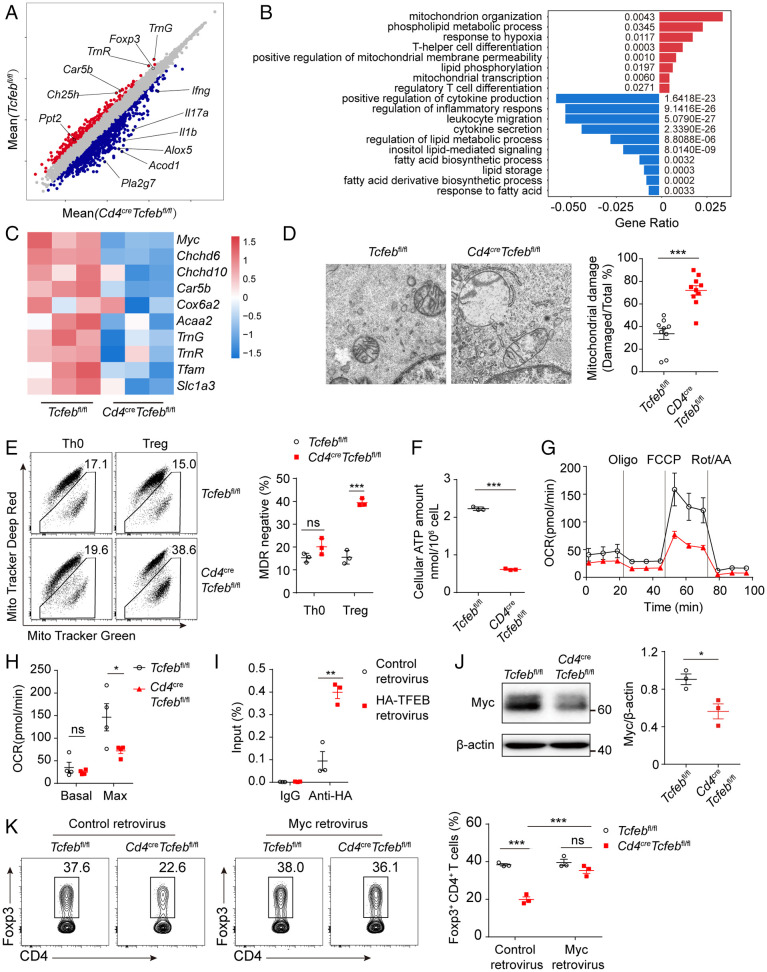
We next compared the transcriptomes of WT and Tcfeb-deficient Tregs by RNA sequencing (RNA-seq). Using fold changes >2, we found 349 genes were down-regulated and 1,040 genes up-regulated in the Tcfeb-deficient Treg cells (Fig. 6A). Tcfeb-deficient Tregs showed significant enrichment of gene signatures associated with the cytokine production, cytokine secretion, and regulation of proinflammatory response (Fig. 6B). These included genes such as Il1b, Il17a, Ifng, and Il-5 (Fig. 6A and SI Appendix, Fig. S6A).
Fig. 6.
TFEB regulates mitochondria integrity and metabolism in Treg cells. (A–C) RNA-seq analysis of WT or Tcfeb-deficient naïve CD4+ T cells differentiated under Treg condition for 60 h. (A) Volcano plot showing differentially expressed genes between the two groups (n = 3). Each red or blue dot denotes a differentially expressed gene with fold change >2. (B) Gene ontology analysis of pathways in differentially expressed genes. (C) Heatmap showing the expression patterns of mitochondria related genes in Treg cells. The color density indicates the expression of genes, each row was scaled by z-score. (D) Representative electron microscope images (Left) and quantitative percentages (Right) of damaged mitochondrial cristae structure. (E) Representative flow cytometry plots (Left) of MitoTracker Green and MitoTracker Deep Red and frequencies of MitoTracker Deep Red in WT and TFEB-deficient Th0 and Treg cells (Right). (F) The amounts of intracellular ATP were determined by luminescent ATP detection assay. (G and H) A representative plot of oxygen consumption rate (OCR) and respective basal and maximal (after FCCP addition) respiratory activity of WT and Tcfeb-deficient Treg cells were shown. (I) The occupancies of TFEB in the Myc promoter were determined by chromatin immunoprecipitation. (J) Immunoblot analysis and quantitative results of Myc expression of in vitro differentiated Treg cells from Tcfebfl/fl and Cd4CreTcfebfl/fl mice. (K) Activated CD4+ T cells were transduced with control retrovirus or Myc retrovirus and differentiated under Treg conditions. Representative flow cytometry plots (Left) and frequencies (Right) of CD4+Foxp3+ Treg cells were shown. ns, no significance; *P < 0.05; **P < 0.01. Data are representative of three (A, B, C, J) or two (E, G, H, I, K) experiments. Data are means ± SEM and were analyzed by two-tailed, unpaired Student’s t test (D–J) and two-way ANOVA (K).
Among the most prominent down-regulated genes seen in Tcfeb-deficient Treg cells, we found two functional groups. The first group included Car5b, TrnG, and TrnR; genes that are involved in regulation of mitochondria integrity and function. The second group included Ch25h and Angl4_1; genes that are associated with lipid metabolism (Fig. 6A). TFEB deficiency affected multiple pathways in lipid metabolism including phospholipid metabolic process, lipid phosphorylation, and fatty acid biosynthetic process (Fig. 6B). While Ch25h, Angl4_1, and Pld4 were down-regulated, Elov4, Alox5, Alox5ap, and Ptgs2 were up-regulated in Tcfeb-deficient Treg cells (SI Appendix, Fig. S6B). Key mitochondrial regulators Myc, Car5b, genes TrnG and TrnR encoding mitochondrial RNAs, and Cox6a encoding a subunit of complex IV, the last enzyme in the mitochondria electron transport chain, were down-regulated in Tcfeb-deficient Treg cells (Fig. 6C and SI Appendix, Fig. S6C). We differentiated naïve T cells isolated from Foxp3YFP-Cre or Foxp3YFP-CreTcfebfl/fl and sorted YFP+ Treg cells. Similar results were obtained on TFEB-regulated gene expression in these cells (SI Appendix, Fig. S6D and E), suggesting TFEB intrinsically regulates expression of Treg-related genes, cytokines, and mitochondrial genes.
In line with this, we saw that the mitochondria were enlarged with loss of cristae structure in KO Treg cells, compared to WT Tregs (Fig. 6D). In addition, KO Treg cells had significantly enhanced percentages of MitoTracker Deep Red lower staining (Fig. 6E) and reduced fluorescence intensity of TMRE staining (SI Appendix, Fig. S6F and G), whereas deletion of Tcfeb had no effects on Th0 cells. These data suggest the regulation of mitochondrial fitness by TFEB is highly likely Treg-specific. TFEB deletion led to reduced intracellular adenosine 5′-triphosphate (ATP) production (Fig. 6F). Seahorse extracellular flux assay showed that Tcfeb-deficient Treg cells had similar glycolytic rates compared with control Treg cells, but significantly reduced oxygen consumption rates (OCR), which was most pronounced in the presence of the uncoupling agent FCCP, further supporting impaired mitochondrial function (Fig. 6G and H and SI Appendix, Fig. S6H).
To investigate whether TFEB directly regulates mitochondrial genes, we transduced CD4+ T cells with TFEB-HA retrovirus under Treg differentiation condition and performed chromatin immunoprecipitation analysis with anti-HA antibody. Overexpression of TFEB-HA significantly enhanced occupancies of TFEB within the promoter of Myc (Fig. 6I). Furthermore, we found the protein level of Myc was significantly decreased in the Tcfeb-deficient iTreg cells (Fig. 6J). Myc overexpression reversed the defect of Treg differentiation in TFEB-KO group (Fig. 6K). Moreover, overexpression of Myc in the Tcfeb-deficient Tregs restored their ability to suppress the proliferation of fluorescence-labeled T effector cells to a level similar to that of WT Treg cells (SI Appendix, Fig. S6I).
Together, these data demonstrate that TFEB regulates Treg differentiation via maintenance of Treg mitochondria integrity and function.
Mice with TFEB Deficiency in Treg Cells Had Enhanced Anti-Tumor Immunity.
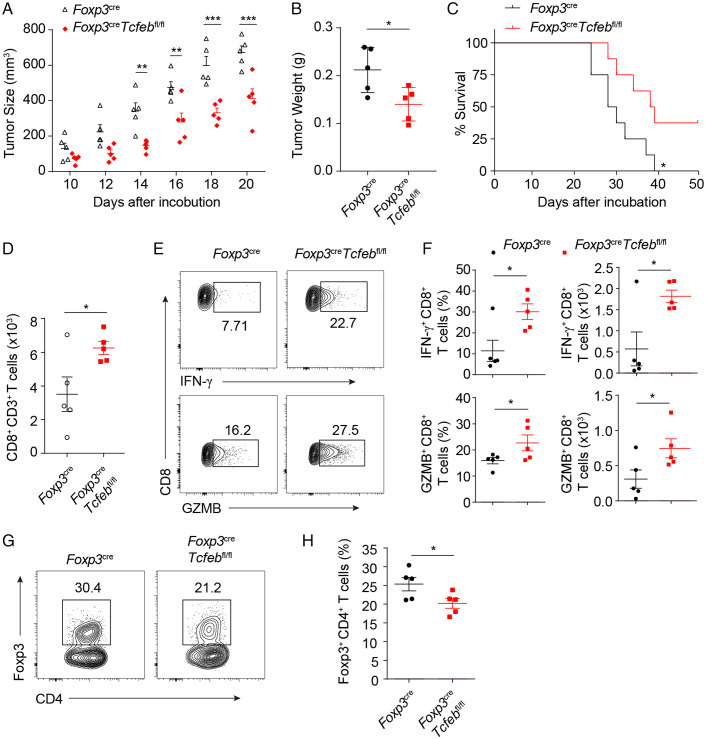
Treg cells play critical roles for establishing and maintenance of an immunosuppressive microenvironment within tumors, where immune cells often compete with tumor cells for oxygen, nutrition, and cytokines. We investigated whether TFEB deficiency in Treg compartments would affect host anti-tumor immunity. To test this, we isolated tumor-derived cell lines (TDCLs) using a well-established KrasLSL-G12D/+; Tp53fl/fl conditional non–small cell lung cancer (NSCLC) model, where spontaneous lung tumors developed upon treatment of the mice with lentiviruses expressing the recombinase Cre by intranasal instillation or intratracheal intubation (30). Those isolated TDCLs were subcutaneously inoculated into Foxp3YFP-Cre mice or Foxp3YFP-CreTcfebfl/fl mice. Compared to Foxp3 YFP-Cre mice, tumor sizes and weight were significantly smaller in the Foxp3YFP-CreTcfebfl/fl mice (Fig. 7A and B) and the survival period of Foxp3YFP-CreTcfebfl/fl mice was significantly extended (Fig. 7C). We found that Tcfeb-deficient Treg cells had less suppressive activity on cytotoxic CD8+ T cell proliferation in vitro (SI Appendix, Fig. S7A and B). Consistent with this, in the Foxp3YFP-CreTcfebfl/fl mice, there were more CD8+ TILs (tumor infiltrating lymphocytes) and higher percentages of IFN-γ- and granzyme B-positive cells within the CD8+ T cell population, as well as the total numbers of IFN-γ+CD8+ and GZMB+CD8+ T cells (Fig. 7D–F). This was associated with reduced Foxp3+ Treg cells within the CD4+ T cell population (Fig. 7G and H). Together, these data indicate that TFEB regulates Treg immunosuppressive function within the tumor microenvironment.
Fig. 7.
Mice with TFEB deficiency in Treg cells had enhanced anti-tumor immunity. 8-wk-old Foxp3YFP-Cre mice and Foxp3YFP-CreTcfebfl/fl mice (n = 5) were subcutaneously injected with TDCL lung tumor cells (1.5 × 10⁶ cells per mouse). (A and B) Tumor growth (A) and tumor weights (B) were shown. (C) Survival curves of TDCL lung tumor bearing Foxp3YFP-Cre mice and Foxp3YFP-CreTcfebfl/fl mice were shown. (D) Total numbers of tumor infiltrating CD8+ T lymphocytes were determined. (E and F) Representative flow cytometry plots and frequencies of IFN-γ and GZMB-producing CD8+ T cells within tumors were determined by flow cytometry. (G and H) Representative flow cytometry plots (G) and frequencies (H) of CD4+Foxp3+ Treg cells within tumors were determined. *P < 0.05, **P < 0.01, ***P < 0.001. Data are representative of two experiments with similar results. Data are means ± SEM and were analyzed by two-tailed, unpaired Student’s t test.
Discussion
Here, we show that diverse Treg-related stimuli impinge on and activate TFEB, and deletion of Tcfeb inhibited Treg differentiation and function both in vitro and in vivo. Deficiency of TFEB led to reduced expression of Foxp3, as well as genes associated with Treg differentiation and function. By contrast, proinflammatory cytokines and chemokines were up-regulated.
It has been reported that key autophagy components (i.e., Atg5, Atg7, and Atg16l) are required for the maintenance and functional integrity of Treg cells (31, 32). The defect of autophagy leads to enhanced mTORC1 activation and glycolysis, which suppresses Treg function (31). Despite the widely reported role of TFEB in regulation of autophagy and lysosomal biogenesis, we did not see alterations in autophagy, lysosome activity, nor mTORC1 activation in the absence of TFEB in Treg cells. In line with our study, over-expression or deletion of TFEB does not affect autophagy in adult skeletal muscle (33). It could be that TFE3 compensates for TFEB for the regulation of autophagy and lysosome activity, since TFEB and TFE3 have been shown to cooperatively regulate B cell humoral response by regulating Cd40l expression in T cells (33), as well as innate response in macrophages (34).
We found enhanced TFEB expression in splenic T cells, similar to that reported in liver and kidney after food deprivation (20), indicating TFEB may mediate metabolic adaption in both lymphoid and nonlymphoid tissues. Both TCR and IL-2, two strong activators of mTORC1, induced TFEB expression. This suggests that TFEB can be activated in the presence of active mTOR, consistent with a previous study (35). TFEB expression and subcellular localization and activity are tightly regulated by hierarchical phosphorylation at numerous serine residues with different consequences (23, 36). While IL-2 enhances phosphorylation on ∼10% of the identified phosphorylation sites in T cells, it suppresses phosphorylation on ∼4% sites, indicating it both positively and negatively regulates protein phosphorylation (37). We found that blockade of IL-2 signaling not only suppressed TFEB expression but also resulted in a faster band shift, indicating possible de-phosphorylation of TFEB by IL-2. This has been confirmed in Jurkat cells. It remains unclear which phosphatase upon IL-2 stimulation dephosphorylates TFEB.
We found that absence of TFEB affected lipid metabolism genes, as well as genes related to mitochondria organization and function. Although deletion of TFEB has no effect on mitochondria biogenesis in muscle cells, overexpression of TFEB enhances mitochondria biogenesis (33). In our hands, deletion of TFEB only affected mitochondria fitness in Treg cells but not in activated Th0 cells, indicating a cell-type-specific regulation of TFEB on mitochondria function. Myc is a key regulator of mitochondria structure, function, and dynamics that is activated both by TCR and IL-2 stimulation (38, 39). Consistent with this notion, Myc has been shown to be required for the homeostasis, activation, and suppressive functions of Treg cells (40). Along with Myc, other key genes in regulation of mitochondria fitness and metabolism (i.e., TrnG, TrnR, Car5b, and Cox6a) were down-regulated in Tcfeb-deficient Treg cells. This regulation seems to be Treg-intrinsic, as we obtained similar results with sorted YFP+ WT and Tcfeb-deficient Treg cells. These data, in combination with the regulation of mitochondrial fitness in Treg cells, but not in Th0 cells, suggest that the overall phenotype in the aged Cd4CreTcfebfl/fl mice could be highly likely due to the impaired Treg differentiation and function, rather than effects on T effector cells. Despite the up-regulation of genes involved in fatty acid uptake and lipid biosynthesis, fatty acid oxidation was reduced in the Tcfeb-deficient Treg cells, suggesting the defect of respiration in the absence of TFEB might be secondary to the impaired mitochondria fitness and function. In line with this, overexpression of Myc partially rescued the Treg differentiation defect in Tcfeb-deficient T cells.
In summary, our findings revealed that TFEB, in response to multiple cues to regulate Treg, functions via directly regulating differentiation, mitochondria fitness, and related metabolisms. Our study opens further avenues for understanding the metabolic adaption of Treg cells in different tissues.
Materials and Methods
A full description of the materials and methods is available in the SI Appendix.
Mice.
Tcfebfl/fl mice were generated by CRISPR/Cas9 technology and crossed with Cd4Cre mice or Foxp3YFP-Cre mice.
T Cell-Transfer Colitis.
2 × 10⁵ CD45RBhiCD25−CD4+ T cells mixed with 2 × 10⁵ WT or Tcfeb-deficient CD4+CD25+YFP+ Treg cells were transferred intraperitoneally into Rag2−/− mice.
Bone Marrow Chimera.
Sublethally irradiated CD45.1+ mice were reconstituted with a 1:1 mixture of bone marrow (BM) cells (5 × 10⁶ cells) from congenic Foxp3YFP-cre mice or Foxp3YFP-creTcfebfl/fl mice.
Treg Differentiation and Suppression Assay.
Sorted naïve CD4+ cells were stimulated with plate-bound anti-CD3/CD28 (5 µg/mL of each) in the presence of transforming growth factor-type β (5 ng/mL), hIL-2 (10 ng/mL), and anti-IL-4/IFN-γ (10 μg/mL of each) for 3 d. Fluorescent dye-labeled naïve CD4+ cells or CD8+ T cells were cultured alone or at different ratios of sorted WT or Tcfeb-deficient CD4+CD25+YFP+ Treg cells in the presence of plate-coated anti-CD3/CD28 (1 µg/mL of each) antibodies for 3 d. Cells were analyzed by flow cytometry.
TIL Isolation.
TDCLs from a KrasLSL-G12D/+; Tp53fl/fl conditional NSCLC model were injected subcutaneously into Foxp3YFP-creTcfebfl/fl and Foxp3YFP-cre mice. Tumor tissues were minced and digested with PBS containing collagenase IV and DNase I for 1 h at 37 °C. Cells were isolated by Percoll gradient centrifugation.
Statistical Analysis.
Statistical analysis was performed using GraphPad Prism software. P < 0.05 was considered significant.
Supplementary Material
Acknowledgments
This research was supported by the National Scientific Foundation of China (32070890 and 81671539 to X.-P.Y.), the Key Special Project of Ministry of Science and Technology, China (2019YFC1316200), and the National Natural Science Foundation of China (81725004 to H.L.).
Footnotes
The authors declare no competing interest.
This article is a PNAS Direct Submission.
This article contains supporting information online at https://www.pnas.org/lookup/suppl/doi:10.1073/pnas.2205469119/-/DCSupplemental.
Data Availability
All study data are included in the article and/or SI Appendix.
References
- 1.Josefowicz S. Z., Lu L. F., Rudensky A. Y., Regulatory T cells: mechanisms of differentiation and function. Annu. Rev. Immunol. 30, 531–564 (2012). [DOI] [PMC free article] [PubMed] [Google Scholar]
- 2.Sakaguchi S., et al. , Regulatory T cells and human disease. Annu. Rev. Immunol. 38, 541–566 (2020). [DOI] [PubMed] [Google Scholar]
- 3.Liston A., Gray D. H., Homeostatic control of regulatory T cell diversity. Nat. Rev. Immunol. 14, 154–165 (2014). [DOI] [PubMed] [Google Scholar]
- 4.Panduro M., Benoist C., Mathis D., Tissue Tregs. Annu. Rev. Immunol. 34, 609–633 (2016). [DOI] [PMC free article] [PubMed] [Google Scholar]
- 5.Fontenot J. D., Rasmussen J. P., Gavin M. A., Rudensky A. Y., A function for interleukin 2 in Foxp3-expressing regulatory T cells. Nat. Immunol. 6, 1142–1151 (2005). [DOI] [PubMed] [Google Scholar]
- 6.D’Cruz L. M., Klein L., Development and function of agonist-induced CD25+Foxp3+ regulatory T cells in the absence of interleukin 2 signaling. Nat. Immunol. 6, 1152–1159 (2005). [DOI] [PubMed] [Google Scholar]
- 7.Burchill M. A., Yang J., Vogtenhuber C., Blazar B. R., Farrar M. A., IL-2 receptor beta-dependent STAT5 activation is required for the development of Foxp3+ regulatory T cells. J. Immunol. (Baltimore, MD: 1950) 178, 280–290 (2007). [DOI] [PubMed] [Google Scholar]
- 8.Yao Z., et al. , Nonredundant roles for Stat5a/b in directly regulating Foxp3. Blood 109, 4368–4375 (2007). [DOI] [PMC free article] [PubMed] [Google Scholar]
- 9.Delgoffe G. M., et al. , The mTOR kinase differentially regulates effector and regulatory T cell lineage commitment. Immunity 30, 832–844 (2009). [DOI] [PMC free article] [PubMed] [Google Scholar]
- 10.Buck M. D., Sowell R. T., Kaech S. M., Pearce E. L., Metabolic instruction of immunity. Cell 169, 570–586 (2017). [DOI] [PMC free article] [PubMed] [Google Scholar]
- 11.Leone R. D., Powell J. D., Metabolism of immune cells in cancer. Nat. Rev. Cancer 20, 516–531 (2020). [DOI] [PMC free article] [PubMed] [Google Scholar]
- 12.Klysz D., et al. , Glutamine-dependent α-ketoglutarate production regulates the balance between T helper 1 cell and regulatory T cell generation. Sci. Signal. 8, ra97 (2015). [DOI] [PubMed] [Google Scholar]
- 13.Michalek R. D., et al. , Cutting edge: Distinct glycolytic and lipid oxidative metabolic programs are essential for effector and regulatory CD4+ T cell subsets. J. Immunol. (Baltimore, MD: 1950) 186, 3299–3303 (2011). [DOI] [PMC free article] [PubMed] [Google Scholar]
- 14.Beier U. H., et al. , Essential role of mitochondrial energy metabolism in Foxp3+ T-regulatory cell function and allograft survival. FASEB J. 29, 2315–2326 (2015). [DOI] [PMC free article] [PubMed] [Google Scholar]
- 15.Berod L., et al. , De novo fatty acid synthesis controls the fate between regulatory T and T helper 17 cells. Nat. Med. 20, 1327–1333 (2014). [DOI] [PubMed] [Google Scholar]
- 16.Raud B., et al. , Etomoxir actions on regulatory and memory T cells are independent of Cpt1a-mediated fatty acid oxidation. Cell Metab. 28, 504–515.e7 (2018). [DOI] [PMC free article] [PubMed] [Google Scholar]
- 17.Van den Bossche J., van der Windt G. J. W., Fatty acid oxidation in macrophages and T cells: Time for reassessment? Cell Metab. 28, 538–540 (2018). [DOI] [PubMed] [Google Scholar]
- 18.Pacella I., et al. , Fatty acid metabolism complements glycolysis in the selective regulatory T cell expansion during tumor growth. Proc. Natl. Acad. Sci. U.S.A. 115, E6546–E6555 (2018). [DOI] [PMC free article] [PubMed] [Google Scholar]
- 19.Settembre C., et al. , TFEB links autophagy to lysosomal biogenesis. Science 332, 1429–1433 (2011). [DOI] [PMC free article] [PubMed] [Google Scholar]
- 20.Settembre C., et al. , TFEB controls cellular lipid metabolism through a starvation-induced autoregulatory loop. Nat. Cell Biol. 15, 647–658 (2013). [DOI] [PMC free article] [PubMed] [Google Scholar]
- 21.Samie M., Cresswell P., The transcription factor TFEB acts as a molecular switch that regulates exogenous antigen-presentation pathways. Nat. Immunol. 16, 729–736 (2015). [DOI] [PMC free article] [PubMed] [Google Scholar]
- 22.Napolitano G., Ballabio A., TFEB at a glance. J. Cell Sci. 129, 2475–2481 (2016). [DOI] [PMC free article] [PubMed] [Google Scholar]
- 23.Puertollano R., Ferguson S. M., Brugarolas J., Ballabio A., The complex relationship between TFEB transcription factor phosphorylation and subcellular localization. EMBO J. 37, e98804 (2018). [DOI] [PMC free article] [PubMed] [Google Scholar]
- 24.Martina J. A., Chen Y., Gucek M., Puertollano R., MTORC1 functions as a transcriptional regulator of autophagy by preventing nuclear transport of TFEB. Autophagy 8, 903–914 (2012). [DOI] [PMC free article] [PubMed] [Google Scholar]
- 25.Roczniak-Ferguson A., et al. , The transcription factor TFEB links mTORC1 signaling to transcriptional control of lysosome homeostasis. Sci. Signal. 5, ra42 (2012). [DOI] [PMC free article] [PubMed] [Google Scholar]
- 26.Liu Y., Yu Y., Matarese G., La Cava A., Cutting edge: fasting-induced hypoleptinemia expands functional regulatory T cells in systemic lupus erythematosus. J. Immunol. 188, 2070–2073 (2012). [DOI] [PMC free article] [PubMed] [Google Scholar]
- 27.Navarro M. N., Cantrell D. A., Serine-threonine kinases in TCR signaling. Nat. Immunol. 15, 808–814 (2014). [DOI] [PMC free article] [PubMed] [Google Scholar]
- 28.Wei Z., et al. , DAPK1 (death associated protein kinase 1) mediates mTORC1 activation and antiviral activities in CD8+ T cells. Cell. Mol. Immunol. 18, 138–149 (2021). [DOI] [PMC free article] [PubMed] [Google Scholar]
- 29.Yang X. P., et al. , Opposing regulation of the locus encoding IL-17 through direct, reciprocal actions of STAT3 and STAT5. Nat. Immunol. 12, 247–254 (2011). [DOI] [PMC free article] [PubMed] [Google Scholar]
- 30.Yu M., et al. , Interferon-γ induces tumor resistance to anti-PD-1 immunotherapy by promoting YAP phase separation. Mol. Cell 81, 1216–1230.e9 (2021). [DOI] [PubMed] [Google Scholar]
- 31.Wei J., et al. , Autophagy enforces functional integrity of regulatory T cells by coupling environmental cues and metabolic homeostasis. Nat. Immunol. 17, 277–285 (2016). [DOI] [PMC free article] [PubMed] [Google Scholar]
- 32.Kabat A. M., et al. , The autophagy gene Atg16l1 differentially regulates Treg and TH2 cells to control intestinal inflammation. eLife 5, e12444 (2016). [DOI] [PMC free article] [PubMed] [Google Scholar]
- 33.Mansueto G., et al. , Transcription factor EB controls metabolic flexibility during exercise. Cell Metab. 25, 182–196 (2017). [DOI] [PMC free article] [PubMed] [Google Scholar]
- 34.Pastore N., et al. , TFEB and TFE3 cooperate in the regulation of the innate immune response in activated macrophages. Autophagy 12, 1240–1258 (2016). [DOI] [PMC free article] [PubMed] [Google Scholar]
- 35.Medina D. L., et al. , Lysosomal calcium signalling regulates autophagy through calcineurin and TFEB. Nat. Cell Biol. 17, 288–299 (2015). [DOI] [PMC free article] [PubMed] [Google Scholar]
- 36.Napolitano G., et al. , mTOR-dependent phosphorylation controls TFEB nuclear export. Nat. Commun. 9, 3312 (2018). [DOI] [PMC free article] [PubMed] [Google Scholar]
- 37.Ross S. H., et al. , Phosphoproteomic analyses of interleukin 2 signaling reveal integrated JAK kinase-dependent and -independent networks in CD8(+) T cells. Immunity 45, 685–700 (2016). [DOI] [PMC free article] [PubMed] [Google Scholar]
- 38.Li F., et al. , Myc stimulates nuclearly encoded mitochondrial genes and mitochondrial biogenesis. Mol. Cell. Biol. 25, 6225–6234 (2005). [DOI] [PMC free article] [PubMed] [Google Scholar]
- 39.Graves J. A., et al. , Mitochondrial structure, function and dynamics are temporally controlled by c-Myc. PLoS One 7, e37699 (2012). [DOI] [PMC free article] [PubMed] [Google Scholar]
- 40.Saravia J., et al. , Homeostasis and transitional activation of regulatory T cells require c-Myc. Sci. Adv. 6, eaaw6443 (2020). [DOI] [PMC free article] [PubMed] [Google Scholar]
Associated Data
This section collects any data citations, data availability statements, or supplementary materials included in this article.
Supplementary Materials
Data Availability Statement
All study data are included in the article and/or SI Appendix.


