Since March 1978, the drinking water community has reflected on disinfection practices in the United States every 10 years through the AWWA’s Water Utility Disinfection Survey, issued by the Disinfection Committee under the Technical and Education Council’s Water Quality and Technology Division. Looking at the results over time, trends can be seen in disinfection practices: how best practices and new technologies emerge, how evolving rules affect regulatory compliance response, and the impact of critical events (i.e., regulations, technological innovation, or societal incidents) on the disinfection of potable water supplies. This decennial survey serves as an opportunity to reflect on the production of safe drinking water as a priority and to improve disinfection practices and preferences across North America and beyond. This article discusses key findings and emerging trends from the survey; the full report and analysis are available in AWWA’s 2017 Water Utility Disinfection Survey Report (AWWA 2018).
Survey Approach
Survey Design, Delivery, and Response
In 2017, the Disinfection Committee developed the fifth disinfection survey to capture current disinfection practices and trends for utilities in the United States (AWWA 2018). The survey consisted of 180 questions grouped into 10 sections:
General Utility Information
Water Quality Data
Free Chlorine Applications
Chloramines Applications
Chlorine Dioxide Applications
Ozone Applications
Ultraviolet (UV) Applications
Compliance
Distribution Systems
Wrap Up
Unlike prior surveys, the 2017 survey was conducted entirely online. Invitations to participate in the survey were initially sent via email to more than 27,000 community water systems in the United States. After an approximately 2% initial response rate and a quality assurance process that included removal of redundant responses from the same utilities, there were 375 unique and responsive systems that provided data for the final analysis.
Survey System Descriptions
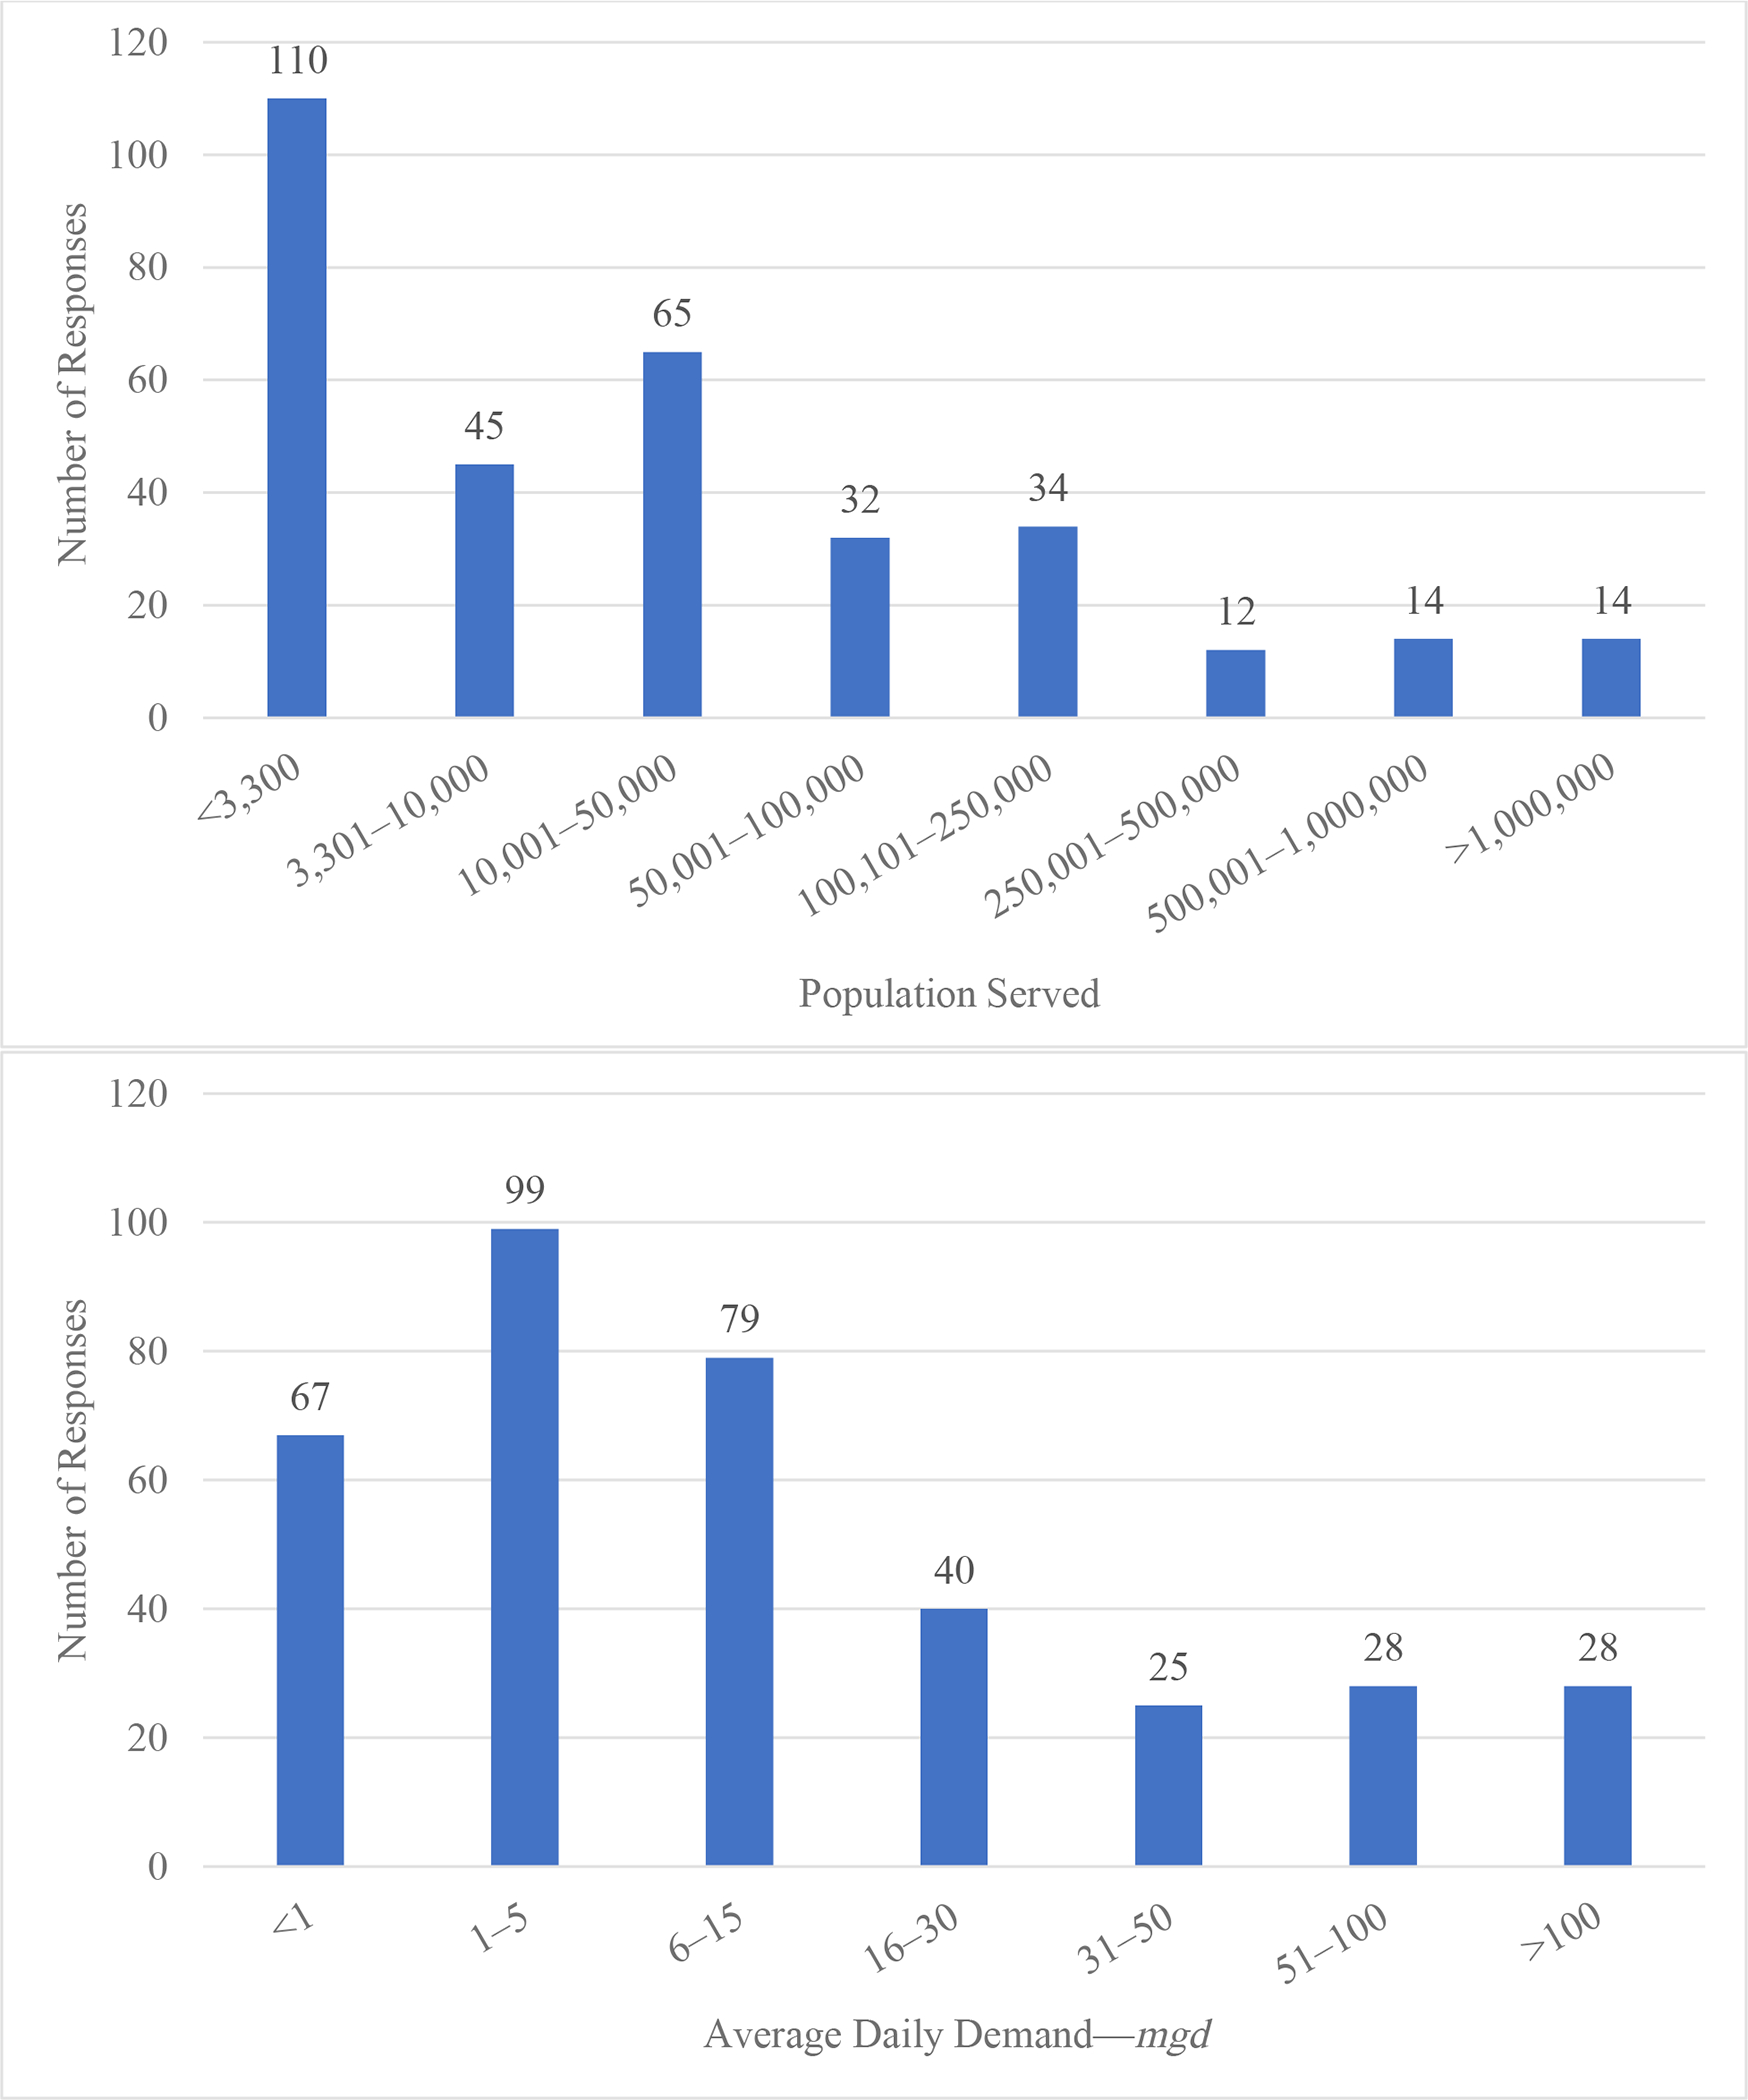
The 375 systems responding to the survey were distributed across 44 states and one US territory. Notably, there were more responses from smaller systems (serving <10,000 people) in 2017 (47.5%) compared with prior iterations (31.7% in the 2007 survey). As Figure 1 shows, the majority (67.5%) of responding systems served fewer than 50,000 people and 67% reported average daily demands below 15 mgd. However, this distribution still may overemphasize larger systems since there are far more smaller systems in the US than larger systems. As reported in a previous survey, approximately 83% of community water systems in the United States in 2007 served populations of 3,300 people or fewer (USEPA 2008). In terms of raw water sources, out of 363 responses describing their source water(s), 240 systems indicated that some portion of their average daily demand consists of surface water or groundwater under direct influence (GWUDI), while 191 systems reported at least some use of groundwater, and 25 reported at least some use of purchased water.
Figure 1.

Respondent Distribution Based on Population Serveda and Total Average Daily Demandb
Source: AWWA 2018
an = 326
bn = 366
Disinfection Technologies: Benefits, Challenges, and Barriers to Usage
The 2017 survey focused on the disinfection technologies that were being used or were being considered by the respondents. Questions were included in the survey to detail the usage, benefits, challenges, drivers, and barriers to adoption of individual disinfection technologies.
Technologies
Chlorine
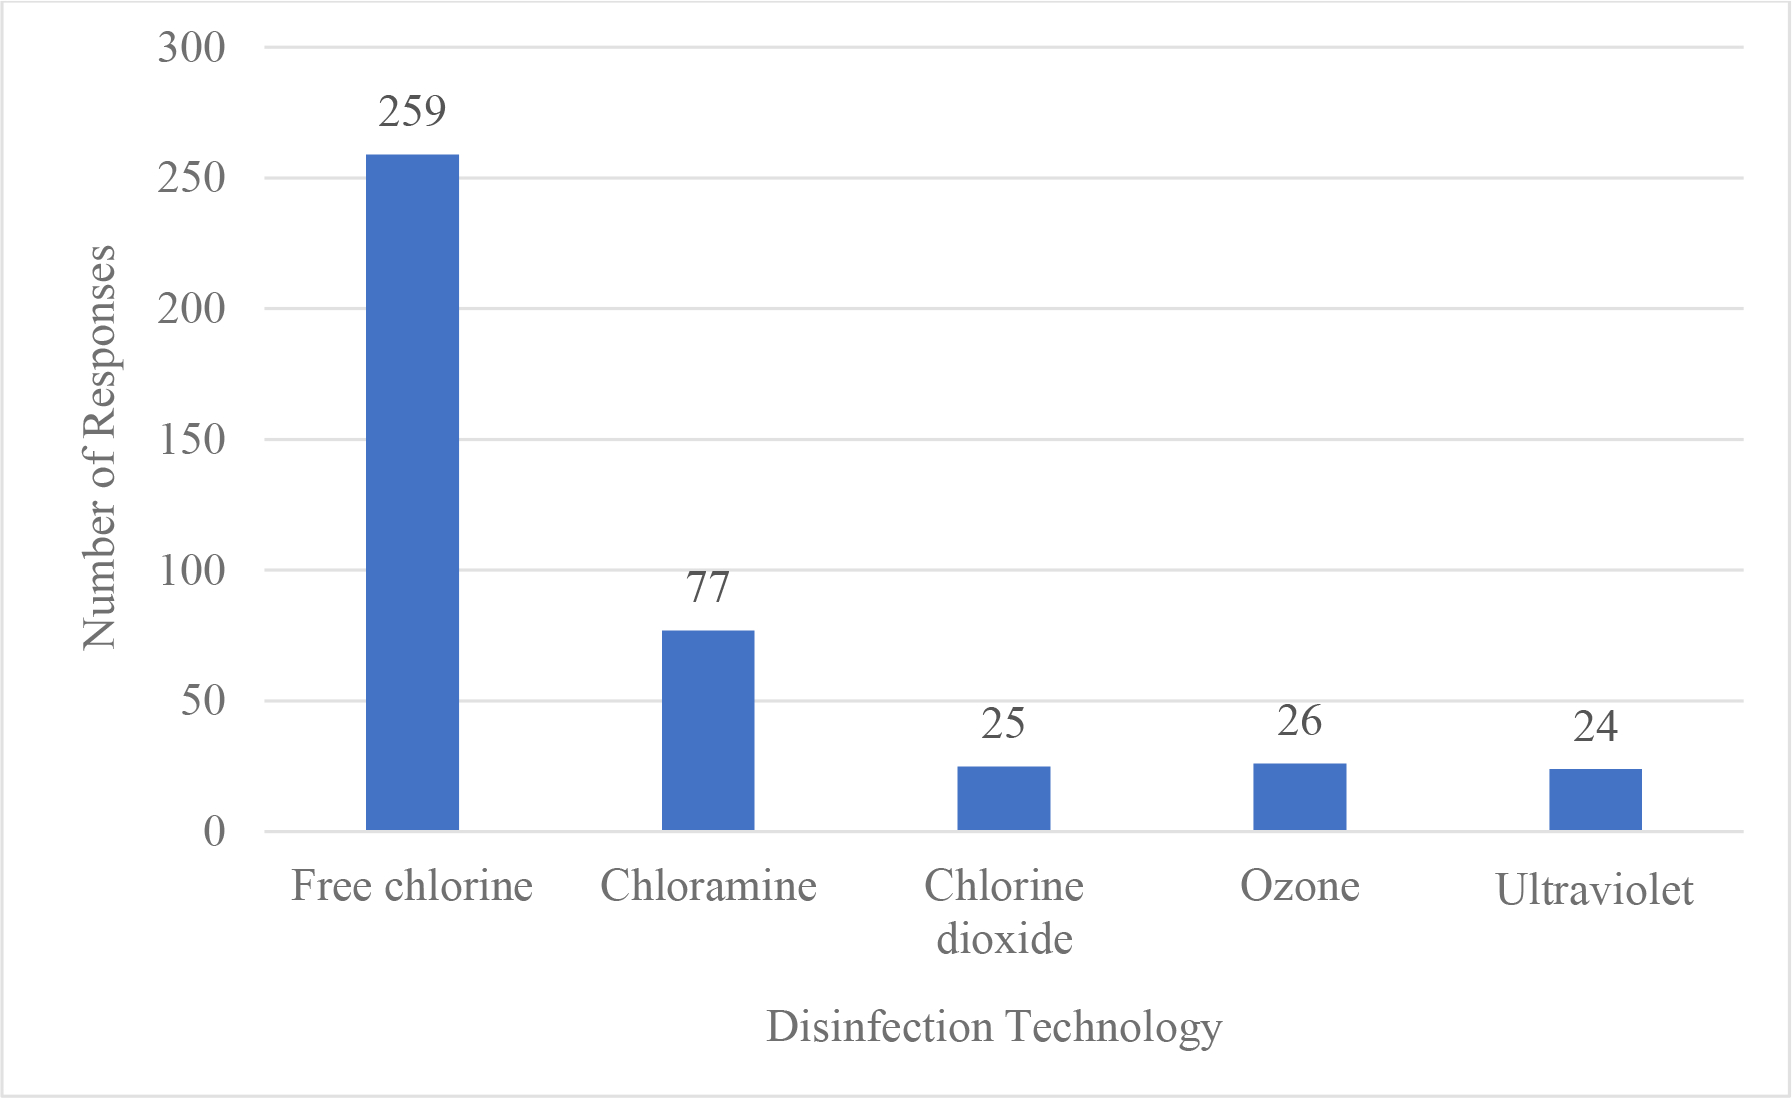
Figure 2 shows the number of responding utilities that use each of the different disinfection technologies. Chlorine is still by far the most commonly used disinfectant in drinking water treatment plants in the United States (70% of the responding systems). More than half these systems use bulk liquid sodium hypochlorite, making it the most prevalent form used. Less than half of the systems (48%) use chlorine gas and approximately 12% use onsite generation of sodium hypochlorite.
Figure 2.

Disinfection Technologies Used by Respondentsa
Source: AWWA 2018
an = 411
In the past 10 years, more than 35% of the systems have switched from using chlorine gas to sodium hypochlorite, primarily for safety reasons. For the systems using bulk sodium hypochlorite, 90% of respondents purchase it at a concentration between 10% and 15% trade strength, and more than half (55%) store bulk sodium hypochlorite for between seven and 30 days. In addition to primary disinfection, chlorine is also used by the respondents to prevent biological growth in the filters, oxidize iron and manganese, and control algae and zebra mussels. As a result, chlorine is applied at different points in a drinking water treatment train, including raw water, preclarification, prefiltration, pre- or post-clearwell, as well as in the distribution system.
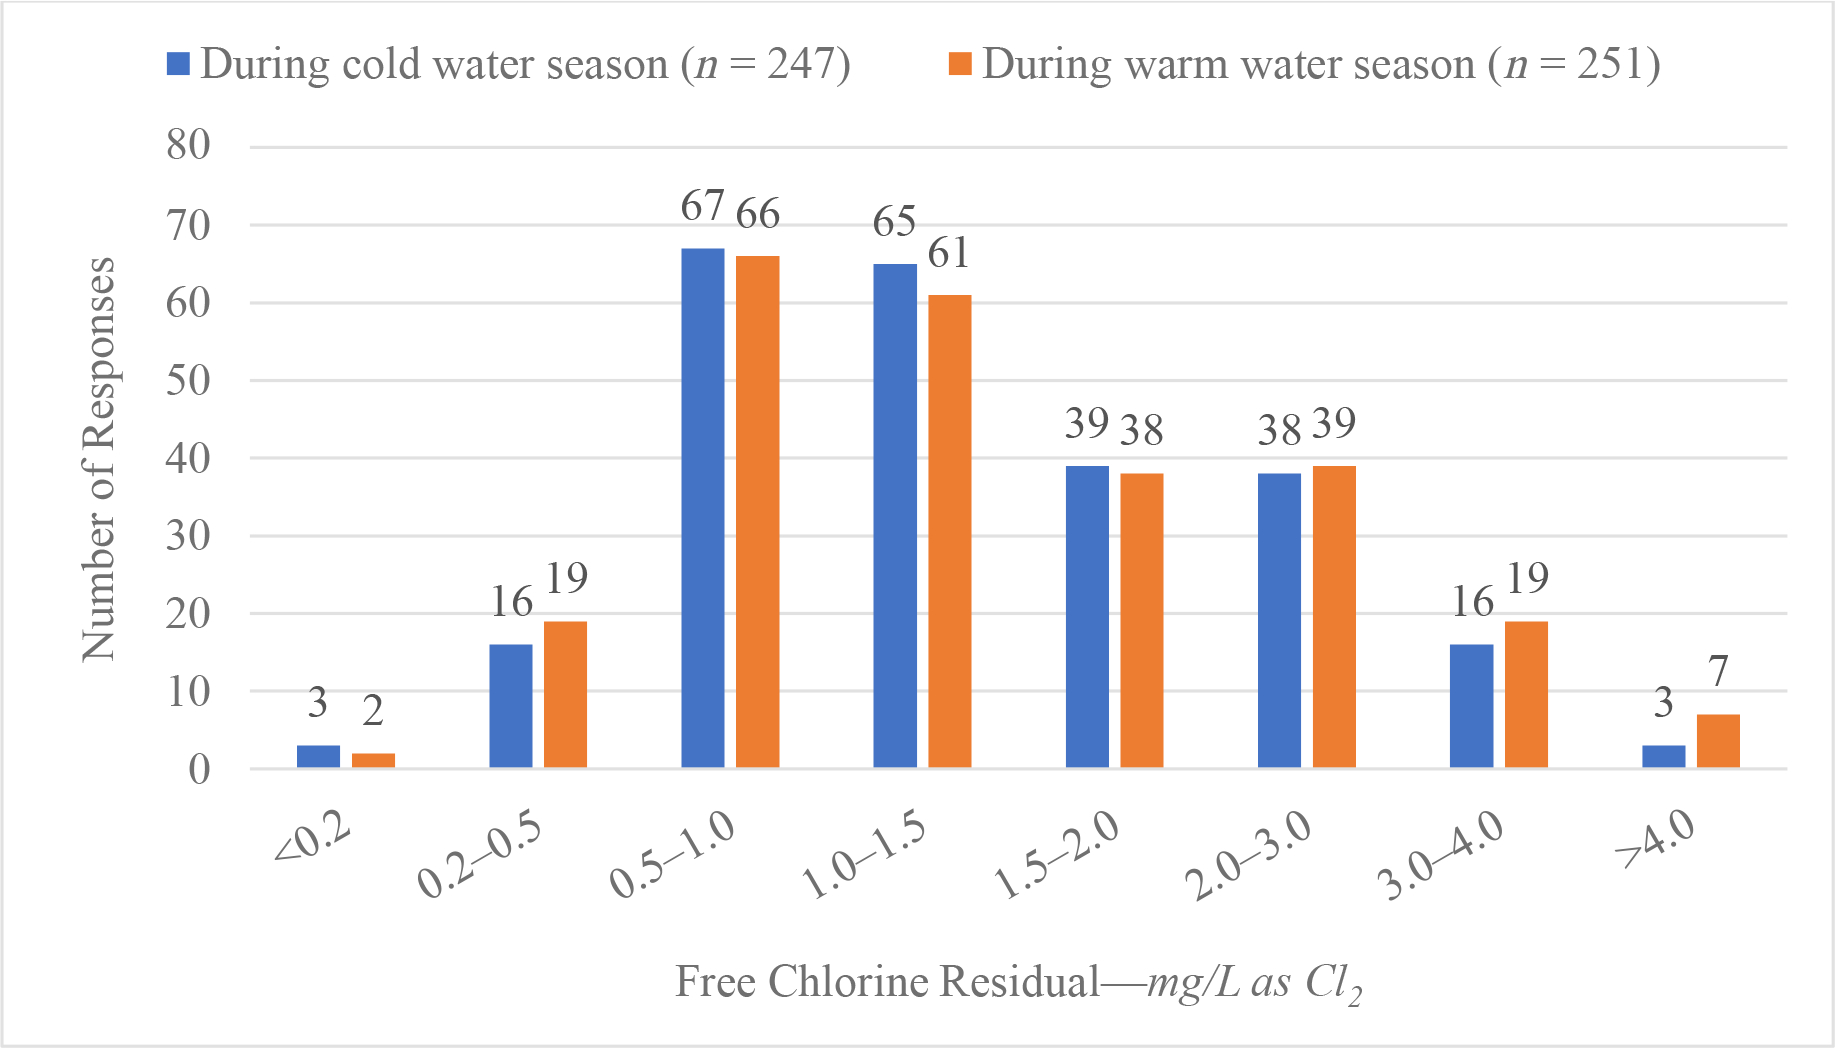
Figure 3 indicates the target chlorine residuals leaving the clearwell or contact basin reported by systems using free chlorine for primary disinfection. In most instances, it appears that systems do not significantly change their target residual on a seasonal basis, at least to the extent that it would shift to a different target residual bin used within the survey (i.e., greater than 0.5 mg/L change) (AWWA 2018, p. 30).
Figure 3.

Target Chlorine Residual Leaving Clearwell/Contact Basina
Source: AWWA 2018
aFor systems using free chlorine for primary disinfection in cold and warm seasons
When asked how often they have difficulty meeting their chlorine residual targets for primary disinfection, 65% of respondents reported that they never have difficulty. However, more than one-quarter of the respondents indicated that they occasionally have difficulty in meeting the chlorine residual target. Approximately one out of 20 respondents indicated that they frequently, often, or always have difficulty meeting target chlorine residuals. The one system that always has difficulty meeting its target chlorine residuals is, not surprisingly, located in a warm-weather location (Florida), but the remaining systems that have difficulty meeting their targets are distributed across the West Coast, South, Midwest, and Rocky Mountains (AWWA 2018, p. 32).
Chloramines
About 20% of the survey respondents (77 utilities) indicated that they use chloramines in their system. More than half (52%) of the respondents have been using chloramines for longer than 20 years, with most (89%) reporting chloramine usage for at least 10 years. This chronology corresponds to the 1998 release of the US Environmental Protection Agency’s (USEPA’s) initial Disinfectants and Disinfection Byproducts Rules (D/DBPRs) as using chloramines for secondary disinfection minimizes the continued production of regulated disinfection byproducts (DBPs) in the distribution system.
Chlorine Dioxide
About 9% of the respondents (25 utilities, primarily surface water systems) indicated they currently use chlorine dioxide and for a variety of purposes. About two-thirds of these systems use chlorine dioxide for oxidation of iron and manganese, while almost half of them also use it to minimize taste and odor (T&O) issues. As a result, most systems apply chlorine dioxide directly to the raw water itself. About 72% of the systems using chlorine dioxide have done so for more than 10 years.
Ozone
Approximately 10% of the respondents (26 systems) indicated that they use ozone in their treatment plant(s). Ozone was indicated to be in use for several reasons, and about 85% of the systems use it to tackle T&O issues. More than two-thirds of the systems also use ozone for DBP precursor removal. As a result, more than half of the systems that use ozone apply it directly to the raw water, and the majority of the remainder apply it before filtration. About 85% of the systems using ozone have done so for more than 10 years.
Ultraviolet Disinfection
About 10% of the respondents (24 utilities) use ultraviolet (UV) disinfection. Unlike ozone and chlorine dioxide, UV treatment often follows filtration, with about 50% of the systems treating combined filter effluent and about 25% treating individual filter effluent; the remaining systems reported not having filtration (typically groundwater) or did not specify. In contrast to the previously discussed disinfectants, half of these utilities indicated that UV had been installed only within the past five years.
Benefits and Challenges
One of the goals of the survey was to identify the major benefits and challenges associated with each disinfection technology. Table 1 summarizes the benefits and challenges respondents identified for each technology. Not surprisingly, the pros and cons of chlorine-based disinfectants generally differed from those for ozone and UV. Chlorine was more associated with DBP formation concerns and ease of use, while ozone and UV users reported more monitoring and maintenance complexity challenges and low DBP and multiple-objective benefits.
Table 1.
Pros and Cons Identified for Each Disinfectant Type
| Free Chlorine | Chloramines | Chlorine Dioxide | Ozone | Ultraviolet | |
|---|---|---|---|---|---|
| Benefits | |||||
| Availability of product | X | X | X | ||
| Reliability | X | X | X | X | |
| Consistent residual | X | X | |||
| Ease of use | X | X | X | ||
| Ability to meet DBP objectives | X | X | X | X | |
| Ability to meet multiple objectives | X | X | X | ||
| Taste and odor control | X | ||||
| Color removal | X | ||||
| Ensuring disinfection compliance | X | ||||
| Cryptosporidium inactivation | X | ||||
| Chemical free process | X | ||||
| Small footprint | X | ||||
| Challenges | |||||
| Uncertainty over future regulations | X | X | |||
| Risk management | X | ||||
| Maintenance of storage and feed systems | X | ||||
| Nitrification | X | ||||
| Balancing DBPs/simultaneous compliance | X | X | |||
| High operations and maintenance costs | X | X | |||
| Operator safety | X | ||||
| Equipment issues/reliability | X | ||||
| Online monitoring/instrumentation | X | ||||
| Significant maintenance requirements | X | ||||
| Training of operators | X | X | |||
DBP—disinfection byproduct
Drivers and Barriers to Adoption for Free Chlorine Alternatives
As discussed earlier, chlorine was the most widely used disinfectant in the United States. However, safety, risk management, and DBP issues are leading some utilities to consider alternatives. Additional challenges include uncertainty over future regulations, the maintenance of storage and feed systems, and the need for maintaining a sufficient residual in the distribution system.
Chloramines, chlorine dioxide, ozone, and UV are alternatives to free chlorine, and the survey explored their use further, including what drivers influence the switch to an alternative disinfectant and any barriers to adopting the specific technologies.
Chloramines
There appears to be little interest among systems not currently using chloramines to convert to this alternative. Only four systems indicated they were considering or planning a switch to chloramines, with an additional nine stating they were uncertain. While there is a consensus that chloramines represent a good option for controlling chlorination DBPs and maintaining a more persistent residual in the distribution system, the results imply that many did not believe these benefits outweighed the disadvantages or that the respondents were compliant with current microbial and DBP regulations and are well positioned to comply with future requirements. Respondents were also concerned over nitrification, the impact of chloramines on corrosion, and any public perception issues associated with the use of chloramines.
Chlorine Dioxide
Similar to chloramines, no significant growth was indicated in the use of chlorine dioxide. Only two systems responded that they were considering or planning a switch to chlorine dioxide, with an additional nine systems uncertain whether chlorine dioxide would be used at their facility in the future. The interest in chlorine dioxide is driven by the need to control chlorination DBPs and, because of its oxidation properties, the ability to meet multiple treatment objectives beyond disinfection, including primarily iron and manganese oxidation, and T&O control. However, the survey results show chlorine dioxide adoption is limited as a result of three significant barriers: cost, safety/risk management, and formation of the regulated byproduct chlorite.
Ozone
Twelve systems indicated they are considering or planning a switch to ozone, while eight additional systems were uncertain whether ozone would be used at their facility in the future. The attractiveness of ozone is driven by its abilities to reduce chlorinated DBPs and meet multiple treatment objectives such as iron and manganese oxidation, T&O control, micropollutant removal, and partial oxidation of organics before biofiltration. However, cost, safety/risk management, and formation of the regulated byproduct bromate are significant restraints in its adoption.
Ultraviolet Disinfection
Of all four alternative technologies, UV is the most popular among systems considering switching or adding disinfectants. Of the respondents, 22 systems indicated they are considering or planning a switch to UV, while 13 additional systems were uncertain whether UV would be used at their facility in the future. The major driving force behind interest in UV technologies is the need to add a barrier against Cryptosporidium and compliance with USEPA’s Long Term 2 Enhanced Surface Water Treatment Rule (LT2ESWTR). However, on the basis of survey responses, the perceived cost associated with UV treatment has restrained utilities from adding this technology.
Historical Trends: Disinfection Then and Now
While there have been significant changes in disinfection practices over the last 40 years, the level of precision associated with presenting these results can be challenging. Even though the thematic areas have not changed greatly across the five surveys the Disinfection Committee has conducted, the ability to compare data from one survey with data of another is limited because of how the answers were recorded (i.e., quantitative versus qualitative responses), changes in questions over time, and access to older data that were collected when recordkeeping was more labor intensive. Data used within this analysis were compiled from the previous disinfection committee reports published in Journal AWWA, Small Systems reports, and/or individual survey reports (AWWA 2018, 2008a, 2008b, 2000a, 2000b, 1992, 1983).
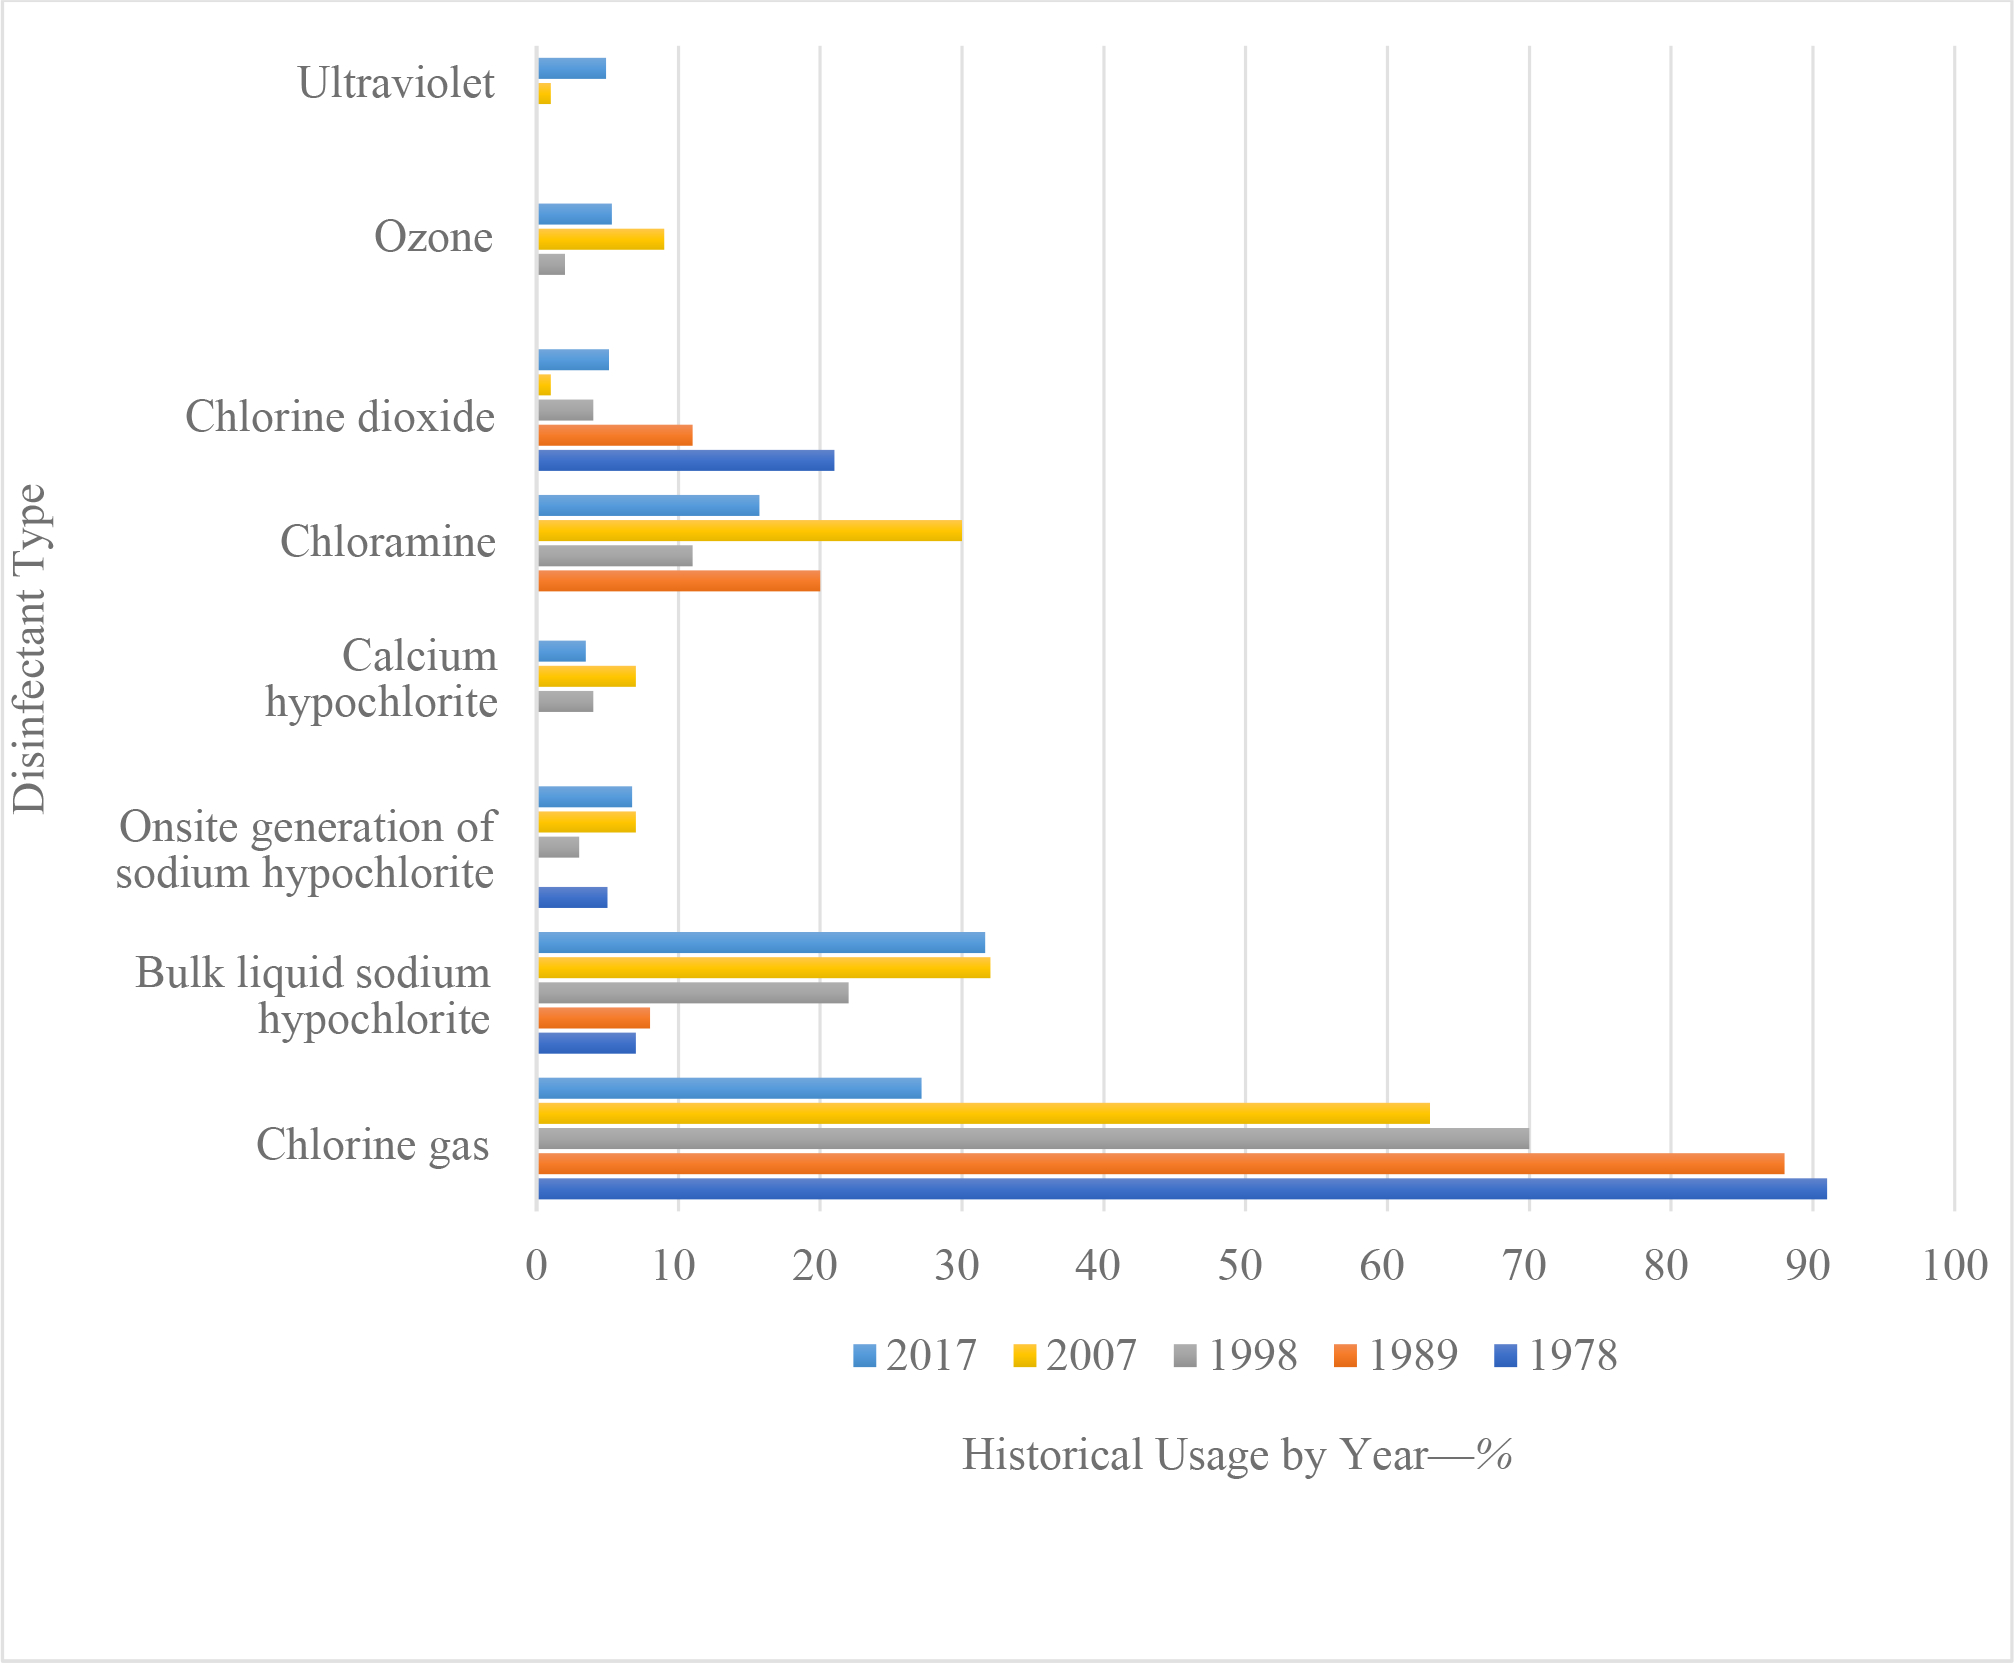
The primary disinfection method in the United States still remains chlorination (Figure 4), with approximately 70% of respondents reporting use of free chlorine as their primary disinfectant. The 2017 survey was the first time that the use of liquid sodium hypochlorite was reported to be more widely used than chlorine gas. As noted previously, this trend is likely attributed to heightened security concerns in a post-9/11 era as well as other operational safety considerations that the industry has faced since the first survey in 1978. It is likely this trend will continue over the next decade. The amount of chlorine used has also dropped over at least the last decade, and comparison of 2007 and 2017 data indicates that D/DBPR compliance has improved.
Figure 4.

Historical Disinfectant Usage, 1978–2017
The second most popular disinfection practice continues to be chloramination; it is primarily used as a secondary disinfectant, driven in part by the D/DBPRs. Recent technological advances in UV disinfection coupled with the release of the LT2ESWTR places UV treatment for the first time on the same magnitude of usage as ozone and chlorine dioxide (Table 2). Since the last survey, the overwhelming trend is the adoption of UV technology (79%) in the past 10 years.
Table 2.
Years Since Alternative Disinfection Practice Implementation
| Disinfection Practice | Number of Responses | Years of Implementation–% | ||
|---|---|---|---|---|
| <5 | 5–10 | >10 | ||
| Chloramines | 78 | 8 | 3 | 89 |
| Chlorine dioxide | 25 | 20 | 8 | 72 |
| Ozone | 26 | 11 | 4 | 85 |
| Ultraviolet | 24 | 50 | 29 | 21 |
Trending Concerns Mirror the Regulatory and Water Quality Drivers of the Times
Analyzing the longitudinal data provides insight into the major concerns that may have driven industry decisions. Although the five AWWA Disinfection Committee surveys have come from the same industry, there is no way to control for the specific utility respondents. However, it is useful to analyze the major conclusions from each survey to gain an understanding of the industry perspective during a particular period to see how it subsequently evolved. These comments can be reviewed in light of regulatory changes to “balance maintenance of adequate disinfection with minimization of DBP concentrations in distributed water” (AWWA 1992, p.128) such as the Surface Water Treatment Rule, D/DBPR Stages 1 and 2, Filter Backwash Rule, and the evolution of water utility practices.
1978 Survey
One-third of respondents indicated that there was only one point of application—in the distribution system.
The vast majority (>85%) of respondents used surface water prechlorination.
The majority of respondents (58%) made no attempt to differentiate between free and total chlorine residuals.
Chlorine contact times were less than 12 minutes in 25% of the systems.
1989 Survey
To reduce formation of total trihalomethanes (TTHMs), the most significant change by respondents was to alter the chlorine application point and dose.
Many respondents had instituted changes in coagulation to minimize TTHM formation.
A sizable fraction (20%) of respondents reported adding ammonia and “some” (~2%) applied chlorine dioxide as part of their TTHM minimization program.
Major infrastructure investments to reduce TTHMs, such as granular activated carbon and ozone, had not been widely adopted.
1998 Survey
The most frequent problems included maintenance of a disinfectant residual in the distribution system (~20%) and corrosion or corrosion deposits (~10%).
Fifty percent of respondents said they were contemplating disinfection changes to meet future regulations.
Most large systems reported being capable of meeting the Stage 1 D/DBPR limits.
This was the first committee report to discuss recent advances in UV disinfection and membrane filtration and their “potential to greatly alter disinfection practices.”
2007 Survey
Chlorine was still the most popular disinfectant.
This was the first committee report to discuss a “possible emerging DBP”: N-nitrosodimethylamine.
Water quality data supported the fact that the surveyed systems were meeting current D/DBP regulatory requirements, although it was noted that survey participation may be skewed to more compliant respondents than those in violation.
2017 Survey
Free chlorine was the most widely used disinfectant (~70% of respondents), but bulk sodium hypochlorite replaced chlorine gas as the most popular chlorine type.
Overall chlorine dose appeared to have decreased, most likely as a result of DBP concerns.
Reported use of UV disinfection grew following implementation of LT2ESWTR.
Cost was the primary barrier respondents stated for not adding ozone or UV.
Survey Summary
The results of this survey indicate that free chlorine is clearly the most widely used disinfectant. Chloramines were somewhat commonly used, with approximately 16% of respondents using it. Chlorine dioxide, ozone, and UV disinfection were each used by less than 7% of respondents. The data indicate that the disinfection market continues to change, and more systems reported starting UV treatment within the past five years than any other alternative disinfection technology. Further, the potential for future growth in UV adoption appears to be greater than chlorine dioxide and ozone, while chloramine usage is predicted to be static.
One limiting factor of the survey is that it is difficult to link data over time. Although anonymity is important for survey analysis, future surveys should continue to request the public water system identification number from all respondents to allow disinfection trends to be more accurately tracked over time. Similar improvements are expected from further standardization of the questionnaire for future efforts, and future analysis of the effects of changing regulations, technologies, and public preferences on disinfection practices. The 2017 Water Utility Disinfection Survey was successful in building the long-term knowledge base for disinfection practices, and readers are encouraged to review the comprehensive results of the survey as detailed in AWWA’s 2017 Water Utility Disinfection Survey Report (AWWA 2018).
Key Takeaways.
Every 10 years, AWWA releases a survey of disinfection practices in the water sector; taken together, these surveys frame the evolution of potable water disinfection.
The most recent survey was conducted in 2017; the report, published in 2018, summarized trends, advantages, and challenges in using the numerous available disinfection technologies.
As common as chlorine is for disinfection, its use also comes with challenges. The 2017 survey examined utilities’ use of alternative disinfectants.
Footnotes
About the Authors
The following Disinfection Committee members served as contributing authors for this article: Scott Alpert (Hazen & Sawyer), Erin D. Mackey (Brown & Caldwell), Jeffrey A. Starke (Marquette University), Damon Roth (Brown & Caldwell), Kim Ervin (Jacobs), Alexander Gorzalski (Hazen & Sawyer), Gary M. Lohse (De Nora Water Technologies), Bertrand Dussert (formerly of Xylem Inc.), Richard Weisman (US Environmental Protection Agency), Lauren Wasserstrom (Greater Cincinnati Water Works), Ashley Waldron (Jacobs), and Partiban Raja (Jacobs). Scott Alpert is the corresponding author and can be reached at salpert@hazenandsawyer.com.
References
- AWWA. 2018. 2017 Water Utility Disinfection Survey Report. AWWA, Denver. [Google Scholar]
- AWWA. 2008a. Journal AWWA. 100:10:76. 10.1002/j.1551-8833.2008.tb09748.x [DOI] [Google Scholar]
- AWWA. 2008b. Journal AWWA. 100:11:110. 10.1002/j.15518833.2008.tb09778.x [DOI] [Google Scholar]
- AWWA. 2000a. Journal AWWA. 92:5:24. 10.1002/j.1551-8833.2000.tb08941.x [DOI] [Google Scholar]
- AWWA. 2000b. Journal AWWA. 92:5:32. 10.1002/j.1551-8833.1971.tb02591.x [DOI] [Google Scholar]
- AWWA. 1992. Journal AWWA. 84.9:12. 10.1002/j.1551-8833.1992.tb07434.x [DOI] [Google Scholar]
- AWWA. 1983. Journal AWWA. 75:1:51. 10.1002/j.1551-8833.1983.tb05058.x [DOI] [Google Scholar]
- USEPA (US Environmental Protection Agency). 2008. Factoids: Drinking Water and Ground Water Statistics for 2007. Office of Water (4606M; ). 816-K-07-004. [Google Scholar]


