Abstract
In the present work, heat reflux extraction with ethanol/water (80:20; v/v) as the solvent was used to extract antioxidants from Myrmecodia pendans. The crude extract (CE) was fractionated using hexane and ethyl acetate. Ethyl acetate fraction (EAF) and aqueous fraction were collected. Antioxidant activity against 1,1-diphenyl-2-picrylhydrazyl-radical radical and ferric reducing power of the CE, EAF, and aqueous fraction were evaluated. EAF showed comparable antioxidant activity against 1,1-diphenyl-2-picrylhydrazyl-radical radical and ferric reducing power to those of the CE. UV/visible, liquid chromatography/electrospray ionization/tandem mass spectrometry, and high-performance liquid chromatography were employed for identifying the major antioxidant compounds in the EAF. Three major phenolic compounds (rosmarinic acid, procyanidin B1, and polymer of procyanidin B1) were identified. The first two compounds were confirmed and quantified by high-performance liquid chromatography using authentic standards, but confirmation of the third compound was hampered by a lack of commercial standard. Concentrations of rosmarinic acid and procyanidin B1 in the EAF were found to be 20.688 ±1.573 mg/g dry sample and 3.236 ±0.280 mg/g dry sample, respectively. All these three compounds are reported for the first time in sarang semut.
Keywords: antioxidant, high-performance liquid chromatography/tandem mass spectrometry, Myrmecodia pendans, reducing power
1. Introduction
Oxidative stress is believed to be a significant contributing factor to the pathology of atherosclerosis, cancer, and tissue damage in rheumatoid arthritis, as well as neurodegenerative diseases and aging [1]. Medicinal plants are rich in antioxidants such as polyphenols, and vitamins A, C, and E, which are necessary for maintaining good health and useful for therapeutic purposes against various diseases [2–4]. Antioxidants are essential to preserve the biological system from damage by free radicals. Nowadays, there is a noticeable interest in antioxidants, especially in those that can prevent the presumed deleterious effects of free radicals in the human body [1]. Oxidation is a major limiting factor of the shelf life of lipid-containing food products. Oxidation is a chain reaction, i.e., once started, the reaction accelerates the oxidation of sensitive substances [5].
Numerous studies have focused on obtaining antioxidants from natural sources. Researches have been promoted by the need to find natural substitutes for synthetic antioxidants, suspected to be potentially toxic [6]. Polyphenols are the most abundant antioxidants in the human diet, are common constituents of foods of plant origin, and are widespread constituents of fruits, vegetables [7,8], cereals, olive, dry legumes, chocolate, and beverages, such as tea, coffee, cocoa, and wine [9].
In natural sources, polyphenols exist as complex mixtures and their composition is highly variable with respect to amount and quality; as a consequence, the analytical profile (qualitative and quantitative) is very important for standardization of herbal drugs containing polyphenols as well as for monitoring the changes in food caused by oxidation. Antioxidant activities of flavonoids have attracted extensive attention [10]. Flavonoids are ubiquitous in plants and are known as components (natural pigments) of fruits and vegetables [3].
Sarang semut (Myrmecodia pendans) is widely distributed in equatorial region of the world. It is traditionally used as a remedy against ulcer, hemorrhoid, nosebleed, backache, allergy, uric acid disorder, stroke, coronary heart problem, total blood count, tumor, cancer, and lactagogum. The potent part of the plant is its hypocotyl, which is usually boiled in water and the liquid is used as the remedy [11].
In our previous study, sarang semut was found to be a rich source of phenolic compounds. Five flavonoids were identified using the high-performance liquid chromatography (HPLC)/UV detection method and by comparing with authentic standards [12]. Even though HPLC/UV is the most frequently used technique for the separation and detection of phenolic compounds in plants, some compounds in theextract of sarang semut could not be identified by the HPLC/UV technique. Sometimes, limited by the availability of authentic standards, identification of flavonoid peaks in chromatograms may be incomplete. Fortunately, modern technology of mass spectrometry (MS) facilitates the identification of suspicious peaks [13]. Identification of these unknown compounds can contribute to a better understanding of the role of sarang semut as a cure to many diseases.
The objective of this work was to identify the major antioxidant compounds present in the ethyl acetate fraction (EAF) of the extract of sarang semut. A combination of analytical techniques [UV/visible (Vis), HPLC/tandem mass spectrometry (MS/MS), and HPLC/UV] was employed to identify and quantify the unknown antioxidants. The compounds that were identified by the aforementioned analytical techniques were also compared with data reported in literature.
2. Materials and methods
2.1. Sample
The plant material used in this study was obtained from a traditional medicine plant store in Wamena, Papua, Indonesia. The plant sample was washed with running tap water and then rinsed by distilled water to remove any adsorbed contaminant. The cleaned sample was chopped and placed in an oven at 40°C until a constant weight was obtained. The dry material was ground in a dry mill blender, sieved (120 meshes), and collected.
2.2. Chemicals
Ethanol (95%) and methanol (HPLC grade) were obtained from ECHO (Miaoli, Taiwan). Acetonitrile and acetic acid were purchased from Sigma-Aldrich, China, and Sigma-Aldrich, Spain, respectively. Reagents including 1,1-diphenyl-2-picrylhydrazyl-radical (DPPH), potassium hexacyanoferrate, gallic acid, ascorbic acid, rosmarinicacid (96%), and procyanidin B1 (98%) were supplied by Sigma-Aldrich (St. Louis, MO, USA).
2.3. Extraction procedure
Water and aqueous mixtures of ethanol, methanol, and acetone are commonly used to extract plant materials [14]. Methanol, ethanol, aqueous methanol, and aqueous ethanol at different proportions were investigated as solvents for extracting antioxidants, and finally ethanol/water (80/20) was chosen as the extraction solvent for this particular plant sample [12]. Other extraction parameters were adopted from the report of Biesaga [15].
A dry sample (5 g) was soaked in 50 mL ethanol/water (80/20, v/v) at 70°C twice, each for 3 hours. The resulting supernatants were combined and filtered through Whatman number 2 filter paper to obtain the crude extract (CE). Ethanol in the CE was removed by evaporation at 60°C under reduced pressure. The aqueous residue was fractionated using hexane to remove fats and chlorophyll, followed by using 50 mL ethyl acetate twice. The two EAFs were pooled and dried under vacuum at 45°C. The aqueous fraction (AQF) was dried in a Labconco freeze dry system (model 7670520; Labconco, Kansas City, MO, USA). A known mass of dried extract (CE, EAF, or AQF) was dissolved in methanol to evaluate its antioxidant activity against DPPH radical and ferric reducing power.
2.4. Determination of antioxidant capacity
Free radical scavenging activity of the extract (CE, EAF, or AQF) was determined by DPPH assay according to the procedure described by Porgali and Büyüktuncel [16]. Briefly, 0.5 mL diluted sample solution (50–300 μg/mL dry sample) was added to DPPH radical methanolic solution (0.5 mL, 0.2 mM) to a final volume of 1 mL. Ascorbic acid and gallic acid solutions (50–300 μg/mL) were also prepared for two different experiments. Absorbance of the extract, ascorbic acid, and blank at 520 nm was determined after 40 minutes of incubation. For each sample, methanol was taken as the blank to correct any background absorbance. The effective inhibition was calculated as follows:
| (1) |
where A0 and At are the absorbance of the control solution and the sample test solution, respectively.
Effective inhibition of the DPPH radical was measured at various concentrations of the extract (CE, EAF, and AQF), pure compounds (rosmarinic acid and procyanidin B1), and standards (ascorbic acid and gallic acid). DPPH radical at an initial concentration of 0.2 mM was taken as the control solution.
2.5. Determination of ferric reducing antioxidant power
The ferric reducing power of sample solutions was determined according to Firuzi et al [17] and Basma et al [18], with some modifications. One-half milliliter of test solution (50–300 μg/mL) in methanol was mixed with phosphate buffer (0.2 mL, 0.2 M, pH 6.6) and potassium hexacyanoferrate [K3Fe (CN)6] (0.3 mL, 1%). The mixture was incubated at 50°C for 25 minutes and then centrifuged (15 min, 4000× g). Finally, the absorbance was measured at 595 nm. Sample-free mixture was used as the blank, whereas the Fe (III) reduction power of ascorbic acid was also determined and used for comparison.
2.6. UV/Vis spectrophotometer scanning
The authentic standards and sample solution were scanned by a UV/Vis spectrophotometer (UV-550; Jasco, Japan) in the range 200–700 nm to inspect their characteristic absorption region.
2.7. HPLC–MS/MS analysis
The EAF of the plant extract, which showed strong antioxidant activity and high ferric reducing power, was considered for further analysis. The HPLC–MS/MS technique provides important advantages because of the combination of the separation capability of liquid chromatography (LC) and the power of MS as an identification and confirmation tool [19]. MS provides information about the molecular mass and fragmentation pattern of the analyte [20]. In this study, MS data were acquired from a 4000 QTRAP HPLC–MS/MS system (AB SCIEX 4000 QTRAP LC/MS/MS, Framingham, MA, USA) in the negative ionization mode. MS/MS experiments were performed in order to determine characteristic patterns of fragmentation of molecules. The mass spectra were acquired in the mass range of 50–600.
2.8. HPLC–UV analysis
Many studies used CEs for fast identification and determination of secondary metabolites [21]. To reduce the complexity of the chromatogram, EAF was used for HPLC analysis in this study. The HPLC system used includes a Luna 5U-C18 (2) 100A column (250 mm × 4.5 mm, 5 μm) plus a Jasco quaternary gradient pump (pu-2089) plus a Jasco UV-2077 4λ intelligent. The mobile phase used had two components: A (water with 1% acetic acid) and B (acetonitrile–methanol–acetic acid, 24:75:1, v/v/v). The gradient solvent program was designed as follows: 1 minute 5% B, 10–20 minutes 10% B, and 20–40 minutes 15% B for 40-minute acquisition time. An aliquot (20 μL) was injected into the HPLC system coupled with a UV/Vis detector and eluted at room temperature at a constant flow rate of 1.0 mL/minute. Standards of compound “a” and compound “b” were analyzed for peak comparison. Finally, the quantity of the two compounds were determined from the EAF using regression equation:
| (2) |
where x is the concentration and y is the peak area percentage of standard compounds. The linearity was established by the coefficient of determination (R2). Slope, intercept, R2, and other statistical calibration lines were calculated using Microsoft Excel version 10.0.
3. Results and discussion
3.1. Determination of antioxidant capacity and ferric reducing power
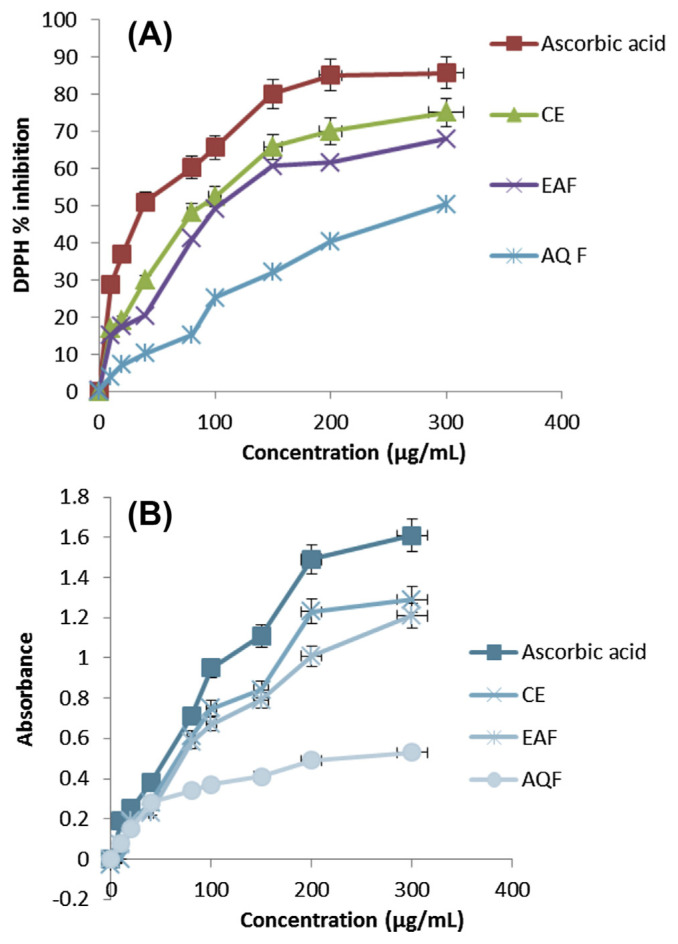
The conventional DPPH scavenging capacity and ferric reducing power assays were used to screen the potential antioxidant activity of various fractions of the plant extract. The relatively stable DPPH radical has widely been used to test the ability of a compound to act as a free radical scavenger or a hydrogen donor, and thus to evaluate its antioxidant activity. Here, the DPPH antioxidant activities of the CE, EAF, and AQF were used to determine the antioxidant concentrations in the test sample. The reducing power of all extracts increased with increasing concentration, i.e., plant extracts quenched DPPH free radical in a dose-dependent manner, as shown in Fig. 1A. The DPPH inhibition ability of extracts decreases in the following order: CE > EAF > AQF (Fig. 1A). This result confirms that most antioxidants were partitioned into the EAF.
Fig. 1.
Comparison of (A) DPPH inhibition activity and (B) ferric reducing power of ascorbic acid, CE, EAF, and AQF obtained from extraction of sarang semut using water/ethanol (20/80; v/v). AQF = aqueous fraction; CE = crude extract; DPPH = 1,1-diphenyl-2-picrylhydrazyl-radical; EAF = ethyl acetate fraction.
Ferric reducing powers of the extracts are shown in Fig. 1B. The increase in absorbance, as shown in Fig. 1B, was due to reduction of Fe3+ to Fe2+, indicated by the increase in the intensity of yellow color. The reducing power of the CE is slightly lower than that of ascorbic acid. However, the ferric reducing power of the EAF is comparable to that of the CE. This implies that most of the antioxidants in the CE were partitioned into the EAF. The ferric reducing power of the extracts was found to be in the following order: ascorbic acid > CE > EAF > AQF (Fig. 1B), which is consistent with that of the DPPH antioxidant activity. Hence, the EAF was used for further study in identification and quantification of major constituting compounds in sarang semut extract.
3.2. UV/Vis spectrophotometric analysis
To inspect the absorption characteristics of the sample, a dilute solution of the sample and two standards were scanned separately using a spectrophotometer. Standard solutions of rosmarinic acid and procyanidin B1 were prepared by dissolving 1 mg of each in 10 mL of methanol. Methanol solution of the EAF of the sample and standard solutions were scanned from 200 nm to 700 nm using a spectrophotometer (UV-550; Jasco). Methanol was considered as a blank solution.
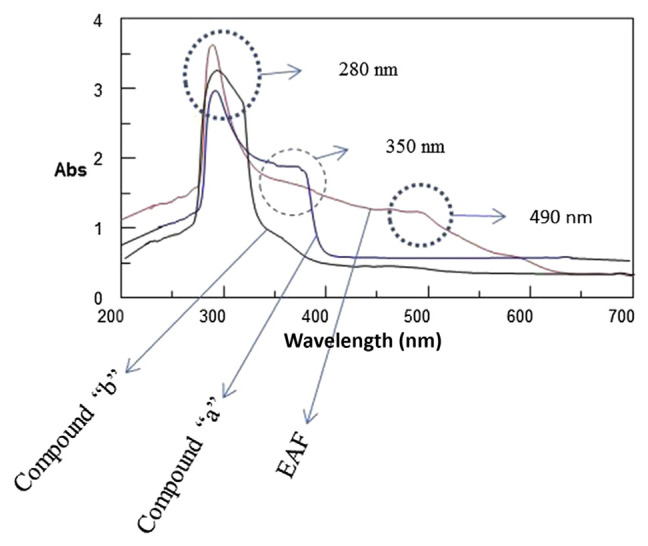
The UV/Vis absorption spectrum of compound “a” shows strong absorbance at 280 nm and a shoulder around 360 nm (Fig. 2), which is the characteristic absorption spectrum of phenolic acids. The shoulder around 360 nm, which is observed in case of compound “a” and EAF (Fig. 2), provides qualitative information regarding the presence of compound “a” in the EAF. Compound “b” shows maximum absorbance at around 280 nm (Fig. 2). Flavanol and flavonol have a maximum absorbance at about 280 nm and 350 nm, respectively [22]. The strong absorption around 280 nm seen for compound “b” and EAF (Fig. 2) indicates that compound b can exist in the EAF and may be flavanol. EAF spectrum (Fig. 2) shows the absorption characteristics of both standards (rosmarinic acid and procyanidin B1). The absorption of EAF in the visible region at around 490 nm may be due to the presence of colored compounds such as β-carotene and chlorophyll b. UV/Vis spectra were helpful as they provided qualitative information.
Fig. 2.
UV–Vis spectra of compound a, compound b, and EAF scanned from 200 nm to 700 nm. EAF = ethyl acetate fraction; Vis = visible.
3.3. HPLC–MS/MS analysis
HPLC is an especially powerful tool when combined with MS. HPLC–MS/MS can provide comprehensive qualitative analysis and quantitative information [23]. The EAF was analyzed using HPLC–MS/MS for identifying the major constituting compounds in sarang semut extract based on their fragmentation pattern.
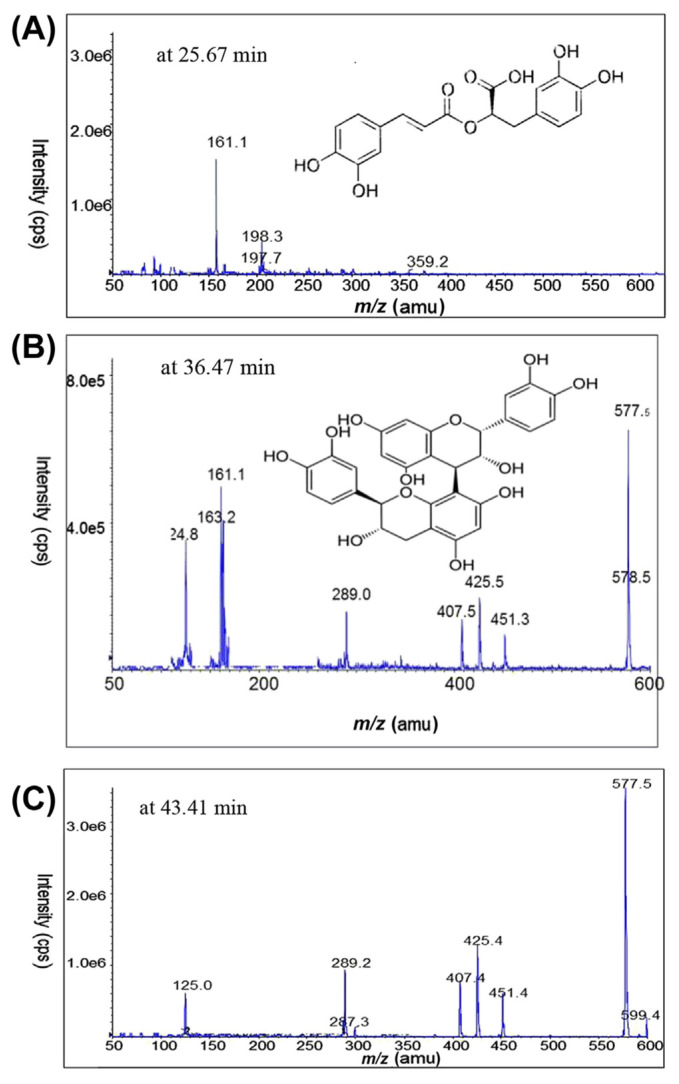
For compound “a”, an ion at m/z 359 [corresponding to (M–H)− in Fig. 3A] is a molecular ion in the negative ion mode. MS/MS analysis of this ion generated a product ion at m/z 161 (Fig. 3A and Table 1), considered to be typical of caffeic acid esters, as reported by Lee et al [24]. Rosmarinic acid is an ester of caffeic acid and 3,4-dihydroxyphenyllactic acid. After losing the stable compound 3,4-dihydroxyphenyllactic followed by the loss of water molecule, m/z 161 is a production. This is justified by the strong peak at m/z 161 in Fig. 3A. The molecular formula of compound “a” was established as C18H16O8. Hence, compound a was identified as rosmarinic acid based on its molecular ion [m/z 359.2 (M–H)−] and its MS/MS characteristic fragments at 161 amu.
Fig. 3.
HPLC–MS/MS product ion scan spectra of (A) compound a, rosmarinic acid (m/z 359.2); (B) compound b, procyanidin B1 (m/z 577.5); and (C) ion fragment of compound c. The sample analyzed was EAF of sarang semut extract (heat reflux extraction, 3 hours, water/ethanol; 20/80; v/v), in negative ion mode. EAF = ethyl acetate fraction; HPLC = high-performance liquid chromatography; MS/MS = tandem mass spectrometry.
Table 1.
HPLC/UV chromatogram at 280 nm and HPLC-MS/MS data of three compounds.
| No. | Compound | t R a | X − b | MS2 of X− |
|---|---|---|---|---|
| I | a | 19.75 | 359.2 | 197, 198, 161 |
| II | b | 27.36 | 577.5 | 451, 425, 407, 289, 163, 161, 125 |
| III | c | 32.09 | X | 451, 425, 407, 289, 287, 125 |
HPLC = high-performance liquid chromatography; MS2 = tandem mass spectrometry.
tR represents for retention time in minutes.
X− represents for molecular ion (M–H)−.
For compound “b”, an ion at m/z = 577.4 in the negative ion mode and the MS/MS fragmentations 425, 289, and 407 are characteristic signals of proanthocyanidin B-type dimer, as reported by Fernandes et al [25]. The signal at m/z 578.5, which is exactly 1 amu more than the molecular ion peak (m/z 577.5), is characterized by 13C isotope (Fig. 3B). The signal at m/z 289 stands for the negative ion of the monomer (C15H13O6)−. Similarly, MS/MS signals (451, 425, 407, 289, 163, and 125) observed for compound “b” (Fig. 3B and Table 1) were reported as the fingerprint fragments of procyanidin B-type dimer [26,27]. In general, procyanidin dimers have three characteristic fragmentation routes: m/z 289 + 287 (quinone methide), m/z 425 + 407 (retro-Diels–Alder), and m/z 451 (heterocyclic ring fission) cleavages [26]. The molecular formula of compound b (C30H26O12) was established using electrospray ionization (ESI)/MS [m/z 577 (M–H)−] and its characteristic fragments mentioned above.
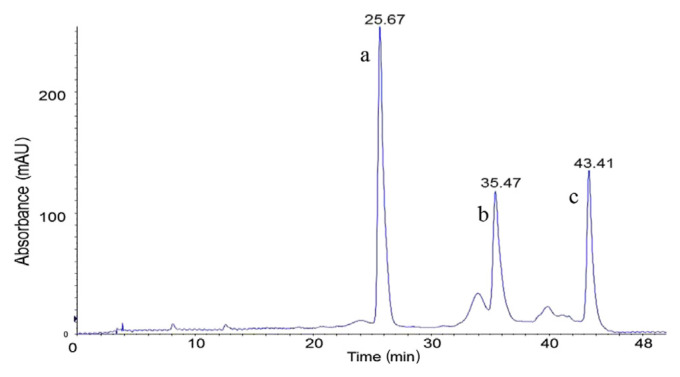
Compound “c”, as can be seen in the LC/ESI spectrum (Fig. 4), has a higher molecular mass than compound “b”. Based on the position of compound c, m/z 599.4 cannot be a molecular ion. An ion at m/z 599.4 may be due to the existence of [(M–H)− H + Na]− (sodium adduct of compound “b”) as impurity. MS/MS signals of compound “c” at m/z 577.5, 451, 425, and 125, observed in Fig. 3C and presented in Table 1, are identical to the MS/MS signals of compound “b” (Fig. 3B and Table 1). However, compound “c” is a different compound, as can be seen in the LC/ESI profile. The molecular ion of this compound cannot be observed in the given mass range (50–600). Only the characteristic fragment signals are observed in this range (50–600), as seen in Fig. 3C.
Fig. 4.
LC–ESI profile of EAF of the sample extract. EAF = ethyl acetate fraction; ESI = electrospray ionization; LC = liquid chromatography.
Based on the common ions at m/z 577.5, 451, 425, 407.5, and 125 for compounds “b” and “c”, compound “c” is suspected to be a polymer of compound “b”.
3.4. Confirmation and quantification of compounds
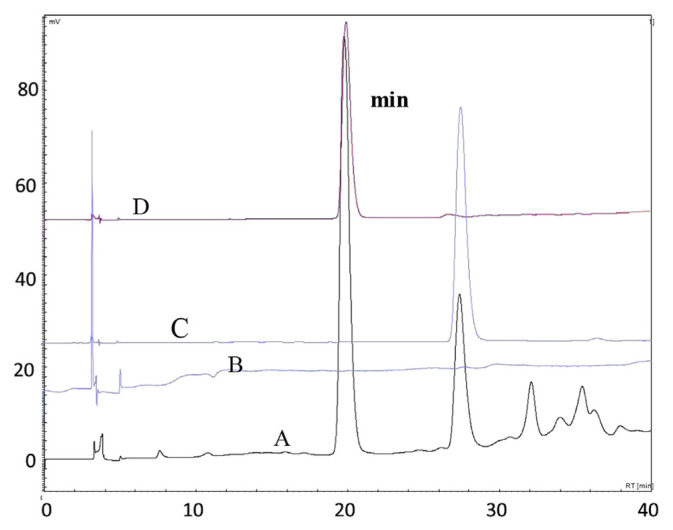
The HPLC technique was used to confirm and quantify the targeted major compounds using authentic standards. Phenolic compounds in the EAF were confirmed by comparison of their retention times and UV spectra with those of pure standards. The HPLC analysis showed the presence of three main compounds (Fig. 5A). The main peaks in chromatogram A at retention times of 19.75 minutes, 27.36 minutes, and 32.09 minutes are of interest. Their area percentages are 52.05%, 21.34%, and 7.66%, respectively. Compound “a” and compound “b” were identified as rosmarinic acid and procyanidin B1 by comparing their retention times with that of standard (chromatograms C and D in Fig. 5). However, confirmation of compound “c” (suspected to be a polymer of compound b) failed due to the lack of a commercial standard.
Fig. 5.
HPLC chromatograms (at 280 nm) of EAF (A), blank matrix (B), procyanidin B1 (180 μg/mL) (C), and rosmarinic acid (180 μg/mL) (D). HPLC = high-performance liquid chromatography.
Rosmarinic acid and procyanidin B1 in the EAF were quantified using calibration lines, which were constructed by plotting the average peak areas versus the concentrations of each standard. The summary of linear equations, squared correlation coefficients, limit of determination, and limit of quantification of rosmarinic acid and procyanidin B1 are presented in Table 2. Both identified compounds were determined at 280 nm. The concentrations of rosmarinic acid and procyanidin B1 were found to be 20.688 ± 1.573 mg/g dry sample and 3.236 ± 0.280 mg/g dry sample, respectively. Based on the above HPLC quantification analysis, together with antioxidant activity data, it can be concluded that rosmarinic acid and procyanidin B1 are the predominant contributors to the overall antioxidant activity of the EAF of the plant extract.
Table 2.
Calibration line, correlation coefficient detection limits, and quantification limits of HPLC analysis for compounds identified and quantified from sarang semut.
| Compound | Z a | rb (n = 3) | Conc. range (μg/mL) | LOD (μg/mL) | LOQ (μg/mL) |
|---|---|---|---|---|---|
| a | y = 1.8578x + 0.2752 | 0.9828 | 160–1000.0 | 0.0523 | 0.1743 |
| b | y = 8.265x + 0.5861 | 0.9793 | 160–1000.0 | 0.0183 | 0.0611 |
HPLC = high-performance liquid chromatography; LOD = limit of determination; LOQ = limit of quantification.
Z represents regression equation.
r represents for correlation coefficient.
3.5. Inspection of DPPH scavenging capacity
Finally, DPPH scavenging capacities of the CE, EAF, AQF, and pure phenolic compounds were evaluated using gallic acid as the control, as discussed in the Section “Determination of antioxidant capacity”. The half maximal inhibitory concentration (IC50) values were used for comparison. Based on the IC50 values (Table 3), the order of DPPH scavenging capacity was found to be CE > EAF > AQF. CE showed the highest DPPH scavenging potency, which may be because the CE contained all constituting compounds. The direct correlation between total phenolic content and DPPH scavenging potency was explained by Lou et al [28]. EAF and AQF are fractions of the CE. EAF showed a higher DPPH scavenging potency than AQF. The high DPPH scavenging potency of EAF may be due to the transfer of most potent compounds to EAF. Only highly polar compounds, mostly low-molecular-weight phenolic acids, would exist in the AQF. This statement is consistent with the result shown in Fig. 1 which was aimed at selection of a fraction to simplify the HPLC profile for further experimental analysis. Procyanidin B1 and rosmarinic acid showed significant free radical scavenging capacities with IC50 values of 27.59 ± 13.50 μg/mL and 35.80 ± 3.79 μg/mL, respectively. The existence of these antioxidant compounds could provide a chemical basis for some of the health benefits of sarang semut used in folk medicine. The order of DPPH scavenging capacity of the identified phenolic compounds and control compound (gallic acid) was found to be procyanidin B1 > gallic acid > rosmarinic acid. The IC50 values of the pure compounds suggest that DPPH scavenging capacity is proportional to the number of hydroxyl groups per molecule.
Table 3.
DPPH scavenging activities (IC50 values) of the CE, EAF, AQF, and pure compounds as well as the control compound (gallic acid).
| Test sample | IC50 ± SD (μg/mL) |
|---|---|
| CE | 96.09 ± 21.05a |
| EAF | 105.98 ± 8.32a |
| AQF | 224.21 ± 17.08a |
| Gallic acid | 32.53 ± 3.72b |
| Rosmarinic acid | 35.80 ± 3.79b |
| Procyanidin dimer (B1) | 27.59 ± 13.50b |
AQF = aqueous fraction; CE = crude extract; DPPH = 1,1-diphenyl-2-picrylhydrazyl-radical; EAF = ethyl acetate fraction; IC50 = half maximal inhibitory concentration; SD = standard deviation.
IC50 values of CE and fractions in μg equivalents of dry sample/mL.
IC50 values in μg/mL of pure compounds.
4. Conclusion
EAF and CE showed high activity against DPPH radical and strong ferric reducing power. The three major compounds in the EAF were found to be rosmarinic acid, procyanidin B1, and a polymer of procyanidin B1. Rosmarinic acid and procyanidin B1 were confirmed and quantified using the HPLC/UV technique. The contents of procyanidin B1 and rosmarinic acid in the EAF were found to be 3.236 ± 0.280 mg/g dry sample and 20.688 ± 1.573 mg/g dry sample, respectively. Rosmarinic acid and procyanidin B1 showed strong DPPH scavenging capacity. The presence of these compounds in sarang semut may explain some of the health benefits observed in its traditional applications. Further study is needed to analyze the whole range of compounds and also to monitor the toxicity effect of the water extract as it is used traditionally.
Acknowledgments
This study was supported by grants from the National Science of Council (NSC 98-2221-E-011-046-MY3) and National Taiwan University of Science and Technology (101H451403).
Funding Statement
This study was supported by grants from the National Science of Council (NSC 98-2221-E-011-046-MY3) and National Taiwan University of Science and Technology (101H451403).
Footnotes
Conflicts of interest
The authors declare no conflict of interest.
REFERENCES
- 1. Soong YY, Barlow PJ. Isolation and structure elucidation of phenolic compounds from longan (Dimocarpus longan lour.) seed by high-performance liquid chromatography–electrospray ionization mass spectrometry. J Chromatogr A. 2005;1085:270–7. doi: 10.1016/j.chroma.2005.06.042. [DOI] [PubMed] [Google Scholar]
- 2. Mussatto SI, Ballesteros LF, Martins S, et al. Extraction of antioxidant phenolic compounds from spent coffee grounds. Sep Purif Technol. 2011;83:173–9. [Google Scholar]
- 3. Roberto G. Capillary electrophoresis of phytochemical substances in herbal drugs and medicinal plants. J Pharmaceut Biomed. 2011;55:775–801. doi: 10.1016/j.jpba.2010.11.041. [DOI] [PubMed] [Google Scholar]
- 4. Oueslati S, Trabelsi N, Boulaaba M, et al. Evaluation of antioxidant activities of the edible and medicinal Suaeda species and related phenolic compounds. Ind Crops Prod. 2012;36:513–8. [Google Scholar]
- 5. de Abreu PDA, Rodriguez KV, Cruz JM. Extraction, purification and characterization of an antioxidant extract from barley husks and development of an antioxidant active film for food package. Innov Food Sci Emerg Technol. 2012;13:134–41. [Google Scholar]
- 6. Fernández-Agulló A, Pereira E, Freire MS, et al. Influence of solvent on the antioxidant and antimicrobial properties of walnut (Juglans regia l.) green husk extracts. Ind Crop Prod. 2013;42:126–32. [Google Scholar]
- 7. Kaol YT, Lu MJ, Cheni C. Preliminary analyses of phenolic compounds and antioxidant activities in tea pollen extracts. J Food Drug Anal. 2011;19:470–7. [Google Scholar]
- 8. Do QD, Angkawijaya AE, Tran-Nguyen PL, et al. Effect of extraction solvent on total phenol content, total flavonoids content, and antioxidant activity of Limnophila aromatica. J Food Drug Anal. 2014;22:296–302. doi: 10.1016/j.jfda.2013.11.001. [DOI] [PMC free article] [PubMed] [Google Scholar]
- 9. Kim JS, Kang OJ, Gweon OC. Comparison of phenolic acids and flavonoids in black garlic at different thermal processing steps. J Funct Foods. 2013;5:80–6. [Google Scholar]
- 10. Wan P, Sheng Z, Han Q, et al. Enrichment and purification of total flavonoids from Flos Populi extracts with macroporous resins and evaluation of antioxidant activities in vitro. J Chromatogr B Analyt Technol Biomed Life Sci. 2014;945–46:68–74. doi: 10.1016/j.jchromb.2013.11.033. [DOI] [PubMed] [Google Scholar]
- 11. Soeksmanto A, Subroto MA, Wijaya H, et al. Anticancer activity test for extracts of sarang semut (Myrmecodia pendans) to hela and mcm-b2 cells. Pak J Biol Sci. 2010;13:148–51. doi: 10.3923/pjbs.2010.148.151. [DOI] [PubMed] [Google Scholar]
- 12. Engida AM, Kasim NS, Tsigie YA, et al. Extraction, identification and quantitative HPLC analysis of flavonoids from sarang semut (Myrmecodia pendan) Ind Crop Prod. 2013;41:392–6. [Google Scholar]
- 13. Chang CC, Yang MH, Wen HM, et al. Estimation of total flavonoid content in propolis by two complementary colorimetric methods. J Food Drug Anal. 2002;10:178–82. [Google Scholar]
- 14. Li H, Wang X, Li P, et al. Comparative study of antioxidant activity of grape (Vitis vinifera) seed powder assessed by different methods. J Food Drug Anal. 2008;16:1–7. [Google Scholar]
- 15. Biesaga M. Influence of extraction methods on stability of flavonoids. J Chromatogr A. 2011;1218:2505–12. doi: 10.1016/j.chroma.2011.02.059. [DOI] [PubMed] [Google Scholar]
- 16. Porgali E, Büyüktuncel E. Determination of phenolic composition and antioxidant capacity of native red wines by high performance liquid chromatography and spectrophotometric methods. Food Res Int. 2012;45:145–54. [Google Scholar]
- 17. Firuzi O, Lacanna A, Petrucci R, et al. Evaluation of the antioxidant activity of flavonoids by “ferric reducing antioxidant power” assay and cyclic voltammetry. Biochim Biophys Acta. 2005;1721:174–84. doi: 10.1016/j.bbagen.2004.11.001. [DOI] [PubMed] [Google Scholar]
- 18. Basma AA, Zakaria Z, Latha LY, et al. Antioxidant activity and phytochemical screening of the methanol extracts of Euphorbia hirta. Asian Pac J Trop Med. 2011;4:386–90. doi: 10.1016/S1995-7645(11)60109-0. [DOI] [PubMed] [Google Scholar]
- 19. Liu G, Xu Z, Chen J, et al. On-line strategies for the identification of unknown flavone glycosides in Dracocephalum tanguticum maxim. J Chromatogr B. 2009;877:2545–50. doi: 10.1016/j.jchromb.2009.06.040. [DOI] [PubMed] [Google Scholar]
- 20. Perestrelo R, Lu Y, Santos SAO, et al. Phenolic profile of sercial and Tinta Negra Vitis vinifera L. grape skins by HPLC–DAD–ESI–MSn: novel phenolic compounds in Vitis vinifera L. grape. Food Chem. 2012;135:94–104. [Google Scholar]
- 21. Štěrbová D, Matějıček D, Vlček J, et al. Combined microwave-assisted isolation and solid-phase purification procedures prior to the chromatographic determination of phenolic compounds in plant materials. Anal Chim Acta. 2004;513:435–44. [Google Scholar]
- 22. Zhao M, Yang B, Wang J, et al. Identification of the major flavonoids from pericarp tissues of lychee fruit in relation to their antioxidant activities. Food Chem. 2006;98:539–44. [Google Scholar]
- 23. Horvath CR, Martos PA, Saxena PK. Identification and quantification of eight flavones in root and shoot tissues of the medicinal plant Huang-qin (Scutellaria baicalensis Georgi) using high-performance liquid chromatography with diode array and mass spectrometric detection. J Chromatogr A. 2005;1062:199–207. doi: 10.1016/j.chroma.2004.11.030. [DOI] [PubMed] [Google Scholar]
- 24. Lee JH, Park KH, Lee MH, et al. Identification, characterisation, and quantification of phenolic compounds in the antioxidant activity-containing fraction from the seeds of Korean perilla (Perilla frutescens) cultivars. Food Chem. 2013;136:843–52. doi: 10.1016/j.foodchem.2012.08.057. [DOI] [PubMed] [Google Scholar]
- 25. Fernandes I, Nave F, Gonçalves R, et al. On the bioavailability of flavanols and anthocyanins: flavanol–anthocyanin dimers. Food Chem. 2012;135:812–8. doi: 10.1016/j.foodchem.2012.05.037. [DOI] [PubMed] [Google Scholar]
- 26. Appeldoorn MM, Sanders M, Vincken JP, et al. Efficient isolation of major procyanidin a-type dimers from peanut skins and b-type dimers from grape seeds. Food Chem. 2009;117:713–20. [Google Scholar]
- 27. Pérez-Jiménez J, Torres JL. Analysis of proanthocyanidins in almond blanch water by HPLC–ESI–QqQ–MS/MS and MALDI–TOF/TOF MS. Food Res Int. 2012;49:798–806. [Google Scholar]
- 28. Lou SN, Hsu YS, Ho CT. Flavonoid compositions and antioxidant activity of calamondin extracts prepared using different solvents. J Food Drug Anal. 2014;22:290–5. doi: 10.1016/j.jfda.2014.01.020. [DOI] [PMC free article] [PubMed] [Google Scholar]


