

Abstract
Predicting the outcomes of organic reactions using data-driven approaches aids in the acceleration of research. In laboratory-scale experiments, only a small number of reaction data can be accessed for machine learning model construction, where reaction representations play a pivotal role in the success of model construction. Nevertheless, representation comparison for a small data set is not adequate. Herein, focusing on the enantioselectivity of phosphoric-acid-catalyzed reactions, various two-dimensional and three-dimensional reaction representations (descriptors) were compared. Overall, the concatenated form of the extended connectivity fingerprints showed the best predictive capability for the two types of data sets: high-throughput experimental data and manually collected literature data sets. Furthermore, highlighting the substructure contribution to the prediction outcome was shown to be informative for guiding catalyst development.
Introduction
Developing chemical reactions to produce desired substances is one of the ultimate goals of organic chemistry. Trial-and-error approaches combined with expert knowledge have traditionally dominated the optimization of chemical reactions. Recently, chemoinformatics1,2 or data-driven approaches have emerged to fully utilize experimental data to guide the design of chemical reactions, where the reaction outcomes (e.g., yields) are quantitatively predicted from numerical representations of the reactants or catalysts.3,4 These representations consist of molecular descriptors, which are abstract expressions of the compounds involved in the reaction.5 Molecular descriptors can be experimentally tested or computationally derived physicochemical parameters,6,7 topological descriptors derived from chemical formulas,8 and geometrical descriptors based on molecular conformations.9,10 Physicochemical descriptors or descriptors based on the hypothetical reaction mechanism combined with a simple multivariate linear regression model are able to give an interpretation of the reaction mechanism.11−13 On the other hand, topological descriptors accompanied by nonlinear machine learning (ML) models have sufficient predictive capability when trained on high-throughput experimental (HTE) data.14,15 Although HTE data16−18 provide the opportunity to analyze the comprehensive reaction space with high precision, the exhaustive combinations of substances under uniformly controlled experimental conditions are not usually available in laboratory-scale experiments for novel reaction development. Thus, methods for constructing highly predictive ML models trained on a small number of reactions are highly demanded.
Asymmetric catalyst reactions are paramount in organic chemistry for selectively synthesizing one of the enantiomers. Approximately 50% of the currently marketed pharmaceuticals contain compounds with at least one chiral center.19 Without catalysts, separation of the racemic mixture is necessary, in which the theoretical yield is limited to 50%. Because the energy barrier between enantiomers remains almost the same, it is difficult to bias the reaction to one enantiomer in a thermodynamics manner. To solve this issue, asymmetric catalysts, such as transition-metal catalysts and organocatalysts, have been developed.20,21
Highly predictive ML models of the enantioselectivity for asymmetric catalysts have been investigated.22−24 1,1′-Bi-2-naphthol (BINOL)-based phosphoric acid catalysis reactions have been used for molecular descriptor development.22,23 Zahrt et al.22 proposed novel reaction representations that do not depend on a single conformation of the compounds. The representation includes the steric effect of a molecule by estimating the grid-occupancy probability of the feasible conformers. Although ML models with this representation have high predictive capability when they are trained on a sufficient number of reactions, comparison with other molecular descriptors, including traditional two-dimensional (2D) and three-dimensional molecular descriptors (3D), is not adequate. Furthermore, this sophisticated descriptor is only applicable to a series of analogous substrates or catalysts owing to the necessity of molecular alignment. In addition to the difficulty of deployment, it is not straightforward to use the descriptors for the design of high enantioselectivity because space filling at particular grids is the interpretation of the descriptors.
Methods for interpreting the outcomes of nonlinear ML models have been developed for biological activity prediction. The contributions of chemical structural fragments to the model outcomes can be color-coded on the chemical structures as model interpretation.25 When a graph neural network is used as a ML model, sensitivity analysis by changing the input molecular graph attributions gives the important atoms (substructures) of molecules.26 The method in the latter category has already been reported for reaction prediction using the publicly available large reaction data set of USPTO.27 However, to the best of our knowledge, there have been no reports on the former type for reaction–outcome prediction models.
Here, we tested various 2D and 3D molecular descriptors in enantioselectivity ML models for phosphoric acid catalyst design and propose model construction schemes with high predictive capability focusing on a small number of reactions. Descriptor comparison was performed using a HTE data set to fully evaluate the descriptors with statistical significance. To mimic a real-world situation when the reaction data from various data sources are combined to make ML models, different reaction mechanisms including substrates and phosphoric acid catalysts were collected. Data-fusion approaches were tested for this data set. We found that 2D chemical structural fingerprints were useful for both highly predictive ML models and interpretation. In data-fusion approaches, reaction mechanism similarity was not as important as chemical structural similarity for the model predictive capability.
Materials and Methods
Chemical Reaction Data Sets
Two data sets of organophosphorus-catalyzed asymmetric reactions were prepared. The first was the HTE data set reported by Zahrt et al.,22 which is called the HTE data set. The second was a collection of chemical reactions extracted from several research articles from several research groups, which is called the literature data set. The chemical reactions in the two data sets were annotated with the experimentally validated percentage enantiomeric excess (% ee) as the enantioselectivity of the product. The HTE data set consisted of 1075 reactions of enantioenriched N,S-acetal formation catalyzed by chiral BINOL phosphoric acid derivatives. These reactions were the exhaustive combinations of five imines, five thiols, and 43 chiral phosphoric acid catalysts, as summarized in Figure 1.
Figure 1.

HTE data set. The reaction data set was extracted from the publication by Zahrt et al.22 This data set contained 1075 reactions of the exhaustive combinations from the imine group [five substituents for aryl (Ar)], the thiol group (five substituents for R1), and the chiral phosphoric acid catalyst group (43 substituents for R2).
The literature data set consisted of 116 imine-involved enantioselective reactions manually extracted from seven research articles.28−34 These reactions can be regarded as a general reaction form of conversion of an imine electrophile and a nucleophile with a catalyst to a product. These research articles satisfied the following criteria: the chemical structures of the substances and catalysts were present, multiple reaction types were present, and catalysts with axial chirality (R or S) or chiral centers were present. A collection of chemical reactions from different groups contains different scaffolds, making the % ee prediction task beyond the scope of analogous substances and catalysts. When nucleophiles or catalysts consist of different core substructures (nucleophiles and catalysts in Figure 2), superimposition of the conformers for each reaction component becomes a nontrivial task, making the calculation of the conventional 3D reaction descriptors difficult. In this data set, the chiral phosphoric acid catalysts consisted of four core scaffolds, and the nucleophiles consisted of six core scaffolds. The electrophiles consisted of an imine core with various substituents (electrophiles in Figure 2). Although all the reactions in the data set can be represented by a general reaction form, electrophile + nucleophile → product, the putative reaction mechanisms are different based on the nucleophile cores: catalytic asymmetric addition of an amide or an imide by nucleophilic attack of the nitrogen lone pair (37 reactions), the direct aza-Mannich reaction (66 reactions), and the Friedel–Crafts reaction (13 reactions). The electrophiles, nucleophiles, and catalysts of the reactions are shown in Figure 2, and the profile of the literature data set is given in Table 1.
Figure 2.
Literature data set. The reaction data set was extracted from seven publications.28−34 This data set contained 116 reactions from combinations of electrophiles (31 substituents for the two R groups), nucleophiles (27 substituents for the six R groups), and catalysts (21 substituents for the four building blocks).
Table 1. Literature Data Set Profile.
| ΔΔG‡ [kcal mol–1] |
|||||
|---|---|---|---|---|---|
| literature ID | number of reactions | putative reaction mechanism | average | minimum | maximum |
| 028 | 20 | Mannicha | 0.92 | 0 | 1.51 |
| 129 | 24 | Mannicha | 1.03 | 0.11 | 1.53 |
| 230 | 14 | Mannicha | 0.68 | 0 | 1.23 |
| 331 | 13 | Additionb | 1.65 | 0.06 | 3.13 |
| 432 | 8 | Mannicha | 0.22 | 0.06 | 0.75 |
| 533 | 13 | Friedel–Craftsc | 1.73 | 1.22 | 1.98 |
| 634 | 24 | Additionb | 1.51 | 0 | 3.13 |
Direct aza-Mannich reaction.
Catalytic asymmetric addition of an amide (imide) by nucleophilic attack.
Friedel–Crafts reaction.
As the objective variable for enantioselectivity,
the difference
in the Gibbs free energy of activation between the R and S isomers was used, which can be converted
from the % ee values by the equation ΔΔG‡ = −RT ln  ,35,36 where T is the reaction temperature and R is the gas constant
(8.314 J mol–1 K–1). Although
this metric uses an absolute enantiomeric excess and does not distinguish
between the R and S isomers, this
elimination, as well as temperature incorporation, is necessary for
integrating the reaction data sets consisting of diverse chemical
structures with different reaction temperatures from different sources.
The distributions of ΔΔG‡ for both data sets are shown as histograms in Figure 3. The median ΔΔG‡ for the HTE data set was 1.05 kcal mol–1 and that for the literature data set was 1.10 kcal mol–1.
,35,36 where T is the reaction temperature and R is the gas constant
(8.314 J mol–1 K–1). Although
this metric uses an absolute enantiomeric excess and does not distinguish
between the R and S isomers, this
elimination, as well as temperature incorporation, is necessary for
integrating the reaction data sets consisting of diverse chemical
structures with different reaction temperatures from different sources.
The distributions of ΔΔG‡ for both data sets are shown as histograms in Figure 3. The median ΔΔG‡ for the HTE data set was 1.05 kcal mol–1 and that for the literature data set was 1.10 kcal mol–1.
Figure 3.

Enantioselectivity: ΔΔG‡ values of the reactions in the data sets. The histograms show the distributions of the objective variables for the (A) HTE data set and (B) literature data set.
Reaction Descriptors
The reaction descriptors were based on the chemical structures of the main components of the chemical reactions: the electrophiles, nucleophiles, catalysts, and products. For each component, a molecular descriptor vector was derived, and concatenation of the vectors formed a reaction descriptor for the reaction.37 To calculate the 3D descriptors, the force-field-based energy-minimized conformation was used, which was identified by a conformation search using MOE software (version 2020.09, Chemical Computing Group Inc.) as follows.38 An input chemical structure, represented as a SMILES string, was loaded into the software, and explicit hydrogen atoms were added to the structure, followed by manual curation of the structure, in particular, fixing the axial chirality when the structure was a catalyst. A conformation search was then performed by the command “Conformations: search” using the default settings with the Amber10 force field. The most stable conformation in terms of the total energy was selected. For each reaction component, the most stable conformation was used for the calculation of the 3D descriptors.
Molecular Descriptors
One of the aims of this study is to evaluate the reaction descriptors in terms of their predictive capability for the enantioselectivity of organophosphorus-catalyzed reactions. Various 2D and 3D molecular descriptors were used for fair comparison.
3D Descriptors
Dragon Descriptors
Dragon descriptors are the molecular descriptors implemented in Dragon 7 software (version 7.0) provided by Kode Chemoinformatics.39 The descriptors in the software are a collection of descriptors proposed in the scientific literature. More than 5000 descriptors are available, which are categorized based on the descriptor type. Owing to the completeness and diversity of the descriptor types, Dragon descriptors have been frequently used for quantitative structure–activity relationship analyses.40−42 In this study, 10 3D descriptor groups were considered (the number of descriptors is given in parentheses): geometrical descriptors (38), 3D matrix-based descriptors (99), 3D autocorrelations (80), RDF descriptors (210), 3D-MoRSE descriptors (224), WHIM descriptors (114), GETAWAY descriptors (273), Randic molecular profiles (41), 3D atom pairs (36), and CATS 3D descriptors (300). Estrada-like index (EE_M(w)) descriptors were not considered because they cannot be calculated for chiral phosphoric acid catalysts.
MOE Descriptors
The MOE descriptors were the descriptors calculated by MOE software (version 2020.09). The implemented descriptors mainly focus on the properties for molecular interaction in medicinal chemistry, such as the polar surface area and molecular shape. The calculated molecular properties (energies) at the semiempirical quantum mechanics level were also included. In this study, all the available 3D descriptors (138) were considered. The names and definitions of the descriptors are given in Table S1. For the chiral phosphoric acid catalysts, 18 out of the 138 descriptors could not be calculated (Table S2), leading to a 120-dimensional vector for a reaction component.
Average Steric Occupancy Descriptors
The average steric occupancy (ASO) descriptor of a molecule is a numerical vector in which each variable represents the average occupancy of a grid cell by an ensemble of conformers of the molecule.22 Because the descriptor values are averaged over the feasible conformers, conformational flexibility can be taken into account, and thus, it is a 3.5-dimensional (3.5D) descriptor. To calculate the ASO descriptors, grid cells surrounding a molecule are first defined, and conformational alignment (superimposition) of analogous molecules is then performed. Although it is difficult to superimpose nonanalogous molecules inside the predefined grid cells in a consistent manner, ASO descriptors can give an interpretation of a prediction model when the modeling algorithm is linear regression. This is similar to molecular interaction-field-based descriptors, such as CoMFA combined with linear regression models (partial least-square regression).43−45 In this study, ASO descriptors were only used for the HTE data set. The calculated ASO descriptor values for the HTE data set were downloaded from a website46 as csv files provided by Zahrt et al.22
2D Descriptors
Extended Connectivity Fingerprints
Extended connectivity fingerprints (ECFPs) are atom-centric circular fingerprints. The atom environment for each atom becomes a feature component of an ECFP. Each feature generates a hash number, and a collection of the hash numbers forms an ECFP. In this study, the ECFP with a bond diameter of 6 (ECFP6) was used.47 To avoid bit collision when making a fixed-sized bit vector (assigning different hash values to the same bit), a feature set generated by ECFP6 was first folded into a large bit vector by modulo operation (1,000,000 bits), followed by the operation of removing the bits consisting of zero. This bit reduction process was performed on a component basis: electrophiles, nucleophiles, catalysts, and products. The ECFP6 descriptors were calculated by in-house Python scripts with the aid of the OEChem toolkit.48
Mol2vec Descriptors
The Mol2vec descriptor is the descriptor generated by a Mol2vec model. This descriptor is a fixed-sized numerical vector obtained by summing the feature vectors of the atom environments. An atom environment is represented by an ECFP hash value, and the Mol2vec model is trained to find vector embeddings for the hash values taking the similarity among the different atom environments into account. For a molecule, all the feature vectors of the atom environments are summed, which becomes a Mol2vec descriptor. The Mol2vec model is usually trained on a large compound data set to learn the unbiased similarity among the atom environments.
To generate the Mol2vec descriptors, the ChEMBL24 database (1,646,866 compounds),49 part of the Reaxys database (232,104 compounds),50 and the HTE data set (78 compounds) were prepared to train a Skipgram-based Mol2vec model.51 To train the Mol2vec model, a hash value of an ECFP atom environment formed a word, and it was assigned to its central atom. The aligned hash values on the canonical SMILES string order formed a molecular sentence. A collection of the sentences was used to train the model, and the word (hash value) embedding was extracted from a hidden layer vector of the model. All the feature vectors in the molecule were summed to form the final Mol2vec descriptor.
Machine Learning
ML models can estimate ΔΔG‡ of a reaction by inputting a value of the chemical reaction descriptor. As modeling algorithms, extreme gradient boosting (XGBoost) and support vector regression (SVR) were used. XGBoost models were constructed with the XGBoost libraries (version 1.4.0),52 and SVR models were constructed with the scikit-learn (version 0.24.2) libraries. For SVR, the hyperparameters C and ε were set to 10.0 and 0.1, respectively, which were the settings in scikit-learn.53,54 Two kernel functions were also tested: rbf and polynomials with degrees of 2 and 3. To interpret the outcome of a SVR model, the Tanimoto kernel (vide infra) was used in combination with the ECFP descriptor.55
Evaluation Metrics
The ML model performance was evaluated by the mean absolute error (MAE)
where n is the number of data, ŷi is the predicted value for the ith sample, and yi is the measured value. The MAE is a more rigorous metric for a data set containing outliers than the root-mean-squared error, and thus, it was used in this study.
Interpretation of the SVR Prediction Outcome Based on the Fragment Contributions
Interpretation of the prediction outcome generated by a ML model is important for practical applications. This gives more information than a mere prediction of the enantioselectivity (ΔΔG‡). Because SVR (support vector machine) models combined with the Tanimoto kernel generally achieve high prediction accuracy in activity prediction, only SVR with the Tanimoto kernel was considered in this study.
The prediction outcome by a SVR model with the Tanimoto kernel function can be decomposed into the contributions of the descriptors.56 The outcome of a SVR model is as follows
where K is the kernel function, α and α* are Lagrange multipliers on the dual problem of the objective function, and i is an index of the support vectors (SVs). f(x) is a linear combination of the kernel functions on the SVs and x (weighted on α or α*, αα* = 0). The Tanimoto kernel is
where d is a dimension of the D dimensional fingerprint. Inserting the Tanimoto kernel equation into the SVR prediction function gives
For the d dimension contribution
Therefore, the outcome of the SVR model can be decomposed into individual descriptor contributions without approximation. Because each bit of an ECFP vector represents an atom environment, the normalized summation of the contributions matching the atom becomes the total contribution of the atom. Visualization of the atom contributions to the molecular structure was performed by the procedure proposed by Bajorath et al.56,57
Results and Discussion
Study Design
HTE Data Set
Using the HTE data set, the MAE values in ΔΔG‡ prediction by several ML models were compared for several reaction representations: Dragon, MOE, Mol2vec, ASO, and ECFP6. Four data-splitting strategies were tested to understand the prediction models from different perspectives: random splitting, 80% ee splitting, silyl splitting, and out-of-sample splitting. For random splitting, the training reactions were randomly selected from the HTE data set. The number of training reactions varied (10, 20, ···, 100 and 100, 200, ···, 1000), and the rest of the reactions became the test reactions. For each number of training reactions, the prediction trial was repeated 100 times by different random splitting to assure statistical validity. For 80% ee splitting, the reactions with less than 80% ee were added to a training pool, and the reactions with greater than or equal to 80% ee were added to a test pool, as in a previous study.22 The training pool consisted of 718 reactions with low % ee values, and the test pool consisted of 357 reactions with high % ee values. For this splitting, each training data set was constructed by randomly sampling a predefined number of reactions from the training pool. These numbers varied (10, 20, ···, 100 and 100, 200, ···, 700). For silyl splitting, the reactions with catalysts containing a silyl group were the test data set, and the reactions with catalysts not containing a silyl group were the training pool. The test-data-set size was 100 (four catalysts), and the training-pool size was 975 (39 catalysts). A predefined number of reactions was sampled from the training pool for each training data set. The number of training reactions varied (10, 20, ···, 100 and 100, 200, ···, 900). For the out-of-sample splitting, a training data set and three test data sets were prepared in the same way as in previous studies.22,58 The training data were 384 reactions which were the combinations of 16 substrates and 24 catalysts. The remaining 691 reactions, which were not overlapped in both substrates and catalysts with the training data set, were further classified into three test sets. The first data set consisted of reactions with the same substrates but different in catalysts (termed test sub), the second with the same catalysts but different in substrates (test cat), and the last with both different substrates and catalysts (test sub-cat). The number of training reactions varied (10, 20, ···, 100, 200, 300, and 384).
After evaluating the predictive capability of the ML models with various reaction representations and modeling methods, interpretation of the prediction outcome was performed to identify the chemical structural features responsible for high (low) % ee as examples of several reactions in a test data set. This was performed to understand the model, as well as to gain insight into the reactions for further optimization of the components of the reactions. For interpretation, a SVR model was trained on 100 reactions obtained by random splitting, which showed sufficient predictive capability. The model was selected from a set of 100 models trained on the same number of reactions based on the closeness to the average MAE over the 100 trials for fair comparison.
Literature Data Set
The predictive capability of ΔΔG‡ prediction models was investigated in terms of the training-data-set size, reaction representations, and ML algorithms in the same way as in random splitting using the HTE data set. The number of training reactions was varied from 10 to 100, and the MAE values for the test reactions that were not included in the training data set were calculated. For each training-data-set size, 100 trials were performed.
Next, we investigated how much of the reaction data with different putative reaction mechanisms contributed to the improvement of the predictive ability of the ML models. For this purpose, reactions in each paper formed a test data set, and four training data sets were prepared for each test data set: all, the same reaction mechanism, in the cluster (cluster), and outside the cluster (outside the cluster). The “all” data set consisted of the rest of the literature data set: the remaining reactions after the test data set was extracted. The same reaction mechanism data set consisted of the reactions of the same putative reaction mechanism (Table 1). The cluster data set consisted of the reactions belonging to the same cluster in a reaction descriptor space. The outside cluster data set consisted of the reactions belonging to the different clusters in the reaction descriptor space. The ECFP6-based reaction representation was used for this purpose, and the number of clusters was determined to be three based on an ELBOW plot (Figure S8). These benchmark calculations were investigated to reveal a reasonable way to integrate data sets from different sources, that is, mechanism-based or reaction similarity-based.
Prediction Capability of the ML Models for the HTE Data Set
General Performance
The five descriptors listed in the Materials and Methods section, Dragon (5659 dimensions), MOE (534 dimensions), Mol2vec (1600 dimensions), ASO (8548 dimensions), and ECFP6 (839 dimensions), were evaluated using the data sets obtained by random splitting with, partial least-squares regression, the decision tree, SVR, and XGBoost. Overall, XGBoost showed the best predictive capability in terms of the MAE (Tables S3–S7). Therefore, further discussion is limited to XGBoost with the five reaction representations. A recently proposed neural network-based fingerprint, bidirectional encoder representations from the transformer (BERT)-based reaction fingerprint (rxnfp),59 was also evaluated for predictive capability for this data set using the default setting for fingerprint generation. However, the performance was worse than other representations (Table S8); thus, we did not consider this fingerprint for further analysis.
The MAE values for the test data sets plotted against the training-data-set size (up to 300) are shown in Figure 4. Overall, the MAE values decreased as the training-data-set size increased. The differences in the MAE values among the representations became smaller as the number of training reactions increased. The average MAE range of the five representations for a training-data-set size of 100 was 0.0630 kcal mol–1 and that for a training-data-set size of 300 (1000) was 0.00911 kcal mol–1 (0.00164 kcal mol–1). The order of the predictive capability for the different representations was consistent for different training-data-set sizes. Ranking the representations by the MAE, ECFP6 > ASO > Dragon (Mol2vec) > MOE (paired t-test at a significance level of 0.05). The results for training-data-set sizes larger than 300 were not significantly different in the MAE values among the different representations (Figure S1). Notably, the ECFP6 representation showed acceptable accuracy even for a training-data-set size of 100. The ECFP representation is atom-centered structural features extracted on chemical graphs (2D representations). This simple feature was better than more complicated 3D or 3.5D representations in terms of the MAE.
Figure 4.

Model performance against the data-set size. Prediction accuracy against the training-data-set size for the HTE data set by XGBoost. The average of the MAEs for the test data sets is plotted against the training-data-set size. For each size, the training data sets were randomly sampled from a total of 1075 reactions, and the rest of the reactions formed the test data set. An XGBoost regression model was constructed using a training data set, and the MAE was measured for the test data set. This procedure was repeated 100 times. The error bars correspond to the standard deviations of the MAEs. The descriptors for model construction were Dragon (3D), MOE (3D), ASO (3.5D), Mol2vec (2D), and ECFP6 (2D).
Predictive Capability for Extrapolated Reactions
For the 80% ee splitting data sets, the MAE values for the test data sets for training-data-set sizes of up to 300 are shown in Figure 5A and those for training-data-set sizes of larger than 300 are shown in Figure S2. The baseline of the MAE values was higher than that for the random splitting data sets (Figure 4). ECFP6 was the best representation, and it was statistically significantly better than the second-best representation ASO (paired t-test, significance level of 0.05). The order of the other three descriptors was not consistent as the training-data-set size varied.
Figure 5.

Extrapolated prediction capability for the HTE data set. The average of the MAEs for the test data sets is plotted against the training-data-set size for the (A) 80% ee splitting and (B) silyl splitting data sets.
For the silyl splitting data set, the performance using the ECFP6 representation was the best irrespective of the training-data-set size (Figures 5B and S3). For the ECFP6 representation, the trend of the MAE value against the training-data-set size was different from those of the other representations: the MAE value decreased as the training-data-set size increased, while the other representations showed the opposite trend. An ECFP is a collection of bits, and each bit corresponds to an atom-centric fragment (atom environment). The environments of the atoms of the silyl group were ignored in the prediction models using the ECFP6 representation. The superiority of the ECFP representation can be explained by the presence of silyl groups at the 3 and 3′ positions of BINOL-derived catalysts in this reaction might not be important for the enantioselectivity. Although the ECFP approach of not using the atom information of the silyl group seems to be reasonable as it does not add any uncertainty or speculation to the model, the performance might change if the silyl groups have a significant effect on the enantioselectivity. This finding is supported by the Dragon and MOE descriptors showing poorer performance as the number of training data increased. These models performed better for random splitting as the training-data-set size increased (Figure 4). In other words, the models constructed with more training reactions predicted ΔΔG‡ better for a test data set exhibiting the same distribution as the training data set. Both descriptors distinguish atom types in various ways and reflect the differences in the descriptor values (e.g., the molecular weight). The finely tuned models might have an adverse effect on ΔΔG‡ prediction when encountering outlier values in the independent variables.
Prediction capability for extrapolated reactions was further investigated using the previously reported data sets by the out-of-sample splitting,22,58 which was a data-splitting strategy for combinatorial reactions. Table 2 shows the MAE values of prediction models for the three test data sets. As a control, one-hot encoding representation was also tested. Overall, the ECFP6 representation consistently performed well among the tested representations including previously reported ones [ASO and multiple fingerprint features (MFF)]. It should be noted that in Table 2 MFF and ASO in the previous studies used different modeling methods from XGBoost used in this study.
Table 2. ΔΔG‡ Prediction Performance for the Out-of-Sample Data Setsa.
Like the silyl splitting data set, the performance using the ECFP6 representation was the best irrespective of the training-data-set size as shown in the MAE values for test data sets for training-data-set sizes of up to 300 in Figure S4. Furthermore, differences in MAE values among descriptors were confirmed by the Y–Y plots (Figures S5–S7). The Y–Y plots for the Dragon and MOE showed a similar trend to the one-hot encoding, implying that these representations did not contain meaningful reaction information for the prediction. The ASO and Mol2vec descriptors failed to predict high ΔΔG‡ values, suggesting that they had a narrow adaptive range. On the other hand, ECFP6 could predict high ΔΔG‡ values better than the other representations (Figures S5–S7).
From this analysis focusing on the extrapolation ability of chemical reaction representations, an atom environmental-based chemical structural fingerprint: ECFP6 showed better performance than other representations irrespective of sizes of training data sets.
Interpretation of the Model Outcomes for the HTE Data Set
The ECFP6 representation showed the best predictive ability among the five representations for all of the splitting strategies using the HTE data set. The average MAE value of the 100 prediction trials using 100 training reactions was 0.199 kcal mol–1 by the XGBoost models and 0.233 kcal mol–1 by the SVR model. The performance of the SVR models was slightly poorer than that of the XGBoost models, but they were still comparable. The SVR model for model interpretation was chosen from the 100 constructed models based on the closeness to the average MAE value (0.233 kcal mol–1).
Visualization of the example reaction outcomes by the SVR model is shown in Figure 6, in which the atoms and bonds on the components of the chemical reactions are highlighted. The only difference between ID1 and ID2 was the substituted benzene rings at the 3, 3′ positions of the chiral phosphoric acid catalyst. ID1 showed higher enantioselectivity than ID2. The difference in the chemical structures clearly highlights the effect of 2,4,6-trichlorobenzene. The two reactions ID3 and ID4 (Figure 6) differed only by the direct attachment of methylene groups to the 3, 3′ positions of the chiral phosphoric acid catalyst. The enantioselectivity decreased by 0.9 in ΔΔG‡ when inserting methylene groups at the 3, 3′ positions. The atom contributions clearly highlighted this effect. This led to the interpretation that the rigidness of the catalyst conformation may be involved in the enantioselectivity, although ECFP is based on chemical structures (2D). The two reactions ID5 and ID6 differed in the nucleophile: an aromatic and an aliphatic thiol, respectively. In the HTE data set, aromatic thiols generally gave higher enantioselectivity than aliphatic thiols. A difference between these two functional groups is the degree of nucleophilicity: aromatic thiols are less nucleophilic than the corresponding aliphatic thiols. For aromatic thiols to obtain comparative enantioselectivity to aliphatic thiols, 5 mol % of the catalyst is required instead of 2 mol %.60 This led to the speculation that chemical reactions with aliphatic thiols were completed before the catalyst was actually involved, and thus, they lose enantioselectivity. In this manner, highlighting the contribution of reaction components’ substructure to the prediction outcome gave the opportunity of interpreting the reaction based on the chemical knowledge that chemists possess. To propose a hypothesis, the ECFP representation with SVR is powerful as a first step to analyze the reaction data set.
Figure 6.

Model interpretation for the HTE data set. For six example reactions, the contributions of the fragments to the SVM prediction outcome are visualized with colors. The positive contributions are highlighted in orange, and the negative contributions are highlighted in blue. The degree of nontransparency reflects the intensity of the contribution. The reaction IDs are given in the second column from the left. The rightmost column shows the prediction outcomes.
Analysis of the Literature Data Set for Data Fusion
General Performance
Three descriptors, Dragon (5659 dimensions), MOE (534 dimensions), and ECFP6 (1731 dimensions), were evaluated using the randomly split data sets with the XGBoost regression model. Mol2vec was not tested owing to its poor performance for the HTE data set. The MAE values for the test data sets are plotted against the size of the training data set (up to 100) in Figure 7. Overall, the MAE values decreased with increasing training-data-set size. The differences between the MAE values among the representations became small as the number of training reactions increased. The MAE range for a training-data-set size of 100 was 0.0398 kcal mol–1. The order of the predictive capability for the different representations was consistent regardless of the training-data-set size. The ECFP6 representation performed the best among the selected reaction representations, which was the same trend as for the HTE data set.
Figure 7.
Prediction capability for the literature data set. The average of the MAEs for the test data sets is plotted against the training-data-set size.
Y–Y plots of the three representations for 70 training reactions are shown in Figure 8. Overall, the ECFP6 representation performed better (R2 = 0.69, MAE = 0.275 kcal mol–1) than the Dragon (R2 = 0.57, MAE = 0.306 kcal mol–1) and MOE (R2 = 0.63, MAE = 0.277 kcal mol–1) representations. Using Dragon and MOE, the enantioselectivities for some of the test reactions were reasonably well predicted, while the enantioselectivities for the other test reactions were poorly predicted (Figure 8). In contrast, using the ECFP6 representation did not produce such outliers for the test data set. Thus, even using a mixed data set from different sources, the ECFP6 representation was found to be preferable to the Dragon and MOE representations.
Figure 8.
Y–Y plots for the literature data set using the XGBoost models. The predicted ΔΔG‡ values are plotted against the observed values. The training reactions are in blue, and the test reactions are in red. ECFP6, Dragon, and MOE were tested as reaction representations.
Like the HTE data set, model interpretation of a SVR model with the Tanimoto kernel was performed using the ECFP6 representation. The predictive ability of the SVR models was comparable with that of the XGBoost models: the average MAE of ΔΔG‡ prediction for the 100 SVR models trained on 70 randomly selected reactions was 0.275 kcal mol–1, and it was 0.268 kcal mol–1 for the XGBoost model. The selected SVR model for model interpretation showed the closest predictive ability to the average MAE value (0.275 kcal mol–1).
Two example reactions along with the fragment contributions to the model outcomes are shown in Figure 9. ID7 was a Mannich-type reaction from literature 0,28 while ID8 was also a Mannich-type reaction catalyzed by α,α,α,α-tetraaryl-1,3-dioxolane-4,5- dimethanols (TADDOL)-derived phosphoric acid from the literature.30 The hydroxyl group on the phenyl ring next to the imine nitrogen has been reported to be important for high enantioselectivity in this type of Mannich reaction.28,30,61 This information can be derived from the highlighted fragments by the SVR feature contribution method. Furthermore, for ID8, the trifluoro groups at the 4-positions of the phenyl rings in the catalyst were also reported to be important for the selectivity.30 Small positive contributions were given to the substructures (ID8). Extracting the fragment contributions to the model outcome and their visualization were found to be important by retrospective validation using the two data sets.
Figure 9.

Model outcome interpretation. For two example reactions, the fragment contributions to the SVM prediction outcome are visualized on the chemical structures. The color scheme is the same as in Figure 6.
Data Fusion of Different Reaction Mechanisms and Sources
Visualization of the reaction space for the literature data set is provided in Figure 10 using three reaction representations: ECFP6, Dragon, and MOE. On the three plots, three clusters are represented in different colors, which were determined by k-means clustering in the ECFP6-based reaction descriptor space. The number of clusters was determined based on the ELBOW plots. Although the reactions were obtained from seven different research papers, similar reactions existed based on the ECFP6 reaction descriptors, resulting in the three clusters in the reaction space.
Figure 10.
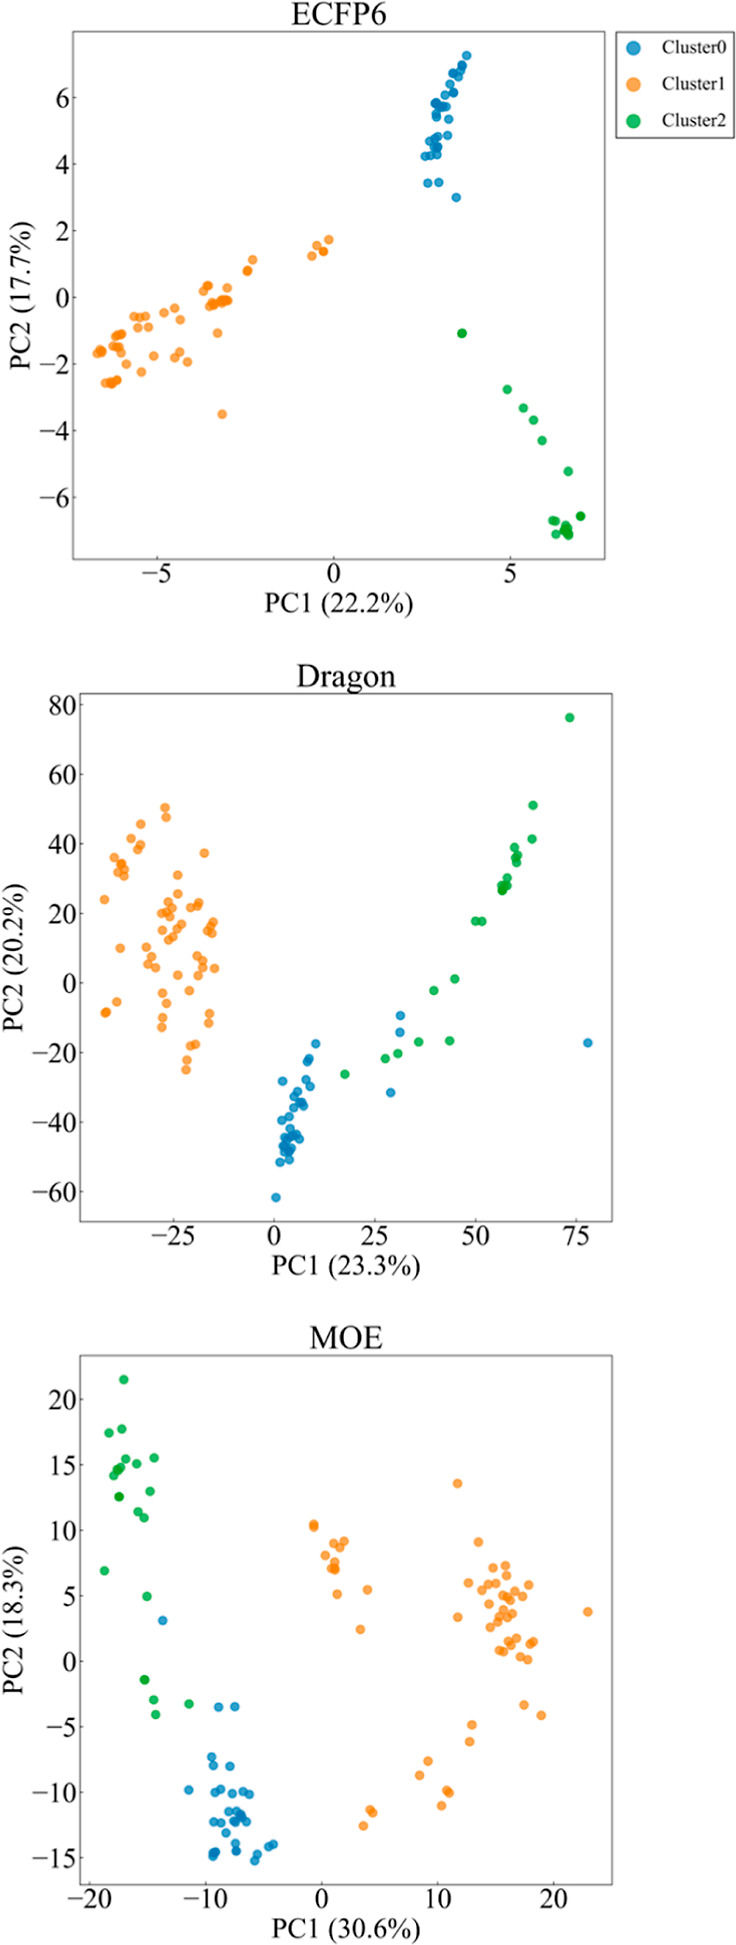
Visualization of the literature data set on principal component analysis (PCA) maps. The dots represent chemical reactions, and the colors represent the three clusters classified by the k-means. Three reaction representations were tested: ECFP6 (top), Dragon (middle), and MOE (bottom).
Each literature sub-data set, identified by the literature ID, became a test data set in turn. Four strategies of training-data-set compilation for the XGBoost models were tested: all, the same reaction mechanism, in the cluster, and outside the cluster, as explained in the Study Design section. The predictive capability in terms of the MAE is summarized in Table 3. Overall, the same reaction mechanism and outside the cluster showed lower prediction capability than all and in the cluster. Outside the cluster was a type of negative control. Collecting and using putative reaction data for model construction did not improve the performance. However, using similar reaction data (i.e., in the cluster) showed notable performance improvement for ID3 and ID4. The reactions in ID4 were Mannich type with an acetylacetone as the nucleophile. The other reactions in the same cluster (clusters ID0, ID1, and ID2) were also Mannich type but with a silyl enol ether nucleophile. The same core scaffolds were not necessary for performance improvement. This also indicated that reaction similarity in terms of the ECFP6 representation was important to collect and identify the training data. Prediction for the ID5 data set was not good by any of the strategies. This might be due to the absence of reactions with similar mechanisms: the reactions in ID5 were Friedel–Crafts-type reactions, also due to the descriptor dissimilarity indicated by the Dragon and MOE PCA maps (Figure S9).
Table 3. Predictive Capability for the Data-Fusion Strategiesa.
| training
data set |
|||||
|---|---|---|---|---|---|
| literature ID as test data | cluster ID | same reaction mechanismb | allc | in the clusterd | outside the clustere |
| 028 | 0 | 0.460 | 0.362 | 0.457 | 0.385 |
| 129 | 1 | 0.573 | 0.440 | -f | (0.440) |
| 230 | 0 | 0.432 | 0.400 | 0.411 | 0.445 |
| 331 | 2 | 0.842 | 0.378 | 0.312 | 0.792 |
| 432 | 2 | 0.949 | 0.500 | 0.171 | 0.925 |
| 533 | 2 | -f | 0.776 | 0.731 | 0.700 |
| 634 | 2 | 0.512 | 0.505 | 0.539 | 0.857 |
The MAE values [kcal mol–1] for the literature data set by data-fusion strategies are shown. The best performance is highlighted in bold.
All of the reactions in the literature data set.
Reactions in the same cluster in the ECFP6-based reaction descriptor space.
Reactions not belonging to the cluster where the test reactions belonged.
No training data.
Conclusions
A retrospective study of predictive ML models for phosphoric-acid-catalyzed asymmetric reactions has been performed. From analysis using the HTE data set (enantioenriched N,S-acetal formation catalyzed by chiral BINOL phosphoric acid derivatives), the ECFP6 representation was found to be the best representation among the Dragon, MOE, Mol2vec, ASO, and ECFP6 representations. The ECFP6 representation combined with SVR and the Tanimoto kernel function was able to give reasonable interpretations of the model outcomes for several example test reactions, which would lead to further catalyst development. From analysis using a small-size literature data set consisting of different reaction mechanisms from different sources, ECFP6 was also found to be the best representation. This analysis also revealed that reaction-mechanism-oriented data-fusion approaches were not as good as simple similarity-based approaches in the ECFP6 reaction descriptor space.
Acknowledgments
This work was supported by a Grant-in-Aid for Transformative Research Areas (A) 21A204 Digitalization-Driven Transformative Organic Synthesis (Digi-TOS) from the Ministry of Education, Culture, Sports, Science & Technology, Japan. We thank Edanz (https://jp.edanz.com/ac) for editing a draft of this manuscript.
Supporting Information Available
The Supporting Information is available free of charge at https://pubs.acs.org/doi/10.1021/acsomega.2c03812.
MOE descriptor names and definition; exception list of the MOE descriptors; MAE values against training-data-set sizes and ML algorithms for Dragon, MOE, ASO, Mol2vec, ECFP6, and rxnfp, respectively; MAE values against training-data-set sizes for the random splitting, the 80% ee splitting, the silyl splitting, and the out-of-sample splitting, respectively; Y–Y plots for “test sub”, “test cat”, and “test sub-cat” data sets, respectively; elbow plot; and PCA maps for the literature data set (PDF)
Representation descriptor values of Dragon, MOE, Mol2vec, ECFP6, and rxnfp (xlsx)
% ee and temperature values as well as reaction class for the literature data set, including the representation descriptor values of Dragon, MOE, Mol2vec, and ECFP6 (xlsx)
The authors declare no competing financial interest.
Notes
The calculated descriptor values for the manually curated data, the literature data set, and the HTE data set, were provided by Zahrt et al.22,46 The ML models were constructed using the scikit-learn libraries (version 0.24.2)54 and the library of XGBoost (version 1.4.0).52 Visualization of the contributions to the SVR outcomes was performed with a program provided by Bajorath et al.,62 with the option of using OpenEye toolkits.48
Supplementary Material
References
- Varnek A.; Baskin I. I. Chemoinformatics as a Theoretical Chemistry Discipline. Mol. Inf. 2011, 30, 20–32. 10.1002/minf.201000100. [DOI] [PubMed] [Google Scholar]
- Terstappen G. C.; Reggiani A. Silico Research in Drug Discovery. Trends Pharmacol. Sci. 2001, 22, 23–26. 10.1016/S0165-6147(00)01584-4. [DOI] [PubMed] [Google Scholar]
- Yada A.; Nagata K.; Ando Y.; Matsumura T.; Ichinoseki S.; Sato K. Machine Learning Approach for Prediction of Reaction Yield with Simulated Catalyst Parameters. Chem. Lett. 2018, 47, 284–287. 10.1246/cl.171130. [DOI] [Google Scholar]
- Sigman M. S.; Harper K. C.; Bess E. N.; Milo A. The Development of Multidimensional Analysis Tools for Asymmetric Catalysis and Beyond. Acc. Chem. Res. 2016, 49, 1292–1301. 10.1021/acs.accounts.6b00194. [DOI] [PubMed] [Google Scholar]
- Consonni V.; Todeschini R.. Molecular Descriptors. Recent Advances in QSAR Studies: Methods and Applications; Puzyn T., Leszczynski J., Cronin M. T., Eds.; Springer Netherlands: Dordrecht, 2010; pp 29–102. [Google Scholar]
- Hammett L. P. The Effect of Structure upon the Reactions of Organic Compounds. Benzene Derivatives. J. Am. Chem. Soc. 1937, 59, 96–103. 10.1021/ja01280a022. [DOI] [Google Scholar]
- Karelson M.; Lobanov V. S.; Katritzky A. R. Quantum-Chemical Descriptors in QSAR/QSPR Studies. Chem. Rev. 1996, 96, 1027–1044. 10.1021/cr950202r. [DOI] [PubMed] [Google Scholar]
- Yan A.; Gasteiger J. Prediction of Aqueous Solubility of Organic Compounds by Topological Descriptors. QSAR Comb. Sci. 2003, 22, 821–829. 10.1002/qsar.200330822. [DOI] [Google Scholar]
- Schuur J. H.; Selzer P.; Gasteiger J. The Coding of the Three-Dimensional Structure of Molecules by Molecular Transforms and Its Application to Structure-Spectra Correlations and Studies of Biological Activity. J. Chem. Inf. Comput. Sci. 1996, 36, 334–344. 10.1021/ci950164c. [DOI] [Google Scholar]
- Consonni V.; Todeschini R.; Pavan M. Structure/Response Correlations and Similarity/Diversity Analysis by GETAWAY Descriptors. 1. Theory of the Novel 3D Molecular Descriptors. J. Chem. Inf. Comput. Sci. 2002, 42, 682–692. 10.1021/ci015504a. [DOI] [PubMed] [Google Scholar]
- Newman-Stonebraker S. H.; Smith S. R.; Borowski J. E.; Peters E.; Gensch T.; Johnson H. C.; Sigman M. S.; Doyle A. G. Univariate Classification of Phosphine Ligation State and Reactivity in Cross-Coupling Catalysis. Science 2021, 374, 301–308. 10.1126/science.abj4213. [DOI] [PubMed] [Google Scholar]
- Harper K. C.; Bess E. N.; Sigman M. S. Multidimensional Steric Parameters in the Analysis of Asymmetric Catalytic Reactions. Nat. Chem. 2012, 4, 366–374. 10.1038/nchem.1297. [DOI] [PubMed] [Google Scholar]
- Mukai M.; Nagao K.; Yamaguchi S.; Ohmiya H. Molecular Field Analysis Using Computational-Screening Data in Asymmetric N-Heterocyclic Carbene-Copper Catalysis toward Data-Driven In Silico Catalyst Optimization. Bull. Chem. Soc. Jpn. 2022, 95, 271–277. 10.1246/bcsj.20210349. [DOI] [Google Scholar]
- Sato A.; Miyao T.; Funatsu K. Prediction of Reaction Yield for Buchwald-Hartwig Cross-Coupling Reactions Using Deep Learning. Mol. Inf. 2022, 41, 2100156. 10.1002/minf.202100156. [DOI] [PubMed] [Google Scholar]
- Schwaller P.; Vaucher A. C.; Laino T.; Reymond J.-L. Prediction of Chemical Reaction Yields Using Deep Learning. Mach. Learn.: Sci. Technol. 2021, 2, 015016. 10.1088/2632-2153/abc81d. [DOI] [Google Scholar]
- Ahneman D. T.; Estrada J. G.; Lin S.; Dreher S. D.; Doyle A. G. Predicting Reaction Performance in C–N Cross-Coupling Using Machine Learning. Science 2018, 360, 186–190. 10.1126/science.aar5169. [DOI] [PubMed] [Google Scholar]
- Nielsen M. K.; Ahneman D. T.; Riera O.; Doyle A. G. Deoxyfluorination with Sulfonyl Fluorides: Navigating Reaction Space with Machine Learning. J. Am. Chem. Soc. 2018, 140, 5004–5008. 10.1021/jacs.8b01523. [DOI] [PubMed] [Google Scholar]
- Jaman Z.; Mufti A.; Sah S.; Avramova L.; Thompson D. H. High Throughput Experimentation and Continuous Flow Validation of Suzuki–Miyaura Cross-Coupling Reactions. Chem.—Eur. J. 2018, 24, 9546–9554. 10.1002/chem.201801165. [DOI] [PubMed] [Google Scholar]
- Nguyen L. A.; He H.; Pham-Huy C. Chiral Drugs: An Overview. Int. J. Biomed. Sci. 2006, 2, 85–100. [PMC free article] [PubMed] [Google Scholar]
- Trost B. M. Asymmetric Catalysis: An Enabling Science. Proc. Natl. Acad. Sci. 2004, 101, 5348–5355. 10.1073/pnas.0306715101. [DOI] [PMC free article] [PubMed] [Google Scholar]
- Akiyama T. Stronger Brønsted Acids. Chem. Rev. 2007, 107, 5744–5758. 10.1021/cr068374j. [DOI] [PubMed] [Google Scholar]
- Zahrt A. F.; Henle J. J.; Rose B. T.; Wang Y.; Darrow W. T.; Denmark S. E. Prediction of Higher-Selectivity Catalysts by Computer-Driven Workflow and Machine Learning. Science 2019, 363, 5631. 10.1126/science.aau5631. [DOI] [PMC free article] [PubMed] [Google Scholar]
- Reid J. P.; Sigman M. S. Holistic Prediction of Enantioselectivity in Asymmetric Catalysis. Nature 2019, 571, 343–348. 10.1038/s41586-019-1384-z. [DOI] [PMC free article] [PubMed] [Google Scholar]
- Zahrt A. F.; Athavale S. V.; Denmark S. E. Quantitative Structure–Selectivity Relationships in Enantioselective Catalysis: Past, Present, and Future. Chem. Rev. 2020, 120, 1620–1689. 10.1021/acs.chemrev.9b00425. [DOI] [PMC free article] [PubMed] [Google Scholar]
- Rodríguez-Pérez R.; Bajorath J. Interpretation of Compound Activity Predictions from Complex Machine Learning Models Using Local Approximations and Shapley Values. J. Med. Chem. 2020, 63, 8761–8777. 10.1021/acs.jmedchem.9b01101. [DOI] [PubMed] [Google Scholar]
- Jiménez-Luna J.; Skalic M.; Weskamp N.; Schneider G. Coloring Molecules with Explainable Artificial Intelligence for Preclinical Relevance Assessment. J. Chem. Inf. Model. 2021, 61, 1083–1094. 10.1021/acs.jcim.0c01344. [DOI] [PubMed] [Google Scholar]
- Kovács D. P.; McCorkindale W.; Lee A. A. Quantitative Interpretation Explains Machine Learning Models for Chemical Reaction Prediction and Uncovers Bias. Nat. Commun. 2021, 12, 1695. 10.1038/s41467-021-21895-w. [DOI] [PMC free article] [PubMed] [Google Scholar]
- Akiyama T.; Itoh J.; Yokota K.; Fuchibe K. Enantioselective Mannich-Type Reaction Catalyzed by a Chiral Brønsted Acid. Angew. Chem., Int. Ed. 2004, 43, 1566–1568. 10.1002/anie.200353240. [DOI] [PubMed] [Google Scholar]
- Giera D. S.; Sickert M.; Schneider C. Brønsted Acid-Catalyzed, Enantioselective, Vinylogous Mannich Reaction of Vinylketene Silyl N,O-Acetals. Org. Lett. 2008, 10, 4259–4262. 10.1021/ol8017374. [DOI] [PubMed] [Google Scholar]
- Akiyama T.; Saitoh Y.; Morita H.; Fuchibe K. Enantioselective Mannich-Type Reaction Catalyzed by a Chiral Brønsted Acid Derived from TADDOL. Adv. Synth. Catal. 2005, 347, 1523–1526. 10.1002/adsc.200505167. [DOI] [Google Scholar]
- Rowland G. B.; Zhang H.; Rowland E. B.; Chennamadhavuni S.; Wang Y.; Antilla J. C. Brønsted Acid-Catalyzed Imine Amidation. J. Am. Chem. Soc. 2005, 127, 15696–15697. 10.1021/ja0533085. [DOI] [PubMed] [Google Scholar]
- Terada M.; Sorimachi K.; Uraguchi D. Phosphorodiamidic Acid as a Novel Structural Motif of Brønsted Acid Catalysts for Direct Mannich Reaction of N-Acyl Imines with 1,3-Dicarbonyl Compounds. Synlett 2006, 2006, 0133–0136. 10.1055/s-2005-922783. [DOI] [Google Scholar]
- Uraguchi D.; Sorimachi K.; Terada M. Organocatalytic Asymmetric Aza-Friedel–Crafts Alkylation of Furan. J. Am. Chem. Soc. 2004, 126, 11804–11805. 10.1021/ja046185h. [DOI] [PubMed] [Google Scholar]
- Liang Y.; Rowland E. B.; Rowland G. B.; Perman J. A.; Antilla J. C. VAPOL Phosphoric Acid Catalysis: The Highly Enantioselective Addition of Imides to Imines. Chem. Commun. 2007, 43, 4477–4479. 10.1039/B709276H. [DOI] [PubMed] [Google Scholar]
- Morrison J. D.; Mosher H. S.. Symmetric Organic Reactions; Prentice Hall: Englewood Cliffs, NJ, 1971. [Google Scholar]
- Gawley R. E. Do the Terms “% Ee” and “% de” Make Sense as Expressions of Stereoisomer Composition or Stereoselectivity?. J. Org. Chem. 2006, 71, 2411–2416. 10.1021/jo052554w. [DOI] [PMC free article] [PubMed] [Google Scholar]
- Sandfort F.; Strieth-Kalthoff F.; Kühnemund M.; Beecks C.; Glorius F. A Structure-Based Platform for Predicting Chemical Reactivity. Chem 2020, 6, 1379–1390. 10.1016/j.chempr.2020.02.017. [DOI] [Google Scholar]
- MOE (Molecular Operating Environment); Chemical Computing Group Inc.: Montreal, Canada, 2020.
- Talete S. R. L.DRAGON for Windows (Software for Molecular Descriptor Calculations); Kode chemoinformatics, 2019.
- González M. P.; Helguera A. M. TOPS-MODE versus DRAGON Descriptors to Predict Permeability Coefficients through Low-Density Polyethylene. J. Comput.-Aided Mol. Des. 2003, 17, 665–672. 10.1023/B:JCAM.0000017373.50020.41. [DOI] [PubMed] [Google Scholar]
- Helguera A. M.; Combes R. D.; González M. P.; Cordeiro M. N. D. S. Applications of 2D Descriptors in Drug Design: A DRAGON Tale. Curr. Top. Med. Chem. 2008, 8, 1628–1655. 10.2174/156802608786786598. [DOI] [PubMed] [Google Scholar]
- Casañola-Martín G. M.; Marrero-Ponce Y.; Khan M. T. H.; Ather A.; Khan K. M.; Torrens F.; Rotondo R. Dragon Method for Finding Novel Tyrosinase Inhibitors: Biosilico Identification and Experimental in Vitro Assays. Eur. J. Med. Chem. 2007, 42, 1370–1381. 10.1016/j.ejmech.2007.01.026. [DOI] [PubMed] [Google Scholar]
- Cramer R. D.; Patterson D. E.; Bunce J. D. Comparative Molecular Field Analysis (CoMFA). 1. Effect of Shape on Binding of Steroids to Carrier Proteins. J. Am. Chem. Soc. 1988, 110, 5959–5967. 10.1021/ja00226a005. [DOI] [PubMed] [Google Scholar]
- Morita H.; Awang K.; Hadi A. H. A.; Takeya K.; Itokawa H.; Kobayashi J. Conformational Analysis of Rhazinilam and Three-Dimensional Quantitative Structure–Activity Relationships of Rhazinilam Analogues. Bioorg. Med. Chem. Lett. 2005, 15, 1045–1050. 10.1016/j.bmcl.2004.12.027. [DOI] [PubMed] [Google Scholar]
- Lipkowitz K. B.; Pradhan M. Computational Studies of Chiral Catalysts: A Comparative Molecular Field Analysis of an Asymmetric Diels–Alder Reaction with Catalysts Containing Bisoxazoline or Phosphinooxazoline Ligands. J. Org. Chem. 2003, 68, 4648–4656. 10.1021/jo0267697. [DOI] [PubMed] [Google Scholar]
- Denmark Lab Chemoinformatics . ccheminfolib, https://gitlab.com/SEDenmarkLab/ccheminfolib (accessed 6/18/2022).
- Rogers D.; Hahn M. Extended-Connectivity Fingerprints. J. Chem. Inf. Model. 2010, 50, 742–754. 10.1021/ci100050t. [DOI] [PubMed] [Google Scholar]
- OEChem TK; OpenEye Scientific Software Inc: Santa Fe, NM: (accessed 6/18/2022).
- Mendez D.; Gaulton A.; Bento A. P.; Chambers J.; De Veij M.; Félix E.; Magariños M. P.; Mosquera J. F.; Mutowo P.; Nowotka M.; Gordillo-Marañón M.; Hunter F.; Junco L.; Mugumbate G.; Rodriguez-Lopez M.; Atkinson F.; Bosc N.; Radoux C. J.; Segura-Cabrera A.; Hersey A.; Leach A. R. ChEMBL: Towards Direct Deposition of Bioassay Data. Nucleic Acids Res. 2019, 47, D930–D940. 10.1093/nar/gky1075. [DOI] [PMC free article] [PubMed] [Google Scholar]
- Reaxys. www.reaxys.com (accessed 6/18/2022).
- Mikolov T.; Chen K.; Corrado G.; Dean J.. Efficient Estimation of Word Representations in Vector Space. 2013, arXiv:13013781 Cs. [Google Scholar]
- Chen T.; Guestrin C.. XGBoost: A Scalable Tree Boosting System. Proceedings of the 22nd ACM SIGKDD International Conference on Knowledge Discovery and Data Mining; KDD ’16; Association for Computing Machinery: New York, NY, USA, 2016; pp 785–794..
- Drucker H.; Burges C. J. C.; Kaufman L.; Smola A.; Vapnik V.. Support Vector Regression Machines. Advances in Neural Information Processing Systems; MIT Press, 1996; Vol. 9. [Google Scholar]
- Pedregosa F.; Varoquaux G.; Gramfort A.; Michel V.; Thirion B.; Grisel O.; Blondel M.; Müller A.; Nothman J.; Louppe G.; Prettenhofer P.; Weiss R.; Dubourg V.; Vanderplas J.; Passos A.; Cournapeau D.; Brucher M.; Perrot M.; Duchesnay É.. Scikit-Learn: Machine Learning in Python. 2018, arXiv:12010490 Cs. [Google Scholar]
- Ralaivola L.; Swamidass S. J.; Saigo H.; Baldi P. Graph Kernels for Chemical Informatics. Neural Networks 2005, 18, 1093–1110. 10.1016/j.neunet.2005.07.009. [DOI] [PubMed] [Google Scholar]
- Rodríguez-Pérez R.; Vogt M.; Bajorath J. Support Vector Machine Classification and Regression Prioritize Different Structural Features for Binary Compound Activity and Potency Value Prediction. ACS Omega 2017, 2, 6371–6379. 10.1021/acsomega.7b01079. [DOI] [PMC free article] [PubMed] [Google Scholar]
- Balfer J.; Bajorath J. Visualization and Interpretation of Support Vector Machine Activity Predictions. J. Chem. Inf. Model. 2015, 55, 1136–1147. 10.1021/acs.jcim.5b00175. [DOI] [PubMed] [Google Scholar]
- Zahrt A. F.; Henle J. J.; Denmark S. E. Cautionary Guidelines for Machine Learning Studies with Combinatorial Datasets. ACS Comb. Sci. 2020, 22, 586–591. 10.1021/acscombsci.0c00118. [DOI] [PubMed] [Google Scholar]
- Schwaller P.; Probst D.; Vaucher A. C.; Nair V. H.; Kreutter D.; Laino T.; Reymond J.-L. Mapping the Space of Chemical Reactions Using Attention-Based Neural Networks. Nat. Mach. Intell. 2021, 3, 144–152. 10.1038/s42256-020-00284-w. [DOI] [Google Scholar]
- Ingle G. K.; Mormino M. G.; Wojtas L.; Antilla J. C. Chiral Phosphoric Acid-Catalyzed Addition of Thiols to N-Acyl Imines: Access to Chiral N,S-Acetals. Org. Lett. 2011, 13, 4822–4825. 10.1021/ol201899c. [DOI] [PubMed] [Google Scholar]
- Yamanaka M.; Itoh J.; Fuchibe K.; Akiyama T. Chiral Brønsted Acid Catalyzed Enantioselective Mannich-Type Reaction. J. Am. Chem. Soc. 2007, 129, 6756–6764. 10.1021/ja0684803. [DOI] [PubMed] [Google Scholar]
- Balfer J.; Bajorath J.. Visualization and Interpretation of Support Vector Machine Activity Predictions; Zenodo, 2015. [DOI] [PubMed] [Google Scholar]
Associated Data
This section collects any data citations, data availability statements, or supplementary materials included in this article.