

Abstract
Physical and chemical parameters that mimic the physiological niche of the human body have an influence on stem cell fate by creating directional signals to cells. Micro/nano cell-patterned polydimethylsiloxane (PDMS) substrates, due to their ability to mimic the physiological niche, have been widely used in surface modification. Integration of other factors such as the biochemical coating on the surface can achieve more similar microenvironmental conditions and promote stem cell differentiation to the target cell line. Herein, we investigated the effect of physical topography, chemical functionalization by acid bone lysate (ABL) nanocoating, and the combined functionalization of the bone proteins’ nanocoated surface and the topographically modified surface. We prepared four distinguishing surfaces: plain PDMS, physically modified PDMS by 3D cell topography patterning, chemically modified PDMS with bone protein nanocoating, and chemically modified nano 3D cell-imprinted PDMS by bone proteins (ABL). Characterization of extracted ABL was carried out by Bradford staining and sodium dodecyl sulfate polyacrylamide gel electrophoresis analysis, followed by the MTT assay for evaluation of cell viability on ABL-coated PDMS. Moreover, field emission scanning electron microscopy and profilometry were used for the determination of optimal coating thickness, and the appropriate coating concentration was identified and used in the study. The binding and retention of ABL to PDMS were confirmed by Fourier transform infrared spectroscopy and bicinchoninic acid assay. Sessile drop static water contact angle measurements on substrates showed that the combined chemical functionalization and nano 3D cell-imprinting on the PDMS surface improved surface wettability by 66% compared to plain PDMS. The results of ALP measurement, alizarin red S staining, immunofluorescence staining, and real-time PCR showed that the nano 3D cell-imprinted PDMS surface functionalized by extracted bone proteins, ABL, is able to guide the fate of adipose derived stem cellss toward osteogenic differentiation. Eventually, chemical modification of the cell-imprinted PDMS substrate by bone protein extraction not only improved the cell adhesion and proliferation but also contributed to the topographical effect itself and caused a significant synergistic influence on the process of osteogenic differentiation.
1. Introduction
Cells can translate their morphology and substrate chemistry into cell fate decisions. One of the most influential microenvironments on the stem cell fate is the extracellular matrix (ECM).1−3 ECM, due to its unique chemical, mechanical, and physical properties, provides appropriate conditions for cells’ vital activities such as adhesion, migration, proliferation, and differentiation.4 Additionally, during embryonic development, various factors such as morphological features and mechanical loadings can also influence the cell fate.5 Once stem cells leave their niche, they lose their developmental potential immediately, limiting their application in stem cell therapy.6 Despite widespread scientific attempts to create an effective, dependable, and cost-effective ECM, these features have not been achieved. Due to the hierarchal structure of the ECM, the basic geometries that have been used in studies up to now have not been able to mimic the natural structure of ECM sufficiently. In fact, creating an appropriate topography for each cell type requires a lot of trial and error.7
Paying attention to the factors affecting cell retention after transplantation and balancing the cell fate can help establish a robust method of cell therapy.8−10 Moreover, physical features have a great influence on the stem cell proliferation, migration, and differentiation through mimicking the natural niche for each special cell.11−14 Accordingly, a culture substrate that mimics the surface topography and shape of the natural ECM can be used to stimulate stem cell development.15−19 Each distinguished pattern might be able to guide the stem cells to a distinct lineage.20 Using nanopit topographies, for example, has been demonstrated to drive the stem cell fate toward osteogenesis,13,21,22 while nanoridge/groove patterns encourage neurogenic differentiation of these cells.23−26
Besides patterns, topographical feature dimensions are another important characteristic of the culture substrate.11,27 For instance, topographies with a microscale dimension have been demonstrated to stimulate cytoskeleton formation and differentiation;28,29 on the other hand, patterns with a nanoscale dimension are known to generate interconnected cell–cell interactive networks.30−32 Several studies have employed the cell-imprinting strategy for stem cell differentiation. In this method, specific patterns of target cells were used as the cell culture substrate. Their results approved that the topographical features can promote cell activity and lineage specification on their own.33−35 The cell-imprinting method has been used to differentiate stem cells toward chondrocytes,33 tenocytes,35 keratinocytes,34 and osteocytes,36 which has opened up a new line to the field of physical stem cell differentiation. Moreover, in another study, differentiation of mesenchymal stem cells toward myoblasts was confirmed by applying the myoblast-imprinted substrates.37
Another important property for determining the fate of stem cells is the chemical composition and growth factors in the tissue. By preparing the natural compounds on the surface of stem cell culture, closer conditions can be provided for stem cell differentiation to distinctive cell lines. Bone induction and differentiation are the most important factors in bone tissue engineering which are guided by both the background (microenvironment/ECM) and biomechanics (physical forces). Biomaterials such as collagens, hydroxyapatite, proteoglycans, and cell adhesion glycoproteins, including fibronectins and laminin, showed an awesome effect on bone induction and differentiation.38 On the other hand, the demineralized bone matrix has been widely used for bone regeneration since Uris’s discovery of bone morphogenetic proteins (BMPs) in the 1960s.39 However, other studies showed that the inorganic mineral40 and growth factors innate to the bone, especially TGF-β, are removed during the demineralization process. Aiming to preserve the total bone protein, acid bone lysate (ABL) isolated from rat long bones was used. In a previous study, proteomic analysis of ABL and the whole-genome microarray demonstrated the presence of 394 bone-derived proteins including TGF-β1 that are independent of their harvested source and also multiple clusters including ribosomal protein and collagens. In addition, their results showed that ABL activates the TGF-β target genes interleukin 11, proteoglycan 4, and NADPH oxidase 4.41 Although the exact role of growth factors in ABL is not clear still, TGF-β1 is known as one of the factors that induces migration of mesenchymal stem cells42,43 and targets osteoclasts.44 As a result, because of preserving a large number of bone growth factors, ABL was assumed as an appropriate selection for simulation of bone niche.
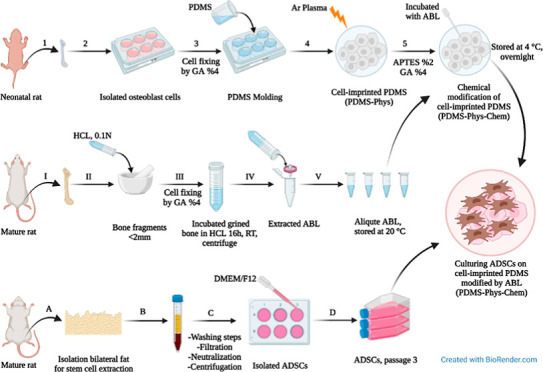
In this study, we used adipose-derived stem cells (ADSCs) to identify the performance of a nanocoated 3D cell culture of bone proteins. To investigate the effect of chemical modification and surface topography on ADSC differentiation to osteoblasts, a culture surface was designed using polydimethylsiloxane (PDMS). The PDMS substrate was made by the 3D cell-imprinting topography method, then coated with a nanometric layer of ABL solution using 3-aminopropyltriethoxysilane (APTES) and glutaraldehyde (GA) as cross-linkers. This system was employed to direct osteogenic differentiation of ADSCs based on chemical and physical approaches. Preparing a cell-imprinted substrate needs osteoblast cells obtained from long bones of neonatal rats.45 Isolated osteoblast cells from long bones were used in the current work because they provide higher numbers of cells than the calvarial bone and are relatively easy to obtain, making it ideal for experimental purposes. Finally, we prepared different surfaces by physical and chemical surface modification and then evaluated the synergistic effect of ABL nanocoating on the 3D cell-imprinted topography for osteogenic differentiation.
2. Materials and Methods
2.1. Cell Isolation, Expansion, and Characterization
2.1.1. Osteoblast Cell Isolation
All the experiments were approved by the Ethics Committee of the Pasteur Institute of Iran, and all methods were performed in accordance with the relevant guidelines and regulations. This study was carried out in compliance with the ARRIVE guidelines. Osteoblast cells were isolated from long bones (i.e., humerus, radius, metacarpus, femur, tibia, fibula, and metatarsus) of 3 day old neonatal rats. Rats were sterilized with 70% ethanol and their head and body were cut off using large scissors. The limbs were cut off from the body using sharp scissors, then using a scalpel the paws and limbs were cut off at the joint, and the skin and soft tissue were scraped. The epiphysis was cut off, and bone fragments were immersed in sterilized phosphate-buffered saline (PBS) to remove any residual soft tissue. Afterward, they were incubated in trypsin (0.25% in sterilized PBS, 1 mL per animal) for 15 min at 37 °C. The fragments were washed in Dulbecco’s modified Eagle’s medium (DMEM) (Gibco, Switzerland) and were incubated in collagenase type II (2% in sterilized PBS, 1 mL) for 30 min at 37 °C after discarding the trypsin solution. The collagenase digest was removed and replaced with a fresh collagenase solution and incubated for further 30 min at 37 °C. The final digest was centrifuged (at 1500g, 5 min), the supernate was discarded, and the cells were resuspended in DMEM (1 mL). The obtained cell suspension was cultured in proprietary bone culture medium containing DMEM supplemented with ascorbate (50 μg/mL), dexamethasone (10 nM), and β-glycerol phosphate (4 mM) and 10% fetal bovine serum (FBS, Gibco) including penicillin (100 IU/mL) and streptomycin (100 μg/mL) (Sigma, United States).45 The culture medium was changed 1 day after isolation of the osteoblast to remove lymphocytes and suspended cells. Five days post cell culture, the cells reached 90% confluence at passage zero which is suitable for cell-imprinted patterning.
2.1.2. Characterization of Isolated Osteoblasts
At first, crystal violet staining was used to study the shape, population, and precision of live osteoblast cell isolation. The isolated cells were characterized using alizarin red S and osteocalcin (OCN) immunofluorescence (IF) staining. For alizarin red S and crystal violet staining, 4 day old cells were fixed in 4% GA solution for 20 min at 25 °C. Then, they were washed with sterilized water and stained by adding a fresh alizarin red S (Sigma) solution, pH 4.2, for 10 min and crystal violet for 30 min at 25 °C. Finally, cells were washed with PBS solution and photographed using an optical microscope (BEL, INV2, Italy). For OCN IF staining of isolated cells, the presented protocol at the IF staining part was carried out.
2.1.3. Adipose-Derived Stem Cell Isolation
ADSCs were isolated from bilateral inguinal fat pads of healthy rats (Wistar albino, male, 250) and allogeneic cells were used for the study. First, adipose tissues were washed three times in PBS with 3% penicillin/streptomycin (Sigma), then they were cut into 1–2 mm slices and digested in 0.01 mg/mL collagenase Type I (Sigma, United States) at 37 °C for 2 h. The solution was passed through a 75 μm filter to remove the undigested tissue, followed by neutralization of the enzyme with DMEM (Gibco) containing 10% FBS; finally, they were centrifuged at 1300 rpm for 5 min in order to separate the cellular pellets. The obtained solution consisting of ADSCs was cultured in DMEM/Ham’s F12 supplemented with 10% FBS (Gibco) and penicillin/streptomycin (100 IU/mL and 100 μg/mL, Sigma, United States) and was incubated at 37 °C in a 5% CO2 incubator.46 After 72 h, non-adherent cells were discarded, and the medium was changed every 3 days. The ADSCs at the third passage were used for differentiation evaluation.
2.2. Fabrication of Cell-Imprinted Substrates
PDMS (SYLGARD 184, RTV, Dow Corning, USA) was used for the fabrication of cell-imprinted substrates. The silicone resin and the curing agent were mixed in a 10:1 (w/w) ratio according to the manufacturer’s instruction. Extracted osteoblast cells from neonatal rat bone with a 90% confluency were fixed using a 4% GA solution for 1 h and were washed with deionized water. The resin–curing agent mixture was poured on the fixed cells and retained at 37 °C for 48 h to transfer the cell pattern into the PDMS. The cured silicone rubber was then peeled from the fixed cells, followed by washing in 1 M NaOH solution to remove the remaining cells/debris and other chemicals from the substrates. The mass of resin curing and the curing time were the same for all the samples.35
2.3. Isolation and Characterization of ABL
Adult male rat long bones are used to create ABL following the removal of the soft tissue. Then, the bone ends were removed, and the bone marrow was flushed with PBS (Figure 2A). Clean bone fragments were ground in a mortar with a pestle to an average size of <2 mm and washed with DMEM supplemented with antibiotics (Invitrogen Corporation, Carlsbad, CA, USA). Ten grams of ground bone were incubated with 50 mL of 0.1 N HCL (20% weight/volume) for 16 h at 25 °C under stirring. Then, the harvested solution was centrifuged at 1200 rpm for 10 min, the pH was neutralized, and after the second centrifugation at 1200 rpm for 10 min, the obtained solution was named ABL, which was filtered using a 0.2 μm syringe filter and stored at −20 °C. Before each experiment, stocks were thawed and used immediately.47 The protein concentration of ABL was quantitated by the Bradford protein assay and verified by means of UV–vis spectrophotometry (Biophotometer 6131, Eppendorf) at 595 nm. A standard sample was prepared with bovine serum albumin (BSA) as a control for this experiment.48 To prove the existence of a complex of proteins with different molecular weights in ABL solution, sodium dodecyl sulfate polyacrylamide gel electrophoresis (SDS-PAGE) with 12% acrylamide gradient gels was applied. The samples were run by the reducing method, and Coomassie brilliant blue R 250 was used for gel staining. Pictures of gels were taken using a Gel Doc imaging system (Bio-Rad, Italy).
Figure 2.

(A) Extracted long bone from neonatal rat, (B) crystal violet staining of the isolated osteoblast cells after 5 days (original magnification ×100). (C) Microscopic image (original magnification ×100) and plate view of Alizarin red S staining of isolated osteoblast cells versus ADSC cells as a negative control. (D) IF staining of the isolated osteoblast cultured on a plate by the FITC-conjugated antibody for OCN labeling and Hoechst staining for the cell nucleus.
2.4. PDMS Surface Modification for ABL Binding
PDMS substrates, with and without cell-imprinted patterns, were treated with an argon plasma for 3 min at a pressure of 0.3 mbar, followed by their immersion in 2% 3-aminopropyl triethoxysilane (APTES) (Sigma-Aldrich, USA) at 50 °C for 2 h. After removing the APTES solution and washing twice with nuclease-free water, the samples were stored in a desiccator over 4% GA (Sigma-Aldrich, USA) solution as a cross-linker overnight. Thereafter, the samples were washed thrice with nuclease-free water, sterilized at ethanol 70%, and placed under UV light for 45 min. Eventually, the samples were incubated with ABL solution, followed by storage at 4 °C overnight, then the ABL solution was removed, and samples were washed with nuclease-free water.49 A schematic presentation of the surface modification of PDMS is depicted in Figure 1. Pezzotti et al.50 have previously observed that after cell seeding on silicon, the cells scavenged Si from silicic acid and used part of it to build phosphorus.
Figure 1.

Schematic presentation of PDMS surface modification by APTES, GA, and ABL.
2.5. Determination of the Optimal ABL Concentration
2.5.1. Field Emission Scanning Electron Microscopy
In order to select the proper thickness of ABL on the cell-imprinted PDMS, a field emission (FE) scanning electron microscope (Zeiss, SUPRA TM 40) was used. Due to the presence of pits on the PDMS surface which results in a high error in thickness determination, a silicon wafer was used as a model sample for thickness determination. The clean silicon wafers were incubated with 100, 70, 30, and 10% of the initial concentration of ABL solution. To capture the FESEM images, silicon wafer substrates were cut cross-sectionally, and a 5 nm platinum layer was coated on the studied surface by sputtering. Finally, surfaces were observed using the FESEM microscope.
2.5.2. Profilometry
The thickness of the ABL layer coated on the silicon wafer as a model sample was measured using a contact surface profilometer equipped with a diamond stylus tip (Taylor-Hobson, Form Talysurf 120L). The silicon wafers were incubated with 100, 70, 30, and 10% of the initial concentration of ABL solution. To determine the thickness of the coating layer, part of the samples was covered by a parafilm tape to create a border between the coated and uncoated areas. Then, the difference between the two parts was measured.
2.6. Cell Viability of the Chemically Modified Surface by the MTT Assay
To evaluate the effect of chemical modification of PDMS by the ABL coating on cell viability, the MTT (3-[4,5-dimethythiazol-2-yl]-2,5-diphenyltetrazolium bromide; Sigma) assay was performed. ABL at an optimum concentration, obtained by FESEM and profilometry, was coated on the PDMS substrate as described earlier by the chemical surface modification method. Before cell seeding, a plain PDMS substrate was immersed in 70% ethanol for 30 min and dried under a laminar hood, followed by UV light irradiation for 45 min. MG-63 cells with a density of 104 cells/well were seeded on the sterilized samples and a tissue culture plate as the control and incubated for 3, 5, and 7 days. At all time points, the MTT solution at a concentration of 0.5 mg/mL was added to each well, then cells were stored in the incubator for 4 h at 37 °C. After the formation of formazan crystals, the medium was removed, and the crystals were dissolved in isopropanol. The plate was placed in the orbital shaker for 15 min to enhance the dissolution process. Optical density was measured using the Elisa reader (ELX800 Universal Microplate Reader, BIO-TEK Instruments, USA) at 570 nm. Finally, eq 1 was used to calculate the cell viability and compared to control. The evaluation was repeated three times.
| 1 |
2.7. Characterization of the ABL-Coated Substrate
2.7.1. Chemical Characterization of the Coating
PDMS modification steps were scanned over a scanning region of 400–4000 cm–1, using attenuated total reflection-Fourier transform infrared (ATR-FTIR) spectroscopy (Shimadzu IRPrestige-21), and infrared transmission spectra with characteristic peaks were recorded. Spectra of plain PDMS, plasma-treated PDMS + APTES + GA, and plasma-treated PDMS + APTES + GA + ABL were recorded to investigate surface changes after each grafting step.
2.7.2. Hydrophilicity Measurement by Contact Angle
Water (deionized) droplet contact angle (CA) measurement was performed on the plain PDMS, physically modified PDMS by the cell topography pattern (PDMS-Phys), chemically modified PDMS with APTES + GA + ABL (PDMS-Chem), and chemically modified PDMS consisting of the cell topography pattern by APTES + GA + ABL (PDMS-Phys-Chem) surfaces to analyze hydrophilicity of the physically and chemically modified/unmodified substrates after 14 and 21 days, using the static sessile drop method (Krüss, Germany).
2.7.3. Stability Analysis of Immobilized Protein
In order to evaluate ABL’s protein attachment and stability of protein retention on the PDMS-Chem and PDMS-Phys-Chem substrates, a micro-bicinchoninic acid (BCA) protein assay kit (Thermo Scientific, USA) was used. Protein retention on the plain PDMS as the control substrate was measured to compare with the amounts of attached and remained proteins on physically and chemically modified substrates. For PDMS-Chem and PDMS-Phys-Chem, ABL (12 μg/mL) was coated on the PDMS substrates as described in the chemical surface modification method, and plain PDMS as a control group was incubated with ABL solution at the same concentration and stored at 4 °C overnight. The prepared substrates were stored under cell incubation conditions (5% CO2 at 37 °C in sterilized 1× PBS buffer, pH 7.2). This assay was evaluated on days 0, 14, and 21 after protein attachment. At the specific time points, the samples (4 cm2) were treated with 0.05% Tween 20 (Sigma-Aldrich, USA) for 30 min, and they were washed twice with nuclease-free water to remove non-adherent proteins. Finally, the number of proteins retained on the surfaces was measured according to the standard protocol of the kit. The absorbance of samples was measured at 562 nm with a Multiskan Spectrum microplate reader (Thermo Scientific, Singapore). For all substrates, the percentage ratio of attached and retained proteins to the initial concentration was calculated at all time points.
2.8. Cell Seeding on Fabricated PDMS
Fabricated PDMS substrates were sterilized before stem cell seeding. The PDMS substrates were immersed in 70% ethanol for 30 min and dried under a laminar hood, followed by UV light irradiation for 40 min. The sterilized substrates were fitted into the 6-well culture plates. ADSCs (1 × 10⁴ cells per cm2 in 100 μL of culture medium) at passage three were seeded on five different points of a 6-well culture plate on the following samples and were eventually incubated at 37 °C: plain PDMS, PDMS-Phys, PDMS-Chem, and PDMS-Phys-Chem. After 5 h, 1 mL of fresh culture medium DMEM/Ham’s F12 (3:1 ratio) and 10% (v/v) FBS were added to cover the whole surface of the substrates. Culture plates were incubated at 37 °C with 5% CO2 for 21 days, and half of the medium was replaced with fresh medium every 2–3 days.
2.9. Evaluation of the Osteogenic Differentiation
2.9.1. Alkaline Phosphatase Assay
ALP activity was investigated as one of the osteogenic differentiation factors. ADSCs were cultured on the 6-well polystyrene plate, plain PDMS, PDMS-Phys, PDMS-Chem, and PDMS-Phys-Chem substrates (3 × 10³ cells per well) in DMEM/Ham’s F12 consisting of 10% FBS. After 14 and 21 days, the medium was collected and analyzed using an autoanalyzer (Hitachi 917, Germany) and the alkaline phosphatase kit (Pars Azmoon, Iran) according to its standard protocol based on the DGKC method. The absorbance was read at 405 nm.
2.9.2. Crystal Violet and Alizarin Red S Staining
The ADSCs (5 × 10³) were seeded into the 6-well polystyrene plate, plain PDMS, PDMS-Phys, PDMS-Chem, and PDMS-Phys-Chem substrates for 14 and 21 days. After 14 days, the cells were fixed with 4% GA solution for 24 h. Analysis of viable cells was evaluated by the crystal violet staining method. Fixed cells were stained with 1% crystal violet in 50% methanol for 10 min at 25 °C on a shaker, then washed four times with distilled water. Viable cells on different substrates were observed under an optical microscope (BEL, INV2, Italy). Afterward, for quantification of the staining, the plates without a lid were dried at 25 °C for 4 h 1 mL methanol was added to each well, and the plates with their lids on were incubated for 20 min at 25 °C on a shaker. The optical density of each well at 570 nm was measured with the Elisa reader (ELX800 Universal Microplate Reader, BioTek Instruments, USA). The calcium deposited from the cells as a result of osteogenic differentiation was examined using alizarin red S staining on fixed cells. After 14 and 21 days, cells were washed three times with PBS, fixed with 4% paraformaldehyde in PBS (pH 7.4) for 15 min, incubated with alizarin red S (pH 4.2; Sigma-Aldrich) for 30 min at 25 °C, and washed three times with distilled water, then the samples were visualized under an optical microscope (BEL, INV2, Italy). For quantification of ECM mineralization by alizarin red S staining, cells were incubated with 10% acetic for 30 min at 25 °C. Afterward, supernatants were collected from all substrates and heated at 85 °C for 15 min, cooled with ice for 5 min, and centrifuged at 20,000g for 15 min. Supernatants were collected and pH adjusted (4.1–4.5) with 10% ammonium hydroxide. Finally, the absorbance at 405 nm was detected for all samples using the Elisa reader.
2.9.3. IF Staining
IF staining was done for ADSCs (5 × 10³ cells in 6-well size plate) cultured on a plate, plain PDMS, PDMS-Phys, PDMS-Chem, and PDMS-Phys-Chem substrates after 21 days. The cells on the substrates were fixed by immersion in 4% formaldehyde in PBS for 15 min, followed by washing with cold PBS three times, 5 min each. To permeabilize cell membranes, samples were incubated in 0.25% Triton X-100 in PBS for 10 min, followed by washing samples with PBS for 5 min, and this step was repeated three times. To block non-specific labeling protein, the samples were incubated with BSA 1% for 30 min at 25 °C. Substrates consisting of fixed cells were incubated in the OCN primary antibody (1:200 in PBS, rat polyclonal anti-OCN, Abcam, USA) overnight at 4 °C, followed by washing with PBS as described in the previous steps. Afterward, samples were incubated for 1 h with a secondary antibody (1: 100 dilutions with PBS, Abcam, USA) FITC-conjugated in the dark at 25 °C and washed as described previously. Finally, Hoechst (Sigma-Aldrich, St. Louis, USA) was added to nuclear staining, and the samples were visualized using a fluorescence microscope (Zeiss LSM 510 Meta).
2.9.4. Real-Time PCR
The expression of bone-specific genes was assessed for ADSCs cultured on plate, plain PDMS, PDMS-Phys, PDMS-Chem, and PDMS-Phys-Chem substrates after 21 days using real-time PCR. Total RNA of cells was extracted using RNX-Plus solution (Qiagen, Germany). Then, DNA was removed from solutions, and the concentration of RNA samples was quantified by measuring the absorbance at 260 using a spectrophotometer (NanoDrop 1000, ThermoScientific, USA). Eventually, the complementary DNA (cDNA) was synthesized according to the manufacturer’s instructions of the cDNA synthesis kit (Qiagen, United States). The StepOne real-time PCR system (ABI) was used for the PCR assay. Each reaction contained 20 μL SYBR PCR Master Mix, 4 μL cDNA, 4.4 μL of RNAse-free water, and 0.8 μL of each primer. The primer’s sequences are listed in Table 1. Amplification conditions for the PCR were adjusted for an initial denaturation at 95 °C for 2 min, followed by 40 cycles at 95 °C for 5 s and 60 °C for 25 s. The Col1a1, OCN, and RUNX2 as target genes and GAPDH as the housekeeping gene were studied. Finally, to analyze differences in Ct values, the relative fold change method (2–ΔΔCT) was used. Experiments were performed twice, using three technical replicates per sample. Moreover, gene expression of osteoblast was measured as a positive control and compared with all samples. The sequences of primers used in real-time PCR are summarized in Table 1.
Table 1. Sequences of Primers Used in Real-Time PCR.
| gene | sequence | length (nt) | product length (nt) | Tm (°C) |
|---|---|---|---|---|
| RUNX2 | TTCGTCAGCGTCCTATCAGTTCC | 23 | 150 | 60.4 |
| CTTCCATCAGCGTCAACACCA | 21 | 60.8 | ||
| Col1a1 | GGACACTACCCTCAAGAGCCTG | 22 | 129 | 61.9 |
| TACTCTCCGCTCTTCCAGTCAGA | 23 | 61 | ||
| OCN | ACAAAGCCTTCATGTCCAAGCA | 22 | 217 | 60.9 |
| GACATGCCCTAAACGGTGGT | 20 | 61.2 | ||
| GAPDH | GGCATCCTGGGCTACACTGA | 20 | 157 | 62.5 |
| CCCTGTTCCTGTAGCCATATTCA | 23 | 62.9 |
2.10. Statistical Analyses
Statistical analysis was performed using the Origin program. Data were statistically analyzed using one-way analysis of ANOVA, followed by Tukey multiple comparison tests to determine the statistical significance. The probability level at which differences were considered significant was P < 0.05.
3. Results and Discussion
3.1. Characterization of Isolated Osteoblast
Figure 2A shows the isolated bone from a neonatal rat that was used for osteoblast cell extraction. The signed section was used for the cell isolation. Crystal violet and alizarin red S staining of isolated cells from neonatal rat bone confirmed the proper isolation of osteoblast cells. Figure 2B shows the crystal violet staining of isolated osteoblast after 5 days of culture, and it confirms that the cells were alive before they were fixed. Alizarin red S staining of isolated osteoblast compared to ADSCs as negative control is shown in Figure 2C. The intensity of alizarin red S staining in the plate view and microscopic images indicates the high purity of osteoblast cell isolation. Further confirmation was obtained by IF staining of OCN for isolated osteoblast cells. Figure 2D shows the IF staining of isolated osteoblast cells, in which OCN was stained with green color and the nuclei were stained with blue color. The merged picture indicates that the nuclei were embedded within OCN proteins, confirming the identity of the isolated cells as osteoblast.
3.2. Topographical Features
Mahmoudi et al. revealed that the PDMS mold-casting system can transfer cellular features to the imprinted substrates at the nanoscale resolution.33 In agreement with their finding, here the optical image of osteoblast-imprinted PDMS indicated the topographical features, and the surface structure of the cells is finely imprinted onto the fabricated PDMS substrates (Figure S1). In our prior study, this assumption was confirmed by SEM and AFM images from osteoblast-imprinted substrates.36
Although some other techniques such as aerosol jet and other additive manufacturing methods have provided very exciting results in terms of preparing the special topographic substrates,51 for simulating the cells pattern due to the specific topography of cells and very tiny dimensions of cell structure, the additive manufacturing methods can not be as precise as desirable. Therefore, the cell-imprinting technique by using PDMS could be the most appropriate choice for this target.
3.3. Characterization of ABL
ABL was utilized for chemical surface modification of the PDMS substrate to investigate its effect on stem cell differentiation. For this purpose, ABL was isolated from rat long bones (Figure S2). The concentration of total protein content of ABL was calculated by the Bradford assay to be 40 μg/μL. In this study, the SDS-PAGE assay is used to prove the existence of a complex of proteins with different molecular weights in ABL solution and is shown in Figure 3. The appearance of the wide range of bands in the SDS-PAGE gel indicates the presence of a diversity of proteins and growth factors in the ABL solution. Strauss et al.47 have previously performed a comprehensive proteomic analysis of ABL, which has revealed 394 proteins including TGF-β1 (1.3 ± 0.2 ng/mL). Their results indicated the presence of ribosomal protein in ABL solution, in addition to collagens and TGF-β1. Using the panther system, they showed ABL proteins can be classified into 8, 12 and 7 groups according to their molecular function, biological process, and cellular component, respectively. The majority of ABL proteins were linked to transporter regulator activity (46%) and catalytic activity (28.5%). Moreover, the cellular process and metabolic process were represented by 26.5 and 18.6% of the proteins, respectively. The majority of the proteins originated from cells (37.1%) and organelles (24.5%).
Figure 3.

Quantification of ABL’s proteins by SDS-PAGE. The test was repeated twice to obtain reliable results (R1 and R2). The gel pictures were cropped and full-length gels are presented in the Supporting Information (Figure S3).
3.4. Determining the Optimum Concentration of ABL Based on the Coating Thickness and Evaluating the Cytocompatibility of the Coating
The ABL solution at 100, 70, 30, and 10% of initial concentration was coated on the substrate. The coated substrates were further analyzed by FESEM and profilometry to measure the obtained protein thickness. Figure 4. Shows the FESEM pictures of the protein coating on the surfaces. As expected, the maximum thickness of about 375 nm is obtained by applying 100% ABL solution. Using a diluted solution of 70%, the thickness does not vary significantly, and in fact we have reached a thickness of approximately 240 nm. Decreasing the ABL solution concentration to 30% and 10% has resulted in approximately 45 and 36 nm thick ABL coating, respectively.
Figure 4.

Cross-sectional FESEM micrographs of (A) 100%, (B) 70%, (C) 30%, and (D) 10% of initial concentration of ABL. The images of the non-coated surface as the control are presented in the Supporting Information (Figure S4).
Furthermore, to confirm the results obtained by FESEM, the thickness of the ABL coating at different concentrations was measured using a profilometer, and the results are summarized in Table 2. These results are in line with the FESEM observations, and the thickness values are in the same order of magnitude. From a previous study, in which the osteoblast-imprinted PDMS surface was quantitatively analyzed using AFM, we know that the maximum thickness of about 50 nm is the thickness that preserves most of the osteoblast-imprinted pattern’s details. This limitation for the coating thickness has been calculated by considering the difference in height at different points of the cell patterns due to specific cell topography.36 Among the obtained protein coatings, 50 nm thickness, obtained by 30% of ABL concentration, offers us the optimum thickness. In fact, 50 nm thickness allows us to successfully bind ABL proteins to the substrate without fully covering the cell-imprinted patterns, a fundamental contributor to the cell’s fate. In other words, 50 nm ABL coating not only offers an effective protein coating for ADSC sensing (chemical effect) but also allows the cell-imprinted topography to contribute to the cells fate (physical effect). On the other hand, 100 and 70% of ABL fill the cell pattern and make that topographic effect ineffective. Although thicknesses greater than 50 nm for the areas close to the nucleus do not eliminate the topographic effect, the less-height parts and the corners of the cell pattern eliminate the topographic effect. Therefore, in this study, the concentration of 30% is selected to further investigate surface characteristics and ADSC differentiation.
Table 2. Results of ABL Coating Thickness Profile Measurementsa.
| concentration rate of ABL solution (%) | coating thickness (nm) |
|---|---|
| 100 | 374 ± 4 |
| 70 | 231 ± 7 |
| 30 | 50.7 ± 12 |
| 10 | 44.7 ± 10 |
The data were presented with a 90 percent confidence interval
Furthermore, to evaluate the impact of chemical modification of PDMS on the viability of the cells, the MTT assay was measured. Figure 5 shows the cell viability of MG-63 cells after 3, 5, and 7 days of direct contact with plain PDMS-and ABL-coated PDMS (chemically modified marked as PDMS-ABL in Figure 5). The standard cell culture plate was used as a control. Clearly, the plain PDMS substrate shows poor cell attachment and cell viability because of the PDMS surface’s hydrophobicity compared to the cell culture plate, while there is no significant difference between cell viability of the culture plate and the chemically modified PDMS after 5 and 7 days of culture. The results also confirm the cytocompatibility of the ABL-coated PDMS surface.
Figure 5.

Cell viability of the MG-63 cell line on the plain PDMS and the chemically modified PDMS substrate by the ABL coating (PDMS-ABL). The standard cell culture plate was used as a control group. The data are shown as the mean ± SD. ***p value of <0.001 between two groups. p-value of ≥0.05, (ns) indicates a statistically non-significant result.
3.5. Characterization of the ABL-Immobilized PDMS Surface
In order to observe the attached functional groups after chemical surface modification of PDMS, FTIR spectrophotometry analysis was carried out. For this purpose, the ATR–FTIR spectra of plain PDMS, plasma-treated PDMS + APTES + GA, and plasma-treated PDMS + APTES + GA + ABL substrates were recorded and are shown in Figure 6. For the plain PDMS, an absorption band appears at 2960 cm–1, which is a typical band of the C–H methyl stretch, while the absorption band at 1254 cm–1 is related to Si–CH3. Moreover, the strong bands for the wavenumber between 1000–1100 cm–1 are related to the asymmetric stretching vibration of Si–O bonds. In fact, the peak at 1008 cm–1 is associated with the Si–O–Si asymmetric stretching vibration, while that at 1054 cm–1 is associated with the vibration of the Si–O bond in Si–O–C, and the peak at 798 cm–1 is attributed to the Si–CH3 bending vibration in plain PDMS.52,53 After the APTES and GA conjugation, a new small broad peak appeared around 1559 cm–1, which is attributed to the formation of amine bicarbonate salt (−HN3(HCO3)).52 In fact, the appearance of the absorption band around 1624 cm–1 confirms the N–H presence due to APTES treatment. Emerging of a small peak around 1662 cm–1 is related to the vibration of the imine bond (C=N) due to GA cross-linking.54 Eventually, after coating PDMS with the ABL solution, the absorption bands of proteins emerged in the 3300–3500 region cm–1 which are related to the N–H vibration of peptide groups. The characteristic peaks of collagen functional groups appeared around 3370— and 1630 cm–1 which are associated with the O–H and N–H stretching vibration of collagen. Moreover, the peaks that appeared around 1558— and 1472 cm–1 could be related to the peptide carbonyl group (−C=O) stretching vibration of amide I and N–H bending of amide II, respectively,55,56 which possibly exist due to the presence of other proteins and growth factors in the ABL solution. These results confirmed that applying the mentioned chemical surface modification method, the collagen and other ECM proteins of the ABL solution were successfully attached to the PDMS substrate.
Figure 6.

FTIR-ATR spectra of plain PDMS, plasma-treated PDMS + APTES + GA, and plasma-treated PDMS + APTES + GA + ABL at the wavenumber between 500— and 4500 cm–1.
Another important factor related to chemical substrate improvement is surface wettability. In this regard, the surface static CA measurements of plain PDMS and modified PDMS surfaces (PDMS-Phys, PDMS-Chem, PDMS-Phys-Chem) were evaluated by the sessile drop method and were repeated after 7 days and 14 days post-treatment. Each measurement was carried out in three different points of the substrate, and its mean values are shown in Figure 7A. Images of CA measurement on different substrates and time points are shown in Figure 7B. Clearly, the plain PDMS surface is hydrophobic with a CA of 109.3 ± 2.14°. Physical and chemical surface modifications show a significant reduction in CAs. The mean CAs for the topographically modified PDMS substrate (PDMS-Phys) was measured to be CA = 88.89 ± 3.54°, while after chemical modifications (PDMS-Chem), it was reduced to CA = 47.21 ± 2.82° meaning a transition from the hydrophobic to hydrophilic surface. This reduction of water CA was even more profound when both topographical and chemical modifications were performed on PDMS (PDMS-Phys-Chem) reaching a CA of 37.19 ± 2.42°. These results confirm the significant success of chemical modification of the PDMS by ABL in increasing substrate wettability toward hydrophilic regions (<70°) for PDMS-Chem and PDMS-Phys-Chem substrates. Such an increase in wettability is based on the formation of amine functional groups on the PDMS surface, which in turn creates hydrogen bonds with water. Kuddannaya et al. have previously reported similar results for reduction of CA after chemical modification of the PDMS by APTES and/or GA.49 These results also justify the higher cell viability of chemically modified PDMS observed in Figure 5.
Figure 7.

(A) Surface hydrophilicity analysis of PDMS surfaces as a function of time. Plain PDMS compared with treated groups; PDMS-Phys (cell-imprinted PDMS), PDMS-Chem (flat PDMS with APTES + GA + ABL), and PDMS-Phys-Chem (cell-imprinted PDMS with APTES + GA + ABL) at days 0, 7, and 14 after surface modification. Error bars indicate the standard deviation of the means n = 3 samples. (B) Picture of a water drop placed on different surfaces for CA measurement. (C) Micro-BCA assay for calculation of the amount of attached and retained proteins on the plain PDMS, PDMS-Chem, and PDMS-Phys-Chem substrates on 0, 14, and 21 days. The graph is represented as the mean ± SD. *p-value of <0.05, **p-value of <0.01, and ***p value of <0.001 between two groups. p value of ≥0.05, Ø represents zero measurement on the plain PDMS.
Moreover, the water CA for the PDMS surface after treatment by plasma, APTES, and GA was measured. Despite the significant effect of silanization on the reduction of water CA, hydrophilicity was lower than the surfaces with the ABL coating at day 0, and CA was measured to be 63.61 ± 2.37°. Furthermore, the results indicate that the chemical modification of the cell-imprinted substrate (PDMS-Phys-Chem) compared to chemical modification of the flat substrate (PDMS-Chem) had a greater reduction in the CA degree due to higher surface roughness in the cell-imprinted substrate. Similar results have been observed by Sharma et al.57 The same trend of surface roughness effect was observed for PDMS-Phys and plain PDMS substrates; however, both remained in the hydrophobic regions.
Furthermore, water CA degrees appear to increase over time for the chemically modified PDMS surfaces (PDMS-Chem and PDMS-Phys-Chem), while these values remain constant for the cell-imprinted and plain PDMS surfaces. The CA for PDMS-Chem and PDMS-Phys-Chem has increased by only 22 and 29%, respectively, even after 7 day post-treatment. This is due to the decomposition of functional groups on the PDMS surface over time. ABL’s protein attachment and retention on their surfaces were analyzed by the micro-BCA assay, and they were compared with those of plain PDMS as a control as shown in Figure 7C. The figure shows the percentage ratio of retained proteins to the initial concentration on the PDMS-Chem and PDMS-Phys-Chem substrates at days 0, 14, and 21. There was no protein attachment on the plain PDMS substrate, while the percentage ratios of attached and remained proteins on the PDMS-Chem substrate on days 0, 14, and 21 compared to the initial concentration were obtained to be 38.2, 29.45, and 26.34%, respectively. These enhance when attachment and retention of proteins were even more profound for PDMS-Phys-Chem and were measured to be 43.8, 33.8, and 27.2% on days 0, 14, and 21, respectively. The first conclusion for these results is the lack of ability for protein attachment on the plain PDMS. In fact, the amount of attached and remained proteins on chemically modified substrates indicates the importance of stable covalent binding between proteins and substrates. Previous studies have shown that the modification of the PDMS surface with APTES and GA as cross-linkers due to the formation of functional groups (−NH2 or −COOH) facilitated effective covalent binding of proteins to the substrate. Akther et al., have previously shown that APTES can be used as a silane connector for binding biomolecules to the PDMS substrate.58 Nonetheless, the result shows a reduction in surface-bound proteins over time that could be related to the degradation of protein under incubation conditions. Desirable results, however, are obtained for both physically and chemically modified substrates (PDMS-Phys-Chem). This means the combination of a cell-imprinted substrate and stable covalent bonding is an appropriate approach to maintain protein binding to the PDMS substrate. Moreover, hydrophilicity of the surface is one of the effective factors for the better absorption and increases the retention of proteins on the PDMS substrate. As previously observed in Figure 7A, the hydrophilicity was decreased over time, therefore it can lead to a lower protein retention. Furthermore, based on the hydrophilicity results, the maximum hydrophilicity is related to the PDMS-Phys-Chem substrate, which shows higher protein bonding and retention. Therefore, from FTIR, CA, and micro-BCA analyses, it could be concluded that the combined nano 3D cell-imprinted substrate and nanocoating bone proteins on the surface (PDMS-Phys-Chem) offer the maximum surface wettability and protein attachment, and its stability over time is improved. In turn, these results could lead to improved cell adhesion, cell proliferation, and differentiation which is further investigated.
3.6. Effect of Substrate Modification on the Cell Adhesion and Proliferation
Cell adhesion and proliferation on the plain PDMS, PDMS-Phys, PDMS-Chem, and PDMS-Phys-Chem substrates were evaluated by crystal violet staining and are shown in Figure 8. By comparing the number of stained cells on each substrate, it is found that cell adhesion and proliferation have significantly improved after surface treatments. The improvement for PDMS-Phys could be attributed to the effect of the cell’s topographic pattern leading to increased surface roughness. As previously reported, the presence of APTES molecules caused more cell adhesion and proliferation on chemically modified PDMS substrates due to enhancement of surface wettability.58 Therefore, there is no surprise to observe an improvement in cell attachment and proliferation on the PDMS-Chem substrate. The difference in optical density of PDMS-Phy and PDMS-Chem was not significant. A similar trend is observed for the combined cell-imprinted PDMS surface and nanocoated bone proteins (PDMS-Phys-Chem). In this case, the combination of the topographical effect of the cell-imprinted surfaces and the presence of APTES and ABL lead to a synergic effect responsible for the highest number of cell adhesion and proliferation.
Figure 8.

Cell attachment and proliferation of ADSCs on PDMS substrates were assessed by crystal violet staining after 14 days. The optical density was measured at 570 nm, and the results are presented as mean ± standard error of three independent experiments. *p-value of <0.05, **p-value of <0.01, and ***-value of <0.001 between two groups. p value of ≥0.05, and (ns) indicates a statistically non-significant result.
3.7. Investigation of Osteogenic Differentiation Potency of Modified Substrates
In order to evaluate the potency of different substrates to guide cells toward osteogenic differentiation, ALP activity was investigated. ALP activity, as an early marker of osteoblast differentiation,59 was measured for cells cultured on plate, plain PDMS, PDMS-Phys, PDMS-Chem, and PDMS-Phys-Chem after 14 and 21 days, and it is shown in Figure 9. The results show that plain PDMS offers higher ALP activity compared to the culture plate. This activity increases significantly after surface topographical changes in PDMS-Phys (p < 0.001). Similar results of an increase in the ALP activity by a cell-imprinted substrate have been reported in a previous study by Kamguyan et al.36 In their study, the ALP activity of cell-imprinted PDMS increased 10% in comparison with that of flat PDMS after 14 days. While in the present study, the increase was more than two times. Chemical modification of the substrate with the ABL nanocoating leads to higher ALP activity, and eventually the combined cell-topographic effect and ABL coating lead to the highest ALP activity on the PDMS-Phys-Chem substrate after 14 days. However, after 21 days, there is no significant difference in ALP activity between PDMS-Chem and PDMS-Phys-Chem.
Figure 9.

ALP activity of ADSCs cultured on the plate, plain PDMS, PDMS-Phys, PDMS-Chem, and PDMS-Phys-Chem after 14 and 21 days. All data are normalized with regard to the optical densities of cells on each substrate and reported as means ± standard deviation (n = 5). *p-value <0.05, **p-value <0.01, and ***p-value <0.001 between two groups. p value ≥0.05, (ns) indicates a statistically non-significant result.
Another marker toward the late stage of osteoblast differentiation indicating a bone formation is the release of calcium from the cells.60 Therefore, alizarin red S staining of cultured cells was used on the plate, plain PDMS, PDMS-Phys, PDMS-Chem, and PDMS-Phys-Chem substrates after 14 and 21 days, and its microscopic pictures are shown in Figure 10A. A gradual trend of increased alizarin red S staining intensity is observed for PDMS-Phys, PDMS-Chem, and PDMS-Phys-Chem, respectively. The increase in alizarin red S staining intensity is an indication of higher efficacy of substrates for osteogenic differentiation which in this case belong to the PDMS-Phys-Chem substrate. The quantification of alizarin red S staining was measured and is shown in Figure 10B. Based on these results, topographical changes based on 3D nano cell-imprinting on the PDMS substrate lead to significantly higher osteogenic differentiation 14 days after cells were cultured (p < 0.001). The chemical modification of substrates by nanocoating bone proteins (PDMS-Chem) appears to be more effective than the cell-imprinting effect in improving osteoblast differentiation. Finally, the combined cell-imprinting and bone protein nanocoating lead to maximum calcium nodule formation and matrix mineralization and consequently the highest level of cell differentiation after 14 days. A slight increase in the number of calcified nodules was observed after 21 days for the plain PDMS substrate compared with plate. Over time, reaching 21 days after cell culture, the intensity of alizarin red S staining increases in all substrates. However, there is no significant difference between PDMS-Chem and PDMS-Phys-Chem anymore. In fact, these results are in line with our findings from ALP activity on the modified substrates. A previous study has shown that, after alizarin red S staining, the coloration of stem cells cultured on cell-imprinted PDMS was more than those on flat PDMS, and the color of stem cells cultured on the flat PDMS was more than those on culture plate.36
Figure 10.

(A) Microscopic images of alizarin red S staining on different substrates after 14 and 21 days of cell seeding. (B) Quantitative analysis of alizarin red S staining of ADSCs grown on different PDMS substrates compared to the plate group after 14 and 21 days. The optical density measured at 405 nm, and the results are presented as mean ± standard error of three independent experiments. *p-values <0.05, **p-values <0.01, and ***p-values <0.001 between two groups. p value ≥0.05, and (ns) indicates a statistically non-significant result.
The osteogenic bone markers synthesized during osteogenic maturation of ADSCs cultured on different substrates were evaluated by the IF staining of OCN after 21 days and is shown in Figure 11. The nuclei were blue-stained with Hoechst embedded within the green-stained OCN proteins by FITC fluorescence. The production of OCN due to osteogenic maturation by the cells cultured was higher for the PDMS-Phys-Chem substrate compared to other groups, which revealed the cooperation of physical and chemical modification on increasing OCN protein expression. The intensity of OCN staining on the PDMS-Phys and PDMS-Chem substrates showed higher protein expression compared with the plate and plain PDMS groups, which demonstrate that both physical and chemical modification without cooperation has a significant effect on the expression of OCN. Higher OCN protein expression is related to the osteoblast topography on the PDMS-Phys substrate and is attributed to the presence of bone proteins (ABL) for the chemically modified PDMS substrate (PDMS-Chem). Moreover, in the plate and plain PDMS groups, the intensity of green fluorescence was less than that of all modified substrates. This trend has previously been observed for the alizarin red S staining results, the lowest number of nucleus between all substrates belongs to plain PDMS due to the low tendency of the cells to attach to the unmodified PDMS surface. This is understandable considering the hydrophobic surface of plain PDMS. On the other hand, the intensity of the blue color, which represented the number of adherent cells on the plate substrate, was higher than that of all PDMS substrates. However, green-stained OCN, which confirms the osteogenic differentiation of ADSCs, was not indicated. Overall, the results indicate that the combined nano 3D cell-imprinting and bone protein nanocoating (PDMS-Phys-Chem) not only offer further cell adhesion and proliferation but they also increase the OCN expression, representing improved osteogenic differentiation.
Figure 11.

IF staining of ADSCs cultured on plate, plain PDMS, PDMS-Phys, PDMS-Chem, PDMS-Phys-Chem substrates after 21 days. Hoechst staining for the cell nucleus and the FITC-conjugated antibody for OCN labeling was applied.
To quantitatively evaluate bone-specific gene expression by the ADSCs seeded on the plate, plain PDMS, PDMS-Phys, PDMS-Chem, and PDMS-Phys-Chem substrates, the real-time PCR was applied. Gene expression of osteoblast was measured as a positive control. The expression of RUNX2, Col1a1, and OCN genes after 21 days is illustrated in Figure 12. Gene expression of ADSCs cultured on the standard tissue culture plate was considered as a negative control, and all data were presented according to their results. Based on the results for all substrates, expression of Col1a1 showed a downregulation, while RUNX2 and OCN showed an upregulation in comparison to the negative control. This fold change trend was similar to the gene expression of osteoblast as a positive control. Improvement of osteogenic differentiation on the plain PDMS surface compared with the plate substrate was indicated in previous studies. This enhancement could be related to the mechanical properties of substrates. The Young’s modulus for the PDMS substrate (at a ratio of 10:1 curing agent) was measured to be 2.6 MPa,61 which is two orders of magnitude higher than the Young’s modulus of cross-linked collagens of osteoids (25–40 kPa) in natural bone ECM,12 but it offers closer stiffness because the elastic modulus of the tissue culture plate reaches 3 GPa, five orders of magnitude higher stiffness.62 As previously proven, the cells sense the substrate’s elastic or viscoelastic properties.12,63 The results of Shi et al. confirmed that tunable stiffness of the bio-printed hydrogel affects cell migration, proliferation, and development of the cell morphology.64 In the present study, ADSCs on plain PDMS express 8-fold greater OCN and near 4-fold greater RUNX2 in comparison with the plate substrate. The higher number of fold changes for PDMS-Phys is attributed to the nanotopographic cell pattern on the PDMS substrate which sends signals to guide the stem cells’ osteogenic differentiation. The signaling takes place because stem cells get trapped in an osteoblast shape and dimensional template. Similar findings were reported that in the absence of chemical and mechanical signals, topographical patterns on the cell culture substrate could direct stem cell differentiation.33,36 Moreover, as we expected for the PDMS-Chem substrate, based on the ALP assay, alizarin red S staining, and IF staining results, the real-time PCR results showed a similar trend in bone-specific gene expression with a positive control group. This improvement is related to the nanocoating layer of bone proteins on the PDMS surface which chemically mimics the bone niche; therefore, the chemical signals due to the bioactivation of the PDMS surface are sensed by ADSCs and guide its fate toward osteogenic differentiation. In the case of PDMS-Phys-Chem, the fold change of RUNX2 gene was calculated similarly to the positive control, and no significant differences were observed while the Col1a1 gene expression was lower than osteoblast. Furthermore, the OCN gene expression as a late osteogenic marker and one of the major players for the maturation of mineral species modulating osteogenic differentiation was increased in all groups. This increase for PDMS-Phys-Chem was significantly more than all those of other substrates (p < 0.001). The fold change of OCN gene expression for PDMS-Phys-Chem was calculated 22-fold compared with undifferentiated ADSCs, likewise, it was calculated 79-fold for osteoblast. In addition, the expression of OCN for PDMS-Chem and PDMS-Phys was calculated 12-fold and 13-fold, respectively, compared with the negative control. In a previous study, the expression of OCN for cell-imprinted PDMS in comparison with flat PDMS after 28 days increased from 0.7 to 1 (relative fold change).36 While in this study, the expression of OCN for PDMS-Phys in comparison with plain PDMS after 21 days increased from 8.4 to 13.4 (fold change). Hence, it can be concluded that simultaneous applying of the nanocoating of bone proteins on the topographical cell pattern caused a synergistic effect on bone-specific gene expression.
Figure 12.

Gene expression of (A) RUNX2, (B) Col1a1, and (C) OCN in ADSCs cultured on the plate (as a negative control), plain, PDMS-Phys, PDMS-Chem, and PDMS-Phys-Chem substrates after 21 days. (*P < 0.05, **P < 0.01, ***P < 0.001, p value ≥0.05, and (ns) indicates a statistically non-significant result, n = 3).
Increases in bone-specific gene expression on the substrates coated by ABL could be related to the presence of bone-specific proteins and growth factors such as TGF-β1 in ABL solution. In support of this speculation, several research studies have previously shown that ABL activates the TGF-β target genes: interleukin 11, proteoglycan 4, and NADPH oxidase 4.47,65,66 This is particularly important because these genes play an important role in bone regeneration.47,65,66 However, the amount and activity of BMPs in ABL have not yet been determined, and HCl used in ABL extraction could potentially deactivate pH-sensitive growth factors.67 In addition, the activated signaling pathway due to TGF-β1 has an important effect on the activation of a large number of target genes such as Col1a1, and they are effective on the proliferation and osteogenic differentiation of MSCs.68 Therefore, it is expected to observe a rise of bone-specific gene expression for substrates coated with ABL due to the presence of a wide range of proteins including growth factors, especially active TGF-β1. On the other hand, TGF-β activity and consequently cell response after ABL adsorption to the surface were proven by a bioassay in another study published by Strauss et al. In their study, the effect of TGF-β activity was indicated on the expression of target genes that are involved in bone regeneration and genes that are responsible for regenerating the ECM.41 Therefore, it can be concluded that the ABL coating on the PDMS surface could lead to elevated chemical signaling and mimic the osteoconductive ECM of osteoblasts due to its agents increasing the expression of the bone-specific genes. Finally, our findings approved that the ABL nanocoating with an appropriate thickness on top of osteoblast-imprinted PDMS enhances the osteogenic differentiation of ADSCs.
In this study, for the first time, the micro/nano cell-imprinted surface was coated with a nano layer of ABL. Thus, a special platform taking into account the topographical and biochemical characteristics was made. Improving the cell differentiation results after the bioactivation of the surface confirms the efficiency of the applied method on the cell fate. In none of the previous studies on the cell-imprinting method, the simultaneous effect of the molecular and cellular patterns has been investigated.33−36 Despite their exciting results on the stem cell differentiation, the introduced method in this study significantly improved the efficiency of the cell-imprinting technique.
4. Conclusions
In this work, we have utilized an approach comprising both physical and chemical modifications of the PDMS substrate mimicking the physiological niche of natural cells to guide adipose-derived stem cells’ fate. We have investigated the effect of topography by creating a nano 3D cell-imprinting on PDMS substrates. Additionally, we have successfully extracted ABL from rat’s long bone and have utilized it for chemical treatment of PDMS substrates. Overall, we have introduced a new cell culture substrate based on 3D cell-imprinting and protein nanocoating in order to mimic the cell topography and ECM. Bioactivation of the PDMS surface consisting of cell topography templates not only improved cell adhesion but also led to specific differentiation pathways. Finally, the results show the synergistic effect of physical and chemical surface modification on the osteogenic differentiation of ADSCs. The proposed method can be applied to construct characteristic biomimetic substrates in order to differentiate stem cells from other mature cells as well.
Acknowledgments
We would like to thank our colleagues and collaborators with whom we have performed some of the research described here, including Morteza Mehrjoo, Saeid Samani, and Fatemeh Ale-Ebrahim. The authors are grateful to the Pasteur Institute of Iran for the facilities to carry out this study.
Glossary
Abbreviations
- GA
glutaraldehyde
- ABL
acid bone lysate
- ADSCs
adipose derived stem cells
- PDMS-Phys
physically modified PDMS by cell topography pattern
- PDMS-Phys-Chem
chemically modified PDMS consist of cell topography pattern
Supporting Information Available
The Supporting Information is available free of charge at https://pubs.acs.org/doi/10.1021/acsomega.2c02206.
Optical image of osteoblast-imprinted PDMS substrates; images of harvested long bones and uncropped image of the SDS-PAGE gel; and FESEM micrograph of the non-coated surface as the control (PDF)
Author Contributions
M.B. contributed in conceptualization, methodology, data curation, investigation, visualization, and writing-original draft, B.N. contributed in supervision and investigation, E.S. contributed in drawing charts and writing-review, M.A.S. contributed in resources and investigation, S.B. contributed in supervision, funding acquisition, resources, and methodology
The authors declare no competing financial interest.
Notes
Ethical Standard: In vitro and in vivo experiments were registered at Pasteur Institute of Iran and confirmed by its ethics committee. This project was supported by grant no. 1582 in Pasteur Institute of Iran.
Supplementary Material
References
- He N.; Xu Y.; Du W.; Qi X.; Liang L.; Wang Y.; Feng G.; Fan Y.; Han Z.; Kong D.; Cheng Z.; Wu J. C.; He Z.; Li Z. Extracellular matrix can recover the downregulation of adhesion molecules after cell detachment and enhance endothelial cell engraftment. Sci. Rep. 2015, 5, 10902. 10.1038/srep10902. [DOI] [PMC free article] [PubMed] [Google Scholar]
- Higuchi A.; Ling Q.-D.; Hsu S.-T.; Umezawa A. Biomimetic cell culture proteins as extracellular matrices for stem cell differentiation. Chem. Rev. 2012, 112, 4507–4540. 10.1021/cr3000169. [DOI] [PubMed] [Google Scholar]
- Murphy W. L.; McDevitt T. C.; Engler A. J. Materials as stem cell regulators. Nat. Meter 2014, 13, 547. 10.1038/nmat3937. [DOI] [PMC free article] [PubMed] [Google Scholar]
- Place E. S.; Evans N. D.; Stevens M. M. Complexity in biomaterials for tissue engineering. Nat. Meter 2009, 8, 457–470. 10.1038/nmat2441. [DOI] [PubMed] [Google Scholar]
- Löfberg J.; Ebendal T. Substrate topography and shape of motile cells. Cell. Mol. Life Sci. 1980, 36, 508–510. 10.1007/BF01965767. [DOI] [PubMed] [Google Scholar]
- Taddei M.; Giannoni E.; Fiaschi T.; Chiarugi P. Anoikis: an emerging hallmark in health and diseases. J. Pathol. 2012, 226, 380–393. 10.1002/path.3000. [DOI] [PubMed] [Google Scholar]
- Kim H. N.; Jiao A.; Hwang N. S.; Kim M. S.; Kang D. H.; Kim D.-H.; Suh K.-Y. Nanotopography-guided tissue engineering and regenerative medicine. Adv. Drug Delivery Rev. 2013, 65, 536–558. 10.1016/j.addr.2012.07.014. [DOI] [PMC free article] [PubMed] [Google Scholar]
- Zhang J.; Klos M.; Wilson G. F.; Herman A. M.; Lian X.; Raval K. K.; Barron M. R.; Hou L.; Soerens A. G.; Yu J.; Palecek S. P.; Lyons G. E.; Thomson J. A.; Herron T. J.; Jalife J.; Kamp T. J. Extracellular matrix promotes highly efficient cardiac differentiation of human pluripotent stem cells: the matrix sandwich method. Circ. Res. 2012, 111, 1125–1136. 10.1161/circresaha.112.273144. [DOI] [PMC free article] [PubMed] [Google Scholar]
- Khetan S.; Guvendiren M.; Legant W. R.; Cohen D. M.; Chen C. S.; Burdick J. A. Degradation-mediated cellular traction directs stem cell fate in covalently crosslinked three-dimensional hydrogels. Nat. Meter 2013, 12, 458. 10.1038/nmat3586. [DOI] [PMC free article] [PubMed] [Google Scholar]
- Yao X.; Liu Y.; Gao J.; Yang L.; Mao D.; Stefanitsch C.; Li Y.; Zhang J.; Ou L.; Kong D.; Zhao Q.; Li Z. Nitric oxide releasing hydrogel enhances the therapeutic efficacy of mesenchymal stem cells for myocardial infarction. Biomaterials 2015, 60, 130–140. 10.1016/j.biomaterials.2015.04.046. [DOI] [PubMed] [Google Scholar]
- Jeon H.; Simon C. G. Jr.; Kim G. A mini-review: cell response to microscale, nanoscale, and hierarchical patterning of surface structure. J. Biomed. Mater. Res., Part B 2014, 102, 1580–1594. 10.1002/jbm.b.33158. [DOI] [PubMed] [Google Scholar]
- Engler A. J.; Sen S.; Sweeney H. L.; Discher D. E. Matrix elasticity directs stem cell lineage specification. Cell 2006, 126, 677–689. 10.1016/j.cell.2006.06.044. [DOI] [PubMed] [Google Scholar]
- Dalby M. J.; Gadegaard N.; Tare R.; Andar A.; Riehle M. O.; Herzyk P.; Wilkinson C. D. W.; Oreffo R. O. C. The control of human mesenchymal cell differentiation using nanoscale symmetry and disorder. Nat. Meter 2007, 6, 997. 10.1038/nmat2013. [DOI] [PubMed] [Google Scholar]
- Tay C. Y.; Koh C. G.; Tan N. S.; Leong D. T.; Tan L. P. Mechanoregulation of stem cell fate via micro-/nano-scale manipulation for regenerative medicine. Nanomedicine 2013, 8, 623–638. 10.2217/nnm.13.31. [DOI] [PubMed] [Google Scholar]
- Turner L.-A.; Dalby M. J. Nanotopography–potential relevance in the stem cell niche. Biomater. Sci. 2014, 2, 1574–1594. 10.1039/c4bm00155a. [DOI] [PubMed] [Google Scholar]
- Lord M. S.; Foss M.; Besenbacher F. Influence of nanoscale surface topography on protein adsorption and cellular response. Nano Today 2010, 5, 66–78. 10.1016/j.nantod.2010.01.001. [DOI] [Google Scholar]
- Tsimbouri P. M.; McMurray R. J.; Burgess K. V.; Alakpa E. V.; Reynolds P. M.; Murawski K.; Kingham E.; Oreffo R. O. C.; Gadegaard N.; Dalby M. J. Using nanotopography and metabolomics to identify biochemical effectors of multipotency. ACS Nano 2012, 6, 10239–10249. 10.1021/nn304046m. [DOI] [PubMed] [Google Scholar]
- Yim E. K. F.; Darling E. M.; Kulangara K.; Guilak F.; Leong K. W. Nanotopography-induced changes in focal adhesions, cytoskeletal organization, and mechanical properties of human mesenchymal stem cells. Biomaterials 2010, 31, 1299–1306. 10.1016/j.biomaterials.2009.10.037. [DOI] [PMC free article] [PubMed] [Google Scholar]
- Schernthaner M.; Reisinger B.; Wolinski H.; Kohlwein S. D.; Trantina-Yates A.; Fahrner M.; Romanin C.; Itani H.; Stifter D.; Leitinger G.; Groschner K.; Heitz J. Nanopatterned polymer substrates promote endothelial proliferation by initiation of β-catenin transcriptional signaling. Acta Biomater. 2012, 8, 2953–2962. 10.1016/j.actbio.2012.04.018. [DOI] [PubMed] [Google Scholar]
- Li S.; Kuddannaya S.; Chuah Y. J.; Bao J.; Zhang Y.; Wang D. Combined effects of multi-scale topographical cues on stable cell sheet formation and differentiation of mesenchymal stem cells. Biomater. Sci. 2017, 5, 2056–2067. 10.1039/c7bm00134g. [DOI] [PubMed] [Google Scholar]
- Yang J.; McNamara L. E.; Gadegaard N.; Alakpa E. V.; Burgess K. V.; Meek R. M. D.; Dalby M. J. Nanotopographical induction of osteogenesis through adhesion, bone morphogenic protein cosignaling, and regulation of microRNAs. ACS Nano 2014, 8, 9941–9953. 10.1021/nn504767g. [DOI] [PubMed] [Google Scholar]
- Wang J. R.; Ahmed S. F.; Gadegaard N.; Meek R. M. D.; Dalby M. J.; Yarwood S. J. Nanotopology potentiates growth hormone signalling and osteogenesis of mesenchymal stem cells. Growth Horm. IGF Res. 2014, 24, 245–250. 10.1016/j.ghir.2014.10.003. [DOI] [PubMed] [Google Scholar]
- Lee M. R.; Kwon K. W.; Jung H.; Kim H. N.; Suh K. Y.; Kim K.; Kim K.-S. Direct differentiation of human embryonic stem cells into selective neurons on nanoscale ridge/groove pattern arrays. Biomaterials 2010, 31, 4360–4366. 10.1016/j.biomaterials.2010.02.012. [DOI] [PubMed] [Google Scholar]
- Béduer A.; Vieu C.; Arnauduc F.; Sol J.-C.; Loubinoux I.; Vaysse L. Engineering of adult human neural stem cells differentiation through surface micropatterning. Biomaterials 2012, 33, 504–514. 10.1016/j.biomaterials.2011.09.073. [DOI] [PubMed] [Google Scholar]
- Rajnicek A.; Britland S.; McCaig C. Contact guidance of CNS neurites on grooved quartz: influence of groove dimensions, neuronal age and cell type. J. Cell Sci. 1997, 110, 2905–2913. 10.1242/jcs.110.23.2905. [DOI] [PubMed] [Google Scholar]
- Clark P.; Connolly P.; Curtis A. S.; Dow J. A.; Wilkinson C. D. Cell guidance by ultrafine topography in vitro. J. Cell Sci. 1991, 99, 73–77. 10.1242/jcs.99.1.73. [DOI] [PubMed] [Google Scholar]
- Kawano T.; Sato M.; Yabu H.; Shimomura M. Honeycomb-shaped surface topography induces differentiation of human mesenchymal stem cells (hMSCs): uniform porous polymer scaffolds prepared by the breath figure technique. Biomater. Sci. 2014, 2, 52–56. 10.1039/c3bm60195a. [DOI] [PubMed] [Google Scholar]
- Wilkinson C. D. W.; Riehle M.; Wood M.; Gallagher J.; Curtis A. The use of materials patterned on a nano-and micro-metric scale in cellular engineering. Mater. Sci. Eng., C 2002, 19, 263–269. 10.1016/s0928-4931(01)00396-4. [DOI] [Google Scholar]
- Charest J. L.; García A. J.; King W. P. Myoblast alignment and differentiation on cell culture substrates with microscale topography and model chemistries. Biomaterials 2007, 28, 2202–2210. 10.1016/j.biomaterials.2007.01.020. [DOI] [PubMed] [Google Scholar]
- Andersson A.-S.; Bäckhed F.; von Euler A.; Richter-Dahlfors A.; Sutherland D.; Kasemo B. Nanoscale features influence epithelial cell morphology and cytokine production. Biomaterials 2003, 24, 3427–3436. 10.1016/s0142-9612(03)00208-4. [DOI] [PubMed] [Google Scholar]
- Hu W.; Yim E. K. F.; Reano R. M.; Leong K. W.; Pang S. W. Effects of nanoimprinted patterns in tissue-culture polystyrene on cell behavior. J. Vac. Sci. Technol., B: Microelectron. Nanometer Struct.--Process., Meas., Phenom. 2005, 23, 2984–2989. 10.1116/1.2121729. [DOI] [PMC free article] [PubMed] [Google Scholar]
- Yim E.; Reano R.; Pang S.; Yee A.; Chen C.; Leong K. Nanopattern-induced changes in morphology and motility of smooth muscle cells. Biomaterials 2005, 26, 5405–5413. 10.1016/j.biomaterials.2005.01.058. [DOI] [PMC free article] [PubMed] [Google Scholar]
- Mahmoudi M.; Bonakdar S.; Shokrgozar M. A.; Aghaverdi H.; Hartmann R.; Pick A.; Witte G.; Parak W. J. Cell-imprinted substrates direct the fate of stem cells. ACS Nano 2013, 7, 8379–8384. 10.1021/nn403844q. [DOI] [PubMed] [Google Scholar]
- Mashinchian O.; Bonakdar S.; Taghinejad H.; Satarifard V.; Heidari M.; Majidi M.; Sharifi S.; Peirovi A.; Saffar S.; Taghinejad M.; Abdolahad M.; Mohajerzadeh S.; Shokrgozar M. A.; Rezayat S. M.; Ejtehadi M. R.; Dalby M. J.; Mahmoudi M. Cell-imprinted substrates act as an artificial niche for skin regeneration. ACS Appl. Mater. Interfaces 2014, 6, 13280–13292. 10.1021/am503045b. [DOI] [PubMed] [Google Scholar]
- Bonakdar S.; Mahmoudi M.; Montazeri L.; Taghipoor M.; Bertsch A.; Shokrgozar M. A.; Sharifi S.; Majidi M.; Mashinchian O.; Hamrang Sekachaei M.; Zolfaghari P.; Renaud P. Cell-imprinted substrates modulate differentiation, redifferentiation, and transdifferentiation. ACS Appl. Mater. Interfaces 2016, 8, 13777–13784. 10.1021/acsami.6b03302. [DOI] [PubMed] [Google Scholar]
- Kamguyan K.; Katbab A. A.; Mahmoudi M.; Thormann E.; Zajforoushan Moghaddam S.; Moradi L.; Bonakdar S. An engineered cell-imprinted substrate directs osteogenic differentiation in stem cells. Biomater. Sci. 2018, 6, 189–199. 10.1039/c7bm00733g. [DOI] [PubMed] [Google Scholar]
- Lee E. A.; Im S.-G.; Hwang N. S. Efficient myogenic commitment of human mesenchymal stem cells on biomimetic materials replicating myoblast topography. Biotechnol. J. 2014, 9, 1604–1612. 10.1002/biot.201400020. [DOI] [PubMed] [Google Scholar]
- Reddi A. H. Role of morphogenetic proteins in skeletal tissue engineering and regeneration. Nat. Biotechnol. 1998, 16, 247–252. 10.1038/nbt0398-247. [DOI] [PubMed] [Google Scholar]
- Urist M. R. Bone: formation by autoinduction. Science 1965, 150, 893–899. 10.1126/science.150.3698.893. [DOI] [PubMed] [Google Scholar]
- Gruskin E.; Doll B. A.; Futrell F. W.; Schmitz J. P.; Hollinger J. O. Demineralized bone matrix in bone repair: history and use. Adv. Drug Delivery Rev. 2012, 64, 1063–1077. 10.1016/j.addr.2012.06.008. [DOI] [PMC free article] [PubMed] [Google Scholar]
- Strauss F. J.; Di Summa F.; Stähli A.; Matos L.; Vaca F.; Schuldt G.; Gruber R. TGF-β activity in acid bone lysate adsorbs to titanium surface. Clin. Implant. Dent. Relat. Res. 2019, 21, 336–343. 10.1111/cid.12734. [DOI] [PMC free article] [PubMed] [Google Scholar]
- Tang Y.; Wu X.; Lei W.; Pang L.; Wan C.; Shi Z.; Zhao L.; Nagy T. R.; Peng X.; Hu J.; Feng X.; Van Hul W.; Wan M.; Cao X. TGF-β1–induced migration of bone mesenchymal stem cells couples bone resorption with formation. Nat. Med. 2009, 15, 757. 10.1038/nm.1979. [DOI] [PMC free article] [PubMed] [Google Scholar]
- Crane J. L.; Cao X. Bone marrow mesenchymal stem cells and TGF-β signaling in bone remodeling. J. Clin. Invest. 2014, 124, 466–472. 10.1172/jci70050. [DOI] [PMC free article] [PubMed] [Google Scholar]
- Weivoda M. M.; Ruan M.; Pederson L.; Hachfeld C.; Davey R. A.; Zajac J. D.; Westendorf J. J.; Khosla S.; Oursler M. J. Osteoclast TGF-β receptor signaling induces Wnt1 secretion and couples bone resorption to bone formation. J. Bone Miner. Res. 2016, 31, 76–85. 10.1002/jbmr.2586. [DOI] [PMC free article] [PubMed] [Google Scholar]
- Taylor S. E. B.; Shah M.; Orriss I. R. Generation of rodent and human osteoblasts. BoneKEy Rep. 2014, 3, 585. 10.1038/bonekey.2014.80. [DOI] [PMC free article] [PubMed] [Google Scholar]
- Sun J.; Liu W. H.; Deng F. M.; Luo Y. H.; Wen K.; Zhang H.; Liu H. R.; Wu J.; Su B. Y.; Liu Y. L. Differentiation of rat adipose-derived mesenchymal stem cells into corneal-like epithelial cells driven by PAX6. Exp. Ther. Med. 2018, 15, 1424–1432. 10.3892/etm.2017.5576. [DOI] [PMC free article] [PubMed] [Google Scholar]
- Strauss F. J.; Stähli A.; Beer L.; Mitulović G.; Gilmozzi V.; Haspel N.; Schwab G.; Gruber R. Acid bone lysate activates TGFβ signalling in human oral fibroblasts. Sci. Rep. 2018, 8, 16065. 10.1038/s41598-018-34418-3. [DOI] [PMC free article] [PubMed] [Google Scholar]
- Bradford M. M. A rapid and sensitive method for the quantitation of microgram quantities of protein utilizing the principle of protein-dye binding. Anal. Biochem. 1976, 72, 248–254. 10.1006/abio.1976.9999. [DOI] [PubMed] [Google Scholar]
- Kuddannaya S.; Chuah Y. J.; Lee M. H. A.; Menon N. V.; Kang Y.; Zhang Y. Surface chemical modification of poly (dimethylsiloxane) for the enhanced adhesion and proliferation of mesenchymal stem cells. ACS Appl. Mater. Interfaces 2013, 5, 9777–9784. 10.1021/am402903e. [DOI] [PubMed] [Google Scholar]
- Pezzotti G.; Marin E.; Adachi T.; Rondinella A.; Boschetto F.; Zhu W.; Sugano N.; Bock R. M.; McEntire B.; Bal S. B. Bioactive silicon nitride: A new therapeutic material for osteoarthropathy. Sci. Rep. 2017, 7, 44848. 10.1038/srep44848. [DOI] [PMC free article] [PubMed] [Google Scholar]
- Seiti M.; Ginestra P. S.; Ferraro R. M.; Giliani S.; Vetrano R. M.; Ceretti E.; Ferraris E. Aerosol Jet® Printing of Poly (3, 4-Ethylenedioxythiophene): Poly (Styrenesulfonate) onto Micropatterned Substrates for Neural Cells In Vitro Stimulation. Int. J. Bioprint. 2022, 8, 504. 10.18063/ijb.v8i1.504. [DOI] [PMC free article] [PubMed] [Google Scholar]
- Vansant E. F.; Van Der Voort P.; Vrancken K. C., Characterization and Chemical Modification of the Silica Surface; Elsevier, 1995. [Google Scholar]
- Michau M.; Barboiu M. Self-organized proton conductive layers in hybrid proton exchange membranes, exhibiting high ionic conductivity. J. Mater. Chem. 2009, 19, 6124–6131. 10.1039/b908680c. [DOI] [Google Scholar]
- Qian Z.; Ross D.; Jia W.; Xing Q.; Zhao F. Bioactive polydimethylsiloxane surface for optimal human mesenchymal stem cell sheet culture. Bioact. Mater. 2018, 3, 167–173. 10.1016/j.bioactmat.2018.01.005. [DOI] [PMC free article] [PubMed] [Google Scholar]
- de Campos Vidal B.; Mello M. L. S. Collagen type I amide I band infrared spectroscopy. Micron 2011, 42, 283–289. 10.1016/j.micron.2010.09.010. [DOI] [PubMed] [Google Scholar]
- Leivo J.; Virjula S.; Vanhatupa S.; Kartasalo K.; Kreutzer J.; Miettinen S.; Kallio P. A durable and biocompatible ascorbic acid-based covalent coating method of polydimethylsiloxane for dynamic cell culture. J. R. Soc., Interface 2017, 14, 20170318. 10.1098/rsif.2017.0318. [DOI] [PMC free article] [PubMed] [Google Scholar]
- Sharma D.; Jia W.; Long F.; Pati S.; Chen Q.; Qyang Y.; Lee B.; Choi C. K.; Zhao F. Polydopamine and collagen coated micro-grated polydimethylsiloxane for human mesenchymal stem cell culture. Bioact. Mater. 2019, 4, 142–150. 10.1016/j.bioactmat.2019.02.002. [DOI] [PMC free article] [PubMed] [Google Scholar]
- Akther F.; Yakob S. B.; Nguyen N.-T.; Ta H. T. Surface Modification Techniques for Endothelial Cell Seeding in PDMS Microfluidic Devices. Biosensors 2020, 10, 182. 10.3390/bios10110182. [DOI] [PMC free article] [PubMed] [Google Scholar]
- Huang W.; Yang S.; Shao J.; Li Y.-P. Signaling and transcriptional regulation in osteoblast commitment and differentiation. Front. Biosci. 2007, 12, 3068. 10.2741/2296. [DOI] [PMC free article] [PubMed] [Google Scholar]
- Puchtler H.; Meloan S. N.; Terry M. S. On the history and mechanism of alizarin and alizarin red S stains for calcium. J. Histochem. Cytochem. 1969, 17, 110–124. 10.1177/17.2.110. [DOI] [PubMed] [Google Scholar]
- Wang Z.; Volinsky A. A.; Gallant N. D., Crosslinking effect on polydimethylsiloxane elastic modulus measured by custom-built compression instrument. J. Appl. Polym. Sci. 2014, 131, 41050, 10.1002/app.41050 [DOI] [Google Scholar]
- Gilbert P. M.; Havenstrite K. L.; Magnusson K. E. G.; Sacco A.; Leonardi N. A.; Kraft P.; Nguyen N. K.; Thrun S.; Lutolf M. P.; Blau H. M. Substrate elasticity regulates skeletal muscle stem cell self-renewal in culture. Science 2010, 329, 1078–1081. 10.1126/science.1191035. [DOI] [PMC free article] [PubMed] [Google Scholar]
- Chaudhuri O.; Gu L.; Klumpers D.; Darnell M.; Bencherif S. A.; Weaver J. C.; Huebsch N.; Lee H.-p.; Lippens E.; Duda G. N.; Mooney D. J. Hydrogels with tunable stress relaxation regulate stem cell fate and activity. Nat. Meter 2016, 15, 326–334. 10.1038/nmat4489. [DOI] [PMC free article] [PubMed] [Google Scholar]
- Shi P.; Laude A.; Yeong W. Y. Investigation of cell viability and morphology in 3D bio-printed alginate constructs with tunable stiffness. J. Biomed. Mater. Res., Part A 2017, 105, 1009–1018. 10.1002/jbm.a.35971. [DOI] [PubMed] [Google Scholar]
- Pranskunas M.; Galindo-Moreno P.; Padial-Molina M. Extraction socket preservation using growth factors and stem cells: A systematic review. J. Oral Maxillofac. Surg. 2019, 10, e7 10.5037/jomr.2019.10307. [DOI] [PMC free article] [PubMed] [Google Scholar]
- Suga K.; Saitoh M.; Kokubo S.; Nozaki K.; Fukushima S.; Yasuda S.; Sasamata M.; Miyata K. Synergism between interleukin-11 and bone morphogenetic protein-2 in the healing of segmental bone defects in a rabbit model. J. Interferon Cytokine Res. 2004, 24, 343–349. 10.1089/107999004323142204. [DOI] [PubMed] [Google Scholar]
- Rehfeldt F.; Engler A.; Eckhardt A.; Ahmed F.; Discher D. Cell responses to the mechanochemical microenvironment—implications for regenerative medicine and drug delivery. Adv. Drug Delivery Rev. 2007, 59, 1329–1339. 10.1016/j.addr.2007.08.007. [DOI] [PMC free article] [PubMed] [Google Scholar]
- Li X. L.; Liu Y. B.; Ma E. G.; Shen W. X.; Li H.; Zhang Y. N. Synergistic effect of BMP9 and TGF-β in the proliferation and differentiation of osteoblasts. Genet. Mol. Res. 2015, 14, 7605–7615. 10.4238/2015.july.13.4. [DOI] [PubMed] [Google Scholar]
Associated Data
This section collects any data citations, data availability statements, or supplementary materials included in this article.