

Abstract

It is an effective way to introduce syngas fuel into gasoline engine for blending combustion to improve combustion and reduce emissions. In this paper, the combustion and emission characteristics of the direct injection engine under the condition of mixed combustion of syngas were analyzed by a numerical simulation method. The engine ran at 2000 rpm, and the mass fraction of syngas was from 0 to 20%. The results showed that with the increase in the mass ratio of syngas in the dual fuel, the average pressure and temperature in the cylinder increased first and then decreased. The maximum in-cylinder pressure and in-cylinder temperature increased by 27.5 and 2.97%, respectively. The instantaneous heat release rate also showed a law of first increasing and then decreasing, in which the peak value of the instantaneous heat release rate increased by 32.1% at the highest. In addition, with the increase in the ratio of syngas, the emission of nitrogen oxides in the cylinder gradually decreased, with a maximum reduction of 27.4%. The unburned hydrocarbons first decreased and then increased, with a maximum reduction of 7.6%. Meanwhile, the emission of carbon dioxide was negatively correlated with the ratio of syngas in the dual fuel. With the increase in hydrogen ratio in syngas, the carbon monoxide was gradually reduced, with a maximum reduction of 65%. The carbon dioxide increased first and then decreased, with a maximum addition of 4.8%. The ratio of hydrogen and carbon monoxide in syngas had little effect on the emission of unburned hydrocarbons.
1. Introduction
In order to cope with the shortage of oil resources and the increasingly stringent emission regulations, improving thermal efficiency and reducing harmful emissions of gasoline engine have been highlighted by researchers.1−3 Based on the mature in-cylinder direct injection technology and intake turbocharging technology, lean combustion under a high compression ratio can be realized to effectively improve the thermal efficiency of gasoline engine. In order to achieve stable lean combustion, from the perspective of fuel composition of gasoline engine, adding hydrogen-rich syngas to gasoline engine for blending combustion is considered in this paper.4 On the one hand, the introduction of hydrogen-rich syngas is conducive to the efficient combustion in the cylinder of gasoline engine. On the other hand, it can partially replace gasoline fuel to reduce the gasoline consumption of gasoline engine. Syngas is a kind of basic raw material gas that is mainly used to synthesize chemicals in the industry. Its main components are hydrogen and carbon monoxide.5 The sources of raw materials for the preparation of syngas fuel are extensive. At present, there are major production methods in industry, such as the preparation of syngas through short-chain light hydrocarbons, solid gasification, or partial oxidation of macromolecular heavy oil.6 According to the fossil energy reserves in China, coal resources account for 53%, oil and natural gas resources account for only 35%, and hydropower, nuclear energy, and others account for 12%.7 More coal and less oil are the main characteristics of China’s energy structure. Therefore, the preparation of syngas by coal gasification with solid fuel such as coal or coke is more in line with China’s national condition. Transportation with cars as the main carrier consumes 35% of the total oil.8,9 Using relatively sufficient coal energy reasonably to replace part of the scarce oil energy can effectively alleviate the dependence of the automobile industry on oil energy.10−12 Therefore, the introduction of syngas into gasoline engine for blended combustion can partially replace gasoline fuels with syngas, which is of great significance to alleviate China’s dependence on oil energy.13,14 In addition, the main composition of syngas is small molecular inorganics, which is quite different from gasoline, diesel, and other petroleum fuels containing many macromolecular hydrocarbon compounds. Gasoline engine blended combustion syngas will inevitably affect the combustion process and emission process,15,16 which has high value for the research of the blended combustion mode.
At present, some achievements have been made in the study of blended combustion of syngas about gasoline engine. Kozlov et al.17 conducted a numerical study on the energy and emission characteristics of HCCI engine operating on isooctane mixed fuel with syngas as an additive, and the fuel-air equivalence ratios were 0.4 and 0.2, respectively. The combustion characteristics of the maximum mass average temperature in the combustion process of different fuels under the same crankshaft angle were analyzed. The results show that the addition of syngas delays ignition and shortens combustion duration. Park et al.18 compared the stoichiometric and lean combustion modes in a single cylinder spark ignition engine. The optimal compression ratio for stoichiometric combustion was selected as 15:1. However, the low combustion temperature under lean combustion allowed the engine to operate at the compression ratio of 17.1:1. The gross indicated thermal efficiency under lean combustion was 18.4% higher than that under stoichiometric combustion. Energy balance analysis revealed that a significant reduction in heat transfer loss was the main contribution to the high gross indicated thermal efficiency under lean combustion. However, the gross indicated power under lean combustion was 25.6% lower than that under stoichiometric combustion. Zhao et al.19 studied that under lean combustion conditions, the durations of initial flame development and rapid burning were shortened markedly by hydrogen. After hydrogen addition, the unburned hydrocarbon emission decreased markedly and carbon monoxide emission decreased slightly. The combination of hydrogen addition and air dilution exhibited a positive inhibition on particle matter emission, and the particle surface concentration was reduced significantly. Finally, an improved combustion progress was observed after hydrogen addition during air dilution, as well as a higher brake thermal efficiency and wider lean limitation with acceptable combustion stability. Martinez-Boggio et al.20 conducted extensive experimental research on the combustion process of syngas. Two different hydrogen/carbon monoxide ratios (50–50 and 75–25%) and 50% dilution (15% CO2 and 35% N2) were set as representative of real syngas mixtures in the experiment. The addition of hydrogen promoted combustion with a higher propagation speed, reduced flame distortion, and centered the combustion. Syngas showed the advantages of a stable combustion process and low emission for the usage in spark ignition engine under lean conditions. Oh et al.21 conducted experimental research on a single cylinder spark ignition engine with a hydrogen-rich gas mixture and determined the combustion characteristics and efficiency at different compression ratios. The highest compression ratio in the study was 17.0, yielding the highest indicated thermal efficiency, which was 51% under medium load conditions. High and low load operations exhibited a lower thermal efficiency. Result of efficiency loss analysis showed that high-temperature combustion was the major contribution to efficiency reduction under high load conditions, whereas the gas exchange process and elongated burn duration were the largest contribution under low load conditions. Hagos et al.22 investigated the effect of injection timing on the combustion, performance, and emission characteristics of syngas in direct injection spark ignition engine. Even though fast combustion of syngas suggested late injection for a better combustion, performance and emission, the lower calorific value resulted in operational limitation for the direct injection system particularly at a higher speed maintaining the air–fuel ratio close to stoichiometry. Fiore et al.23 studied the influence of piston shape and injector geometry on the combustion and emission characteristics of spark ignition engine fueled by syngas (50% by volume of hydrogen, 50% by volume of carbon monoxide) under low/medium load conditions. The result showed that the Omega Combustion Cup (OCC) piston shape was certainly the best choice in order to optimize the combustion process and performance, even if it may lead to a higher nitrogen oxide emission. Jamsran et al.24 studied the combustion and emission of a homogeneous charge compression ignition engine with various syngas compositions. It revealed that a higher hydrogen content in the fuel facilitated fast burning with good combustion stability, while a higher carbon monoxide fraction deteriorated the combustion stability under lean conditions. Caligiuri et al.25 proposed an experimental methodology aimed at the quantification of the impact of the usage of both natural gas and syngas in spark ignition engine on performance and emission. The results revealed that the impact of the different fuel mixtures on brake thermal efficiency were negligible if compared to the influence of spark advance variation on brake thermal efficiency.
In summary, the current research results on syngas under lean combustion gasoline engine are rich, but the focus of the research studies is mainly about the influence of hydrogen components in syngas on the combustion and emission performance of gasoline engine. However, there is a lack of research on expanding the lean combustion limitation, and there is no systematic research on the addition ratio of syngas. Based on previous research studies, this paper will explore the law of syngas to expand the lean combustion limitation and enhance the lean combustion stability of gasoline direct injection engines by setting a certain gradient proportion of blended fuels based on the advantages of hydrogen-rich syngas to accelerate combustion rates and improve combustion stability. In this paper, starting from the components of the mixed fuel in the cylinder of the engine, the syngas is selected to partially replace the gasoline fuel. This method changes the physical and chemical properties of the mixed fuel itself without significant changes to the original structure and working mode of the internal combustion engine, which has certain universality. Based on reasonable initial conditions, boundary conditions, research models, and appropriate mesh size, the three-dimensional numerical simulation software is used to simulate the combustion and emission characteristics of dual-fuel engine under the condition of gasoline engine mixed with combustion of syngas by numerical simulation of the working process in the cylinder of gasoline engine.
2. Methods
2.1. Geometric Model and Grid Setting of Gasoline Engine
Based on the model of a gasoline direct injection engine, the three-dimensional numerical simulation and analysis of the engine cylinder are carried out. The main geometric parameters of the gasoline engine are shown in Table 1. The converge software divides the geometric model of gasoline engine into different boundary surfaces, such as the upper surface of the piston, the inner wall of the cylinder, the intake inlet, the inner surface of the inlet, the exhaust outlet, and the inner surface of the exhaust channel. In the calculation process, converge software automatically generates high-quality orthogonal grids in the engine inlet, in-cylinder combustion chamber, exhaust duct, and other parts of the interior space wrapped by the boundary surface using its patented grid automatic cutting and partitioning technology.26 The basic size of the grid is selected according to the accuracy requirement of numerical simulation, and the adaptive grid encryption technology is used to encrypt the grid inside the cylinder on the basis of the basic grid. In addition, periodic grid refinement is also carried out in the key parts of the geometric structure of the gasoline engine, such as the inlet and exhaust valve angle and the space near the spark plug and the injector to ensure the accuracy of the calculation results.
Table 1. Geometric Parameters of the Engine.
| parameter | numerical value |
|---|---|
| number of cylinders | 4 |
| diameter (mm) | 76 |
| stroke (mm) | 82.6 |
| compression ratio | 9.5 |
| link length (mm) | 139.3 |
| displacement volume (L) | 1.49 |
| rotating speed (r/min) | 2000 |
2.2. Initial Conditions and Boundary Conditions of Gasoline Engine
Before starting the three-dimensional numerical simulation of the engine, in order to make the simulation result more consistent with the real test conditions, it is necessary to specify the initial conditions and boundary conditions of each part of the gasoline engine. In the three-dimensional numerical simulation, the whole engine space enclosed by each boundary surface is divided into three parts, namely, the intake port, the cylinder, and the exhaust port. The initial temperature and pressure conditions of these three calculation areas are set in Table 2.
Table 2. Initial Conditions of the Engine.
| parameter | numerical value |
|---|---|
| inlet initial temperature (K) | 310.24744 |
| inlet initial pressure (Pa) | 230088.62 |
| in-cylinder initial temperature (K) | 888.57446 |
| in-cylinder initial pressure (Pa) | 205533.55 |
| exhaust initial temperature (K) | 888.57446 |
| exhaust initial pressure (Pa) | 205533.55 |
Boundary conditions are also important for the three-dimensional numerical simulation of the engine cylinder. The boundary conditions used in this paper are mainly temperature boundary conditions. Part of the boundary conditions needed to be set is the wall boundary of each of the three calculation areas, such as the upper surface of the piston, the inner surface of the cylinder, the inlet and exhaust channel, the surface of the spark plug, etc. The corresponding wall temperature boundary conditions are set out in Table 3.
Table 3. Boundary Conditions of the Engine.
| parameter | numerical value |
|---|---|
| intake port wall temperature (K) | 350.0 |
| exhaust port wall temperature (K) | 550.0 |
| piston upper surface temperature (K) | 565.9 |
| in-cylinder wall temperature (K) | 519.2 |
| cylinder liner wall temperature (K) | 565.9 |
| spark plug surface temperature (K) | 1100.0 |
| inlet valve surface temperature (K) | 480.0 |
| exhaust valve surface temperature (K) | 1064.65 |
In addition to the above wall boundary conditions, the inlet and outlet boundary conditions also need to be set. The import and export boundary conditions include not only the temperature and pressure levels of the boundary but also the specific components and mass fractions of the entering and discharging system. In the numerical simulation analysis of this paper, the intake components are mainly nitrogen and oxygen in the air. The inlet temperature and pressure are the time-related functions measured in the experiment, where the inlet temperature fluctuates around 312 K and the inlet pressure fluctuates around 0.23 MPa. The exhaust components are nitrogen, oxygen, carbon dioxide, and water, and the exhaust temperature and pressure are also measured by experiments. The exhaust temperature fluctuates around 1000 K, and the exhaust pressure fluctuates around 0.25 MPa.
2.3. Selection and Validation of Research Models
Combustion in the engine cylinder is a very complex physical and chemical process, involving physical and chemical processes such as turbulence, diffusion, combustion, heat transfer, mass transfer, and substance generation. The principle of applying the numerical simulation method to calculate the actual physical and chemical processes is based on the conservation of mass, momentum and energy, and the corresponding continuity equation, momentum equation, and energy conservation equation are used to describe the basic laws of fluid motion.
The three-dimension model of gasoline engine is mainly built on the premise of the following assumptions:
-
a.
During the combustion process, the cylinder is divided into two areas, the burned area and the unburned area. The gas composition in the two areas is uniform and ideal gas.
-
b.
The two zones have different temperatures during the combustion process, but the in-cylinder pressure remains the same.
-
c.
The two regions are bounded by an imaginary extremely thin and highly corrugated flame propagation surface, regardless of heat transfer between the two regions.
Three-dimension numerical calculation needs to supplement the corresponding turbulence model, breakup model, collision model, combustion model, and emission model based on the basic control equation and gas state equation. As shown in Table 4, the RNG k-ε turbulence model is selected to solve the N-S equation27,28 considering the solution accuracy and computer performance. The KH-RT models29 are loaded at the same time in the droplet breakup part to fully simulate the initial and secondary breakup of fuel. The NTC collision model and the wall film model30 are selected for the collision model and the fuel wall model, respectively. The extended Zeldovich model and Hiroyasu model widely used in the current research are selected for the nitrogen oxide emission model and the soot model so as to more accurately simulate the flow, heat transfer, combustion, and emission processes in the engine cylinder.
Table 4. Research Models.
| model | setting |
|---|---|
| turbulence model | RNG k-ε model |
| breakup model | KH-RT breakup model |
| collision model | NTC collision model |
| fuel wall model | wall film model |
| combustion model | SAGE model |
| nitrogen oxide model | extended Zeldovich model |
| soot model | Hiroyasu model |
Among them, the SAGE combustion model in converge can simulate the ignition and combustion process of gasoline engine more accurately by coupling the chemical reaction kinetics model, including the thermodynamic information and transport characteristics of the elements and substances involved in the reaction and the relevant chemical parameters of the reaction of each element in the model.31 Considering the general performance of the current computer and the time cost of numerical research, this paper selects the TPRF simplified chemical kinetics model constructed by Liu et al.32 as the gasoline fuel mechanism. The simplified model can accurately predict the ignition delay time and laminar flame velocity of gasoline fuel. The simplified chemical kinetic model of the syngas–gasoline mixture containing 58 components and 171 elementary reactions was obtained by coupling the simplified model with the Davis chemical kinetic model.33 The simplified model was verified by the ignition time and flame propagation velocity of gasoline and syngas fuel as shown in Figure 1. The ignition delay test data were from Kalitan34 and Cancino,35 and the laminar flame propagation velocity data were from Bouvet,36 Zhao,37 and Jerzembeck.38 The simplified chemical kinetic model of syngas and gasoline was used as the basis for subsequent three-dimensional numerical simulation.
Figure 1.

(a–d) Verification of the reduced chemical kinetic model for syngas and gasoline blend.
Based on the calculation model selected in this paper and the set initial conditions and boundary conditions, the numerical simulation was carried out under the corresponding engine bench test conditions, and the results were compared with the test data39 to verify the accuracy of the research model. The engine test parameters used to verify the research model are shown in Table 5, the intake and exhaust valve lift curves are shown in Figure 2.
Table 5. Engine Conditions for Model Validation.
| parameter | numerical value |
|---|---|
| intake valve opening and closing time (°CA) | 311–592 |
| exhaust valve opening and closing time (°CA) | 150–396 |
| fuel injection moment (°CA) | 440.25 |
| fuel injection duration (°CA) | 52.1 |
| cycle fuel injection quantity (mg) | 65.026 |
| fuel injection temperature (K) | 298 |
| injection pressure (MPa) | 35 |
| nozzle type | six-hole nozzle |
| ignition moment (°CA) | 5.67 |
Figure 2.

Intake and exhaust valve lift curve.
Figure 3 shows that the research result of numerical simulation is in good agreement with the in-cylinder pressure curve of gasoline engine under the corresponding test condition in the ref (39). Although due to the difference between gasoline surrogate fuel and the actual gasoline fuel, the difference between the initial temperature and pressure conditions of single cycle numerical simulation and the multi-cycle test value, and the neglect of relevant details based on assumptions in the process of model simplification, the deviation is still within the allowable error range, and the numerical simulation results in this paper are reliable.
Figure 3.

Verification of the research models.
2.4. Grid Independence Verification
The PISO algorithm used in this paper involves the division of grids. For gasoline engine with a certain displacement, a smaller grid size means more basic grid, and the numerical solution accuracy of related parameters will be higher. However, a bigger grid size also means an increase in solving time and higher requirement for computer computing ability and cost. Therefore, the grid size in the numerical calculation process will have a greater impact on the calculation result. In order to select the basic mesh size suitable for this paper, the mesh independence is verified based on three basic mesh sizes of 8, 4, and 2 mm under the cold flow condition without a nozzle. In the process of mesh independence verification, the research model, initial conditions, and boundary conditions are consistent with the previous.
The verification result of grid independence in Figure 4 show that the numerical simulation results of average pressure and temperature in the cylinder have a certain relationship with the basic grid size. The in-cylinder temperature and pressure levels of the 8 mm base grid are slightly different from those of the other two grid sizes, and the simulation results are almost consistent when the base grid sizes are 4 and 2 mm. It can be considered that the calculation results of the in-cylinder parameters are almost independent of the grid size when the base grid size is less than 4 mm. Therefore, taking into account the requirements of solution accuracy and calculation time cost, this paper adopts the basic grid size of 4 mm in the subsequent numerical calculation. As mentioned above, based on this 4 mm basic grid, the velocity field and temperature field in the whole cylinder area are encrypted by a two-stage adaptive grid, and then the inlet and exhaust valve rotation angle (level 3) and nozzle and spark plug (level 4) are locally encrypted. The number of grids in the numerical simulation process is shown in Figure 5.
Figure 4.

(a, b) Grid independence verification.
Figure 5.

Number of grids in numerical simulation.
2.5. Research Conditions of Gasoline Engine Blended Combustion Syngas
Because the temperature and pressure levels of the storage and transportation of gasoline fuel and syngas fuel are different, they cannot be introduced into the combustion chamber through the same nozzle. In the geometric model constructed in this paper, gasoline fuel is still directly injected into the engine cylinder by direct injection in the cylinder, while the syngas fuel is injected through the low-pressure nozzle inside the inlet and mixed with fresh air in the inlet stroke introducing the cylinder. Based on this idea, the positions of the gasoline fuel nozzle and syngas fuel nozzle are shown in Figure 6. The gasoline high-pressure nozzle and syngas low-pressure nozzle are located in the cylinder and the inlet, respectively. The two nozzles diverge fuel into the cylinder and the inlet so that the fuel can be fully atomized and mixed with air to form a combustible mixture.
Figure 6.

Positions of the intake port injector and the cylinder injector.
Different from the roughly fixed mass or volume ratio of the representative components in gasoline substitute fuels, the ratio relationship between hydrogen and carbon monoxide components in syngas has a large variation range, which is related to the source of syngas fuel production. The focus of this paper is to explore the influence of the blending ratio between gasoline fuel and syngas fuel on the combustion and emission characteristics of gasoline engine. Therefore, the interference or influence of other variables besides the proportional relationship of fuel components should be eliminated as far as possible and the equivalence ratio (φ) of gasoline engine combustion in the cylinder should be consistent under various numerical simulation conditions. In other words, when the intake mass of engine fresh air remains unchanged, the influence of blending combustion syngas on the working performance of gasoline engine is explored by changing the injection mass of gasoline fuel in the cylinder and the injection mass of syngas fuel in the inlet and the proportional relationship between them. In addition, the compression ratio, ignition timing, intake and exhaust valve timing, and other parameters of gasoline engine should also be kept unchanged as controlled variables. The blending ratio of syngas fuel in gasoline engine is defined as follows:
| 1 |
In the formula, α and m represent the mass mixing ratio and mass (kg), respectively. The subscript syn and TPRF refer to the syngas fuel and ternary gasoline surrogate mixture, respectively. The air quality required for the complete combustion of gasoline fuel and syngas fuel mixture in the engine cylinder is
| 2 |
In the formula, MR refers to the air quality consumed by the complete fuel per kilogram of fuel. For the ternary gasoline surrogate mixture in this paper, MRTPRF = 14.87, and the value of MRsyn is closely related to the proportion of hydrogen and carbon monoxide components in the syngas fuel, as shown in the following formula:
| 3 |
In the formula, F represents the mass percentage of hydrogen or carbon monoxide in syngas. Based on the control variable principle mentioned above, the actual air quality in the cylinder introduced through the inlet under different working conditions remains unchanged.
3. Results and Discussion
3.1. Analysis of the Combustion Process of Gasoline Engine Blended with Syngas
3.1.1. Effect of the Proportion of Syngas in Dual Fuel on the Combustion Process
Under the condition of constant fuel–air equivalence ratio, the influence of mixed combustion syngas on the combustion performance of gasoline engine is studied by changing the mass ratio (αsyn) of syngas in the mixed fuel. It is found that when the mass ratio of hydrogen in syngas is about 0.3, the low calorific value of syngas fuel is approximately equal to that of gasoline fuel. Therefore, this paper first sets the mass ratio of hydrogen to carbon monoxide in syngas as FH2/FCO = 0.3/0.7. At this time, the calorific values of the two different fuels are almost the same, and the heat release law in the combustion process is only related to the percentage of syngas in the dual fuel. The pure gasoline fuel condition with αsyn = 0% and the syngas/gasoline dual fuel conditions with αsyn = 5%, αsyn = 10%, αsyn = 15%, and αsyn = 20% are named Fuel 1, Fuel 2, Fuel 3, Fuel 4, and Fuel 5, respectively. The relevant combustion parameters of gasoline engine blended with syngas fuel under Fuels 1–5 working conditions are solved under the research model, and the initial conditions and boundary conditions remain unchanged. Fuels 1–5 dual fuel injection mass are shown in Table 6.
Table 6. Fuel Injection Amounts of Fuels 1–5.
| fuel | syngas quality (kg) | gasoline quality (kg) | proportion of syngas quality (αsyn) |
|---|---|---|---|
| Fuel 1 | 0 | 6.5026 × 10⁻⁵ | 0 |
| Fuel 2 | 3.2827 × 10⁻⁶ | 6.2372 × 10⁻⁵ | 5% |
| Fuel 3 | 6.6297 × 10⁻⁶ | 5.9667 × 10⁻⁵ | 10% |
| Fuel 4 | 1.0043 × 10⁻⁵ | 5.6909 × 10⁻⁵ | 15% |
| Fuel 5 | 1.3524 × 10⁻⁵ | 5.4096 × 10⁻⁵ | 20% |
The variation of the average temperature and pressure in the cylinder of gasoline engine with the increase in the mass fraction of syngas in the syngas/gasoline dual fuel is shown in Figure 7. When the spark plug is not ignited, the first pressure peak generated by the low-temperature reaction before the ignition of the fuel in the cylinder in Fuels 1–5 has no significant difference, while the second larger pressure peak generated by the ignition of the fuel has a significant difference. As the mass ratio of syngas in Fuels 1–5 gradually increases from 0 to 20%, the peak value of in-cylinder average pressure increases first and then decreases. This shows that although the addition of syngas shortens the ignition delay time of the main combustion in a certain range, resulting in a faster ignition of the combustible mixture and a greater peak pressure, this promotion is limited. From the relationship between the ignition delay time and the system reaction rate, the system reaction rate in the low-temperature stage is mainly dominated by the oxidation reaction of large molecules such as gasoline C7–C8, while the addition of syngas dilutes the concentration of gasoline fuel leading to a slower oxidation rate of hydrocarbon molecules, and the ignition delay time in the low-temperature reaction stage is relatively lagged. The reaction rate of the system in the high-temperature stage is more dependent on the reaction of small molecules, and the C0 small molecules in the syngas can improve the activity of the reaction system, so the fire delay time in the high-temperature reaction stage is relatively early. In addition, the difference in the variation law of in-cylinder pressure of Fuels 1–5 is mainly reflected in the peak value and the second pressure rise stage. The working condition with a larger peak value of in-cylinder pressure also passes through the NTC stage earlier and starts the second pressure rise, while the curve of the decline stage of the average in-cylinder pressure of Fuels 1–5 after 40 °CA is basically coincident.
Figure 7.

(a–d) Average pressure and temperature in the cylinder of Fuels 1–5.
The change of average temperature in the cylinder with different fuels (Fuels 1–5) has a similar law to the change of average pressure. The peak value of the in-cylinder average temperature first increases and then decreases with the increase in the mass fraction of syngas fuel in the dual fuel. Fuel 3 corresponds to the maximum average in-cylinder temperature level in the range, which is about 2770 K. Similarly, the temperature curve of fuel with a larger peak temperature level began to rise sharply at an earlier time. In the research scope of this paper, the peak value of in-cylinder temperature of Fuel 3 is the largest, and the peak value of in-cylinder temperature of pure gasoline fuel of Fuel 1 is the smallest. The phase difference between the two temperature curves is about 8 °CA, which also indicates that the ignition time of Fuel 3 is earlier than that of Fuel 1. The addition of syngas in this concentration range shortens the ignition delay of the main combustion. In summary, during the gradual increase in the mass ratio of syngas in the dual fuel from 0%, the average in-cylinder pressure and in-cylinder temperature both increase first and then decrease, indicating that the influence of the incorporation of syngas fuel on the temperature and pressure level in the cylinder is not monotonous but has a complex influence law that promotes first and then inhibits.
The indicator calculated on the basis of the work done to the piston by each cycle of fuel combustion is the indicator performance index of the engine, such as the indicator power and indicator efficiency of the gasoline engine. The indicator is only related to the thermal power conversion process in the engine cylinder and is not related to the energy dissipation such as mechanical friction and flow loss in the engine working process. The indicator power and indicator efficiency are important parameters to measure the heat-power conversion performance of gasoline engine. The indicator diagram for Fuels 1–5 fuel conditions is shown in Figure 8a. The results show that the differences in the indicator diagram of different syngas mass ratios are mainly reflected in the 10–50 °CA stage. Combined with the working process of the engine, it can be seen that the piston is gradually moving away from the top dead center at this stage, the mixed fuel is ignited by the spark plug, and a large amount of heat is released in a very short time. While the exothermic reaction in the low-temperature phase is dominated by the large molecule of gasoline fuel, the small molecule reaction in the syngas in the high-temperature phase drives the system to release more reaction heat in a shorter period of time. The addition of syngas increases the reaction rate of the system in the high-temperature region, so the addition of syngas makes the combustion exothermic process more intense, but the addition of too much syngas reduces the total heat release level due to its lower heating value. This is consistent with the results shown for the indicated power.
Figure 8.

(a, b) Indicator diagram and indicated power of Fuels 1–5.
Figure 9 shows the instantaneous heat release rate and cumulative heat release of Fuels 1–5 fuel conditions during combustion. The results show that the peak value of instantaneous heat release rate is closely related to the mass ratio of syngas in the dual fuel. The peak value of instantaneous heat release rate increases first and then decreases with the increase in the mass ratio of syngas in the dual fuel. The maximum peak heat release rate under the Fuel 3 fuel condition is close to 280 J/°CA. When the mass ratio of syngas continues to increase to Fuel 5, the peak value of instantaneous heat release rate decreases rapidly or even becomes lower than the pure gasoline fuel condition. Specific to the instantaneous heat release rate curve, it is found that the fuel component working condition with a high heat release rate peak also tends to start and end heat release at an earlier time. For example, the Fuel 3 fuel condition with the highest instantaneous heat release rate peak completes heat release at about 32 °CA, while the Fuel 1 and Fuel 5 with a low heat release rate peak complete the heat release process of combustion at a more lagging 45 °CA. On the other hand, the cumulative heat release of Fuels 1–5 under different fuel conditions is shown in Figure 9. It can be seen that under the premise of controlling the fuel–air equivalence ratio in the cylinder of the gasoline engine and the low calorific value of the syngas and gasoline fuel, the internal mass ratio of the dual fuel has little effect on the overall cumulative heat release of the combustion process. The cumulative heat is only changed in the range of less than 40 J, and the cumulative heat release corresponding to the Fuel 2 fuel condition is the highest, about 2600 J. The difference lies in the beginning and ending time of the heat release process and the heat release duration, which is the same as the results of the instantaneous heat release rate curve. Based on the comprehensive analysis of the instantaneous heat release rate curve and the cumulative heat release in the combustion process, under the premise that Fuels 1–5 fuel conditions have roughly the same cumulative heat release, the peak heat release rate of the Fuel 3 fuel condition is the highest, the starting and ending times of heat release are earlier than those of other fuel conditions, and the heat release duration is the shortest. In other words, the gasoline engine fueled with Fuel 3 releases the same total heat at a faster rate in an earlier time. Such a heat release law shows that the combustion process of Fuel 3 is closer to the constant volume heat release process of the theoretical cycle, which makes the cycle condition have a higher thermal efficiency and is conducive to reducing the afterburning period of the fuel.
Figure 9.

(a–d) Instantaneous heat release rate and cumulative heat release of Fuels 1–5.
The influence of the proportion of syngas in the dual fuel on the combustion is further analyzed from the perspective of small molecule intermediate products in the combustion process. Figure 10 shows the comparison of mass change curves of important intermediate products in the combustion process of Fuels 1–5 fuel conditions. Macromolecular hydrocarbon fuels are slowly oxidized from the low-temperature reaction stage to generate their own oxidation products. During this stage, CH2O and H2O2 are generated in large quantities. Subsequently, H2O2 was decomposed through the key three-body reaction R.H2O2 (+M) ↔ OH + OH (+M) to form a large number of highly active OH, which also indicated that the in-cylinder combustion entered the high-temperature oxidation reaction stage. At the beginning of a high-temperature reaction, a small amount of CH2O is oxidized to HCO, and HCO is further oxidized to CO and releases a lot of heat. With the increase in in-cylinder temperature, H2O2 decomposes rapidly to produce OH. Under the oxidation of OH, macromolecule hydrocarbon fuels such as isooctane, N-heptane, and toluene in the cylinder are oxidized to corresponding alkyl and benzyl groups, respectively. In this process, because the OH content used to oxidize CH2O decreases, the heat release rate in the cylinder will decrease. When the macromolecular hydrocarbon fuel in the cylinder is completely consumed, the remaining CH2O is also consumed rapidly, and the CO concentration increases rapidly and a large amount of heat is released in a short time. Specifically, under the different conditions of Fuels 1–5, the key intermediate products CH2O and H2O2 accumulated in large quantities in the low-temperature oxidation stage begin to form in large quantities near 10 °CA and are completely consumed no later than 40 °CA. The peak and occurrence time of the mass of CH2O and H2O2 are related to the mass ratio of syngas. Among the fuel ratios in this paper, the Fuel 3 fuel condition is the most conducive to the accumulation and consumption of CH2O and H2O2 intermediate products in advance, and the mass concentration of the two key intermediate products are the largest under this condition. Combined with the previous analysis, this phenomenon also explains the law of instantaneous heat release rate and its peak value with the mass ratio of syngas from the perspective of chemical kinetics.
Figure 10.

(a–h) Mass change of important intermediate products of Fuels 1–5.
3.1.2. Effect of Hydrogen and Carbon Monoxide Ratio in Syngas on the Combustion Process
The previous part researches the combustion process of Fuels 1–5 fuel conditions with the same internal component ratio of syngas (FH2/FCO = 0.3/0.7) and different mass percentages of syngas (αsyn = 0–20%). Since the actual syngas fuel is mainly composed of hydrogen and carbon monoxide and the relationship between hydrogen and carbon monoxide has a large range of changes, so on the basis of fixed syngas percentage αsyn = 10%, the influence of this component factor on the combustion process of gasoline engine blended combustion syngas fuel is further explored by adjusting the composition ratio of syngas. The dual fuel injection qualities of fuel components Fuel 3-1, Fuel 3-2, and Fuel 3-3 used in this part of the study are shown in Table 7.
Table 7. Fuel Injection Amounts of Fuels 3-1–3.
| fuel | syngas quality (kg) | gasoline quality (kg) | FH2/FCO |
|---|---|---|---|
| Fuel 3-1 | 6.6297 × 10⁻⁶ | 5.9667 × 10⁻⁵ | 0.3/0.7 |
| Fuel 3-2 | 6.3520 × 10⁻⁶ | 5.7168 × 10⁻⁵ | 0.5/0.5 |
| Fuel 3-3 | 6.0967 × 10⁻⁶ | 5.4870 × 10⁻⁵ | 0.7/0.3 |
The relationship between the initial and boundary conditions, fuel–air equivalence ratio, and syngas/gasoline mass ratio of the gasoline engine with Fuels 3-1–3 remain unchanged. The change of combustion process depends on the proportion of hydrogen and carbon monoxide in syngas fuel. Figure 11 shows the average pressure and temperature changes in the cylinder of the dual fuel engine under Fuels 3-1–3fuel conditions. Compared with the numerical results under Fuels 1–5 fuel conditions, it is found that the influence of the ratio of hydrogen and carbon monoxide in syngas on the temperature and pressure levels in the cylinder is far less than that of the mass ratio of syngas in dual fuel on the temperature and pressure levels. The average in-cylinder pressure of Fuels 3-1–3changes only within 10–10.2 MPa, and the variation range of average in-cylinder temperature is no more than 40 K. This phenomenon shows to some extent that hydrogen and carbon monoxide have roughly the same promoting effect on the increase in in-cylinder temperature and pressure level of gasoline engine when burning syngas/gasoline fuel, which also shows that hydrogen and carbon monoxide have the same effect on shortening the ignition delay time in the main combustion stage. However, with the increase in hydrogen mass ratio in syngas, the average pressure in the cylinder increases first and then decreases. This is because the H2 in the syngas mainly enhances the reaction rate of the reaction system in the high-temperature phase, while the addition of H2 in the low-temperature phase dilutes the concentration of gasoline macromolecules, thus inhibiting the low-temperature oxidation reaction.
Figure 11.

(a–d) Average pressure and temperature in the cylinder of Fuels 3-1–3.
The indicator diagram and indicated power of Fuels 3-1–3fuel with different hydrogen and carbon monoxide ratios are shown in Figure 12. Obviously, a higher hydrogen mass ratio in the dual fuel leads to the advance of the average pressure peak in the cylinder, which is consistent with the result of the average pressure curve in the cylinder. However, the indicated power diagram of Fuels 3-1–3shown in Figure 12b is closer to the change of the average temperature level in the cylinder. A higher ratio of hydrogen inside the syngas as soon as possible promotes the high-temperature in-cylinder combustion process, but the lower power density slightly reduces the overall heat release from the combustion.
Figure 12.

(a, b) Indicator diagram and indicated power of Fuels 3-1–3.
The instantaneous heat release rate and cumulative heat release of Fuels 3-1–3are further analyzed, and the calculation results are shown in Figure 13. Among the three research conditions, Fuel 3-2 has the maximum peak value of instantaneous heat release rate and the highest cumulative heat release. The results show that when the ratio of syngas to gasoline is fixed, the overall heat release process of the dual fuel engine is gradually advanced with the increase in the mass ratio of hydrogen inside the syngas in the dual fuel. The heat release peak time of Fuel 3-3 with a higher hydrogen ratio is about 2 and 4 °CA earlier than those of Fuel 3-2 and Fuel 3-1, respectively. At the same time, the heat release process of Fuel 3-3 with a higher hydrogen ratio is also earlier than that of the other two conditions, which means that the heat release in the cylinder of the dual fuel engine with a higher hydrogen ratio is closer to the constant volume heat release at the upper stop point, which is closer to the theoretical cycle and makes the engine have a better performance.
Figure 13.

(a–d) Instantaneous heat release rate and cumulative heat release of Fuels 3-1–3.
Figure 14 shows the mass change of the important intermediate components in the engine cylinder with different hydrogen and carbon monoxide ratios during combustion. The results show that when gasoline engines burn different dual fuels of Fuels 3-1–3, the key intermediate products CH2O and H2O2 accumulated in large quantities in the low-temperature oxidation stage have roughly the same variation law. Under the premise of fixed proportion of syngas to gasoline, with the increasing proportion of hydrogen in syngas, the mass of CH2O and H2O2 reaches the peak at an earlier time and they are consumed at an earlier time. The peak and occurrence time of these two key components are related to the proportion of hydrogen and carbon monoxide in syngas. A higher hydrogen content is conducive to the formation of CH2O and H2O2 components and is consumed in large quantities during combustion. The change rule of OH is similar to that of CH2O and H2O2. The difference is that the generation time and complete consumption time of OH lag behind CH2O and H2O2, which are 20 and 80 °CA, respectively. The change of HCO is opposite to the former. The increase in hydrogen ratio in syngas inhibits the formation of HCO. As an important precursor of carbon monoxide, the decrease in HCO mass will also inhibit the formation of carbon monoxide.
Figure 14.

(a–h) Mass change of important intermediate products of Fuels 3-1–3.
3.2. Analysis of Emission Performance of Gasoline Engine Blended Combustion Syngas
With the increasingly perfect and strict emission regulations, the emission performance of gasoline engine cannot be ignored. The main indexes of engine emission performance are the emission concentration of pollutants, such as nitrogen oxides, soot, unburned hydrocarbons, and carbon monoxide. Because the three-dimensional numerical simulation in this paper is mainly aimed at the combustion process and emission of the cylinder, it does not consider the three-way catalytic converter and other post-processing methods used in the actual operation of the vehicle and only considers the mass concentration of exhaust gas in the gasoline engine cylinder. Although carbon dioxide is nontoxic, it will cause damage to the atmospheric environment as a greenhouse gas. Therefore, this paper also calculates the emission of carbon dioxide as a measure of engine emission performance.
3.2.1. Effect of the Proportion of Syngas in Dual Fuel on the Emission Performance
The emission of nitrogen oxides for gasoline engine using Fuels 1–5 with different mass percentages of syngas is shown in Figure 15. The results show that nitrogen oxides are first generated in large quantities, then partially consumed, and finally stabilized at a certain mass and gradually discharged from the cylinder after the exhaust valve is opened. Fuel 2 with 5% syngas mass has the highest nitrogen oxide mass peak, and the nitrogen oxide peak gradually decreases to a fixed value with the increase in syngas mixing amount. However, the peak value of nitrogen oxides does not represent the final emission. The opening time of gasoline engine exhaust valve in this research model is 131 °CA. Therefore, the stable value of nitrogen oxide mass before this time is selected as the nitrogen oxide emission, and other emission measurement indexes are consistent with that. Obviously, the nitrogen oxide emission of pure gasoline fuel is the highest, and with the increase in the proportion of syngas in the mixed fuel, the nitrogen oxide emission basically decreases. When the proportion of syngas increases from 15% of Fuel 4 to 20% of Fuel 5, nitrogen oxide emission will no longer continue to decrease, and within the scope of this study, the nitrogen oxide emission performance of Fuel 4 is the best.
Figure 15.

(a, b) NOx emission of Fuels 1–5.
The soot emission of Fuels 1–5 is shown in Figure 16. After ignition of the fuel in the cylinder, the soot mass rapidly increases to the peak value and then gradually decreases to a stable value with the change of the crank angle. The formation of soot is jointly affected by the conversion and oxidation of polycyclic aromatic hydrocarbons, and the factor controlling the two processes is the temperature level in the cylinder. There is no soot formation at low temperatures, and polycyclic aromatic hydrocarbons begin to generate in large quantities at medium temperatures. Polycyclic aromatic hydrocarbons were oxidized at high temperatures, and the soot mass began to decrease. Although the soot peak level of Fuels 1–5 have a complex change rule, the soot emission shows a monotonically increasing relationship after the high-temperature oxidation stage. That is, the soot emission increases monotonically with the increase in the mass ratio of syngas. Obviously, the soot emission performance of Fuel 1 is the best under the rule.
Figure 16.

(a, b) Soot emission of Fuels 1–5.
The emission curves of unburned hydrocarbons of Fuels 1–5 are shown in Figure 17. After the beginning of combustion, hydrocarbons are consumed in large quantities through the relevant chemical reaction path, and the remaining unburned hydrocarbons are discharged as harmful emission. The calculation results show that the unburned hydrocarbons of Fuel 3 first reach a stable value at about 30 °CA followed by Fuel 2 and Fuel 4; Fuel 1 finally reaches a stable value after 40 °CA, indicating that the mixing of syngas accelerates the consumption rate of hydrocarbon fuel in the cylinder to a certain extent. The result in Figure 17b shows that with the increase in the mass ratio of syngas in the dual fuel, the emission of unburned hydrocarbons in the cylinder decreases first and then increases. Among them, the unburned hydrocarbon emission level under the Fuel 3 fuel condition is the best, and the absolute emission of unburned hydrocarbons is less than half of that under the Fuel 1 condition.
Figure 17.
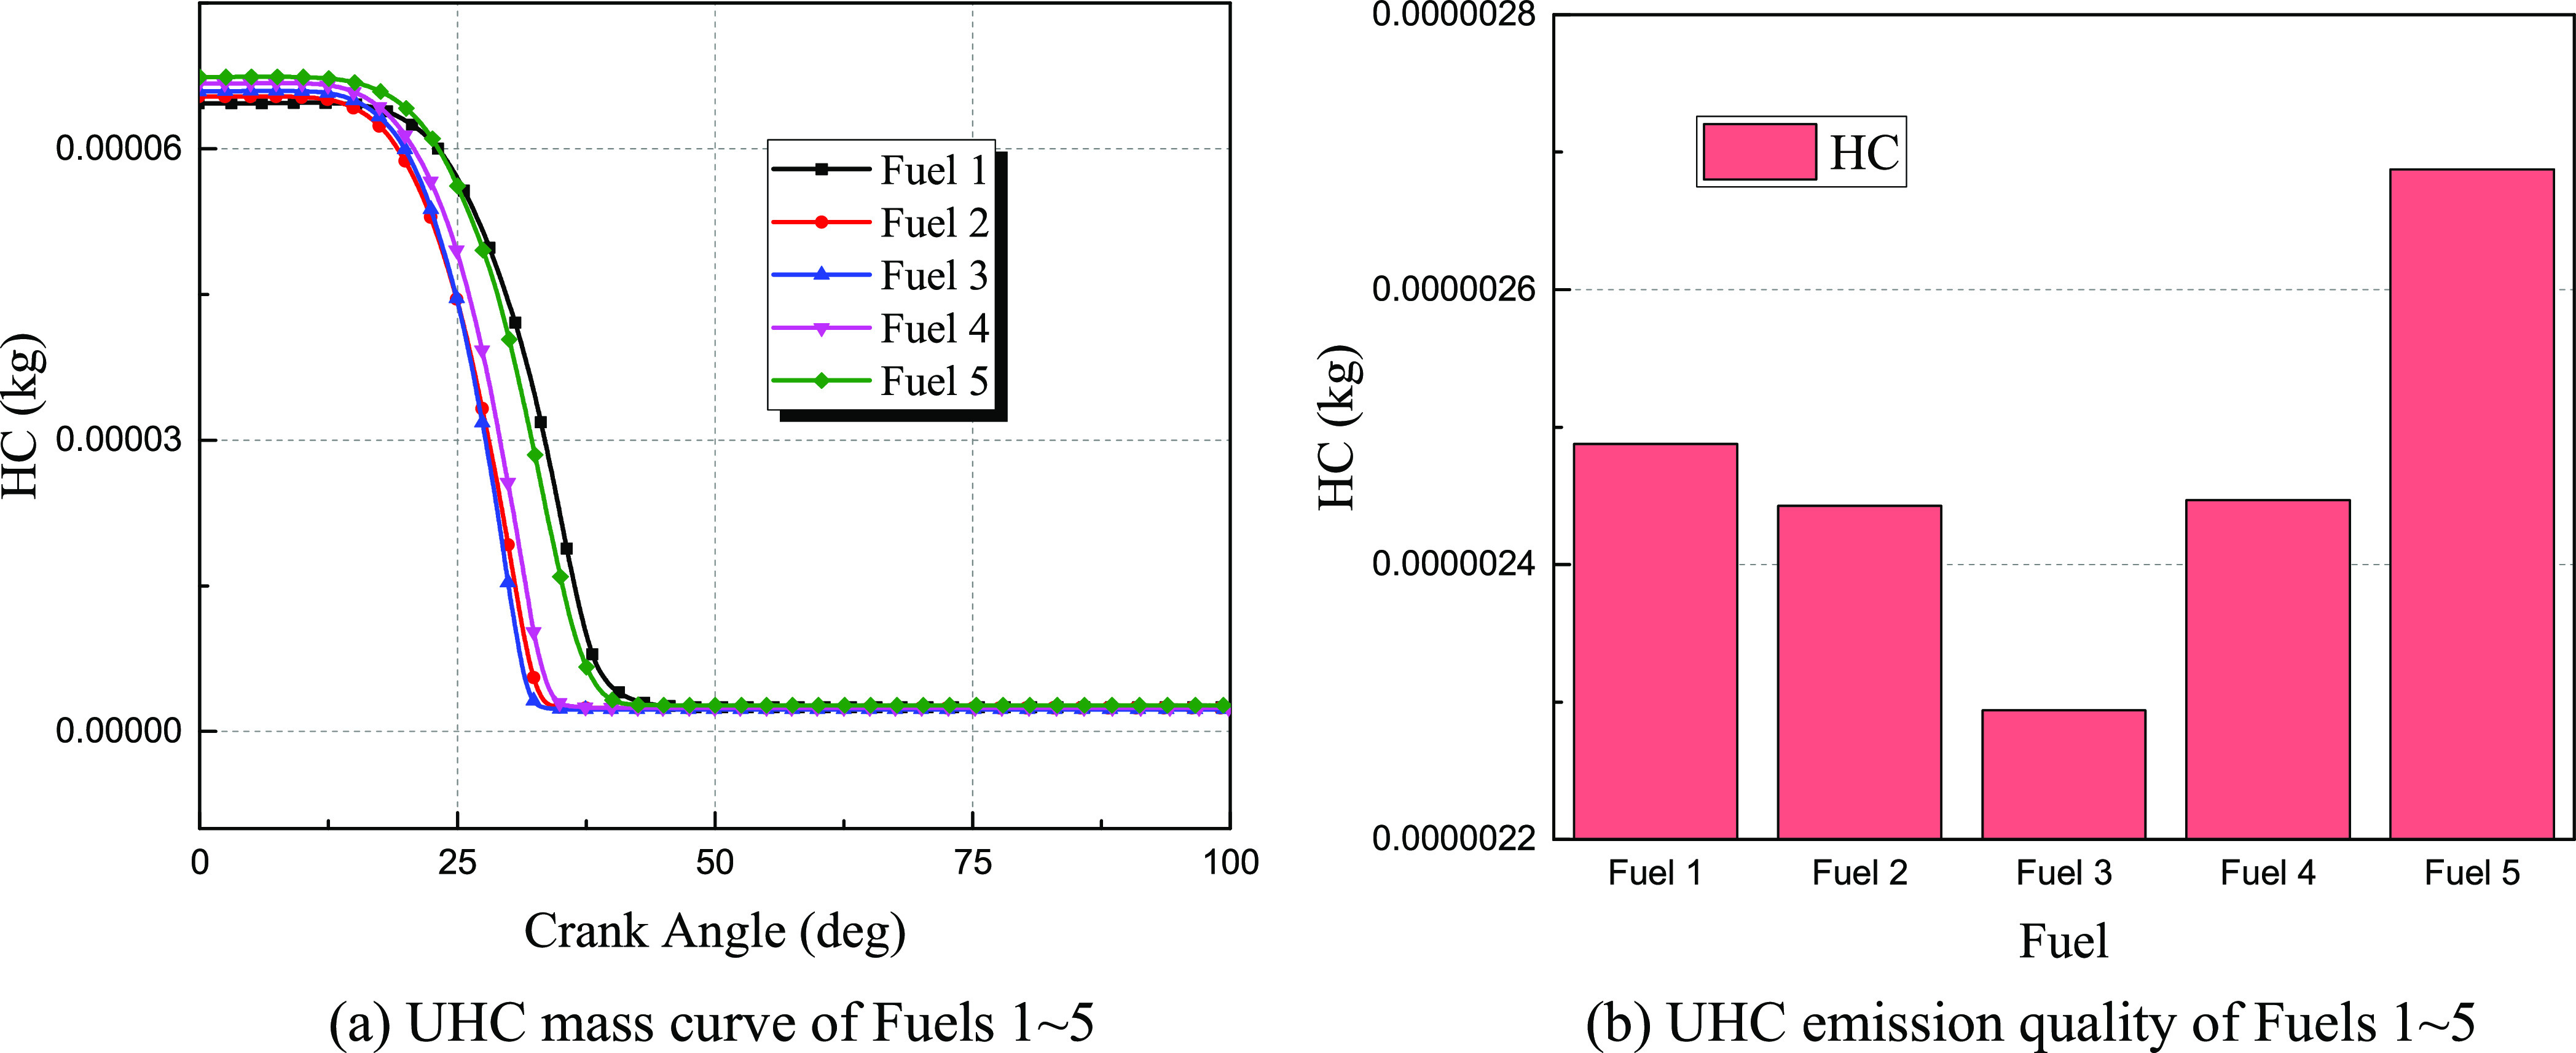
(a, b) Unburned hydrocarbon emission of Fuels 1–5.
Figure 18 shows the carbon monoxide and carbon dioxide emission curves of Fuels 1–5 conditions. After the combustion process begins, the mass concentration of carbon monoxide increases sharply at first and then gradually decreases to a stable value with the change of crank angle, while the mass concentration of carbon dioxide increases rapidly at first and then slowly increases to a stable value with the change of crank angle. In the process of increasing the proportion of syngas from 0 to 20%, the peak value of carbon monoxide mass increases monotonically, while the time when the peak value of carbon monoxide appears shows a change rule of first advance and then delay. The peak time of carbon monoxide in Fuel 1 is about 38 °CA, and the peak time of carbon monoxide is about 30 °CA in advance by Fuel 3, and the peak time of carbon monoxide is again delayed to 40 °CA by Fuel 5. The final stable carbon monoxide emissions of Fuels 1–5 are still positively correlated with the proportion of syngas. Within the scope of this study, the minimum carbon monoxide emission of Fuel 1 is about 15 mg, and the maximum carbon monoxide emission of Fuel 5 is about 25 mg. The change rule of the final stable emission of carbon dioxide is opposite to that of carbon monoxide. The absolute value of carbon dioxide emission is negatively correlated with the proportion of syngas. In the research scope of this paper, Fuel 1 corresponds to the maximum carbon dioxide emission, about 168.5 mg, and Fuel 5 corresponds to the minimum carbon dioxide emission, about 159 mg. It can be seen that carbon dioxide emission is an order of magnitude higher than carbon monoxide emission.
Figure 18.

(a–d) CO and CO2 emissions of Fuels 1–5.
3.2.2. Effect of Hydrogen and Carbon Monoxide Ratio in Syngas on Emission Performance
Similarly, the influence of the internal component ratio of syngas on the emission performance of gasoline engine blended combustion syngas also needs to be researched and analyzed. Figure 19 shows the nitrogen oxide emission of Fuels 3-1–3conditions. The nitrogen oxide emission curves of the three fuel conditions are basically the same, showing a trend of a rapid increase after ignition and a slow decrease to a stable value. The emission of nitrogen oxides also has obvious variation with the ratio of hydrogen and carbon monoxide. The nitrogen oxide emission during the combustion process of the engine is also higher under the condition of a higher hydrogen content. The nitrogen oxide emission corresponding to the condition of Fuel 3-3 is about twice that of Fuel 3-1. The addition of more hydrogen components in the syngas increases the reaction temperature, which promotes the formation of nitrogen oxides in the cylinder of gasoline engine to some extent. That is also one of the main factors limiting the fuel incorporation of more syngas in gasoline engine.
Figure 19.

(a, b) NOx emission of Fuels 3-1–3.
The soot emissions of Fuels 3-1–3are shown in Figure 20, and the overall emission curve of soot still shows a rapid increase first and then a decrease to a stable value. The change of soot emission quality is slightly different from that of nitrogen oxides. Soot began to gradually generate and accumulate in the cylinder before the top dead center, and the similar process of nitrogen oxides is located after the ignition time of the engine. That indicates that the formation process of soot begins before the spark plug ignition and generally precedes the formation time of nitrogen oxides. The specific emission result shows that as the proportion of hydrogen in syngas increases gradually, the emission quality of soot decreases significantly. The emission quality of soot corresponding to Fuel 3-3 is slightly lower than that of Fuel 3-2, but the emission quality of soot for both fuels is significantly lower than that of Fuel 3-1.
Figure 20.

(a, b) Soot emission of Fuels 3-1–3.
The unburned hydrocarbon emissions of Fuels 3-1–3 are shown in Figure 21. The results show that although the emission of unburned hydrocarbons increases gradually with the increase in hydrogen mass ratio in syngas, the variation range is narrow, and the variation range of unburned hydrocarbons mass is less than 3 × 10⁻⁸ kg. Therefore, it can be considered that the ratio of hydrogen to carbon monoxide in the syngas has little effect on the emission of unburned hydrocarbons, which is almost negligible.
Figure 21.

(a, b) Unburned hydrocarbon emission of Fuels 3-1–3.
Finally, carbon monoxide and carbon dioxide emissions of Fuel 3-1–3 are shown in Figure 22. The mass concentration of carbon monoxide in Fuels 3-1–3increases rapidly after the beginning of combustion and reaches a peak value at about 30 °CA. The mass ratio of hydrogen in syngas has no effect on the peak time of carbon monoxide mass, and then the mass of carbon monoxide in the cylinder decreases gradually to a stable value and discharges the cylinder with the change of crank angle. In the three different fuel conditions, with the increasing proportion of hydrogen mass in syngas, the carbon monoxide emission decreases gradually, and the carbon monoxide emission under the Fuel 3-3 condition is only quarter of that under the Fuel 3-1 condition. As shown in Figure 22c, the mass change curves of carbon dioxide are different from those of carbon monoxide. The mass concentration of carbon dioxide increases rapidly first and then slowly increases with the change of crank angle after combustion, while the final carbon dioxide emission increases first and then decreases with the change of fuel conditions of Fuel 3-1–3. The Fuel 3-2 fuel condition has the highest carbon dioxide emission. At this time, the addition of hydrogen in syngas promotes the formation of carbon dioxide in the cylinder, but with the increase in hydrogen ratio, the carbon dioxide emission in the cylinder begins to decrease.
Figure 22.

(a–d) CO and CO2 emissions of Fuels 3-1–3.
4. Conclusions
Based on the appropriate research model, initial conditions, boundary conditions, and mesh size, the effects of the ratio of syngas to gasoline and the ratio of hydrogen and carbon monoxide in syngas on the combustion and emission process of gasoline engine are studied by numerical simulation. The conclusions are as follows:
-
(1)
When the mass ratio of syngas in dual fuel increases gradually, the average pressure and average temperature of gasoline engine increase first and then decrease. At the same time, the peak value of the indicated power and the heat release rate of the gasoline engine increases first and then decreases. The peak value of the indicated power and the heat release rate of Fuel 3 (αsyn = 10%) is the highest, and the heat release duration is the shortest. The combustion process of the Fuel 3 condition is closer to the constant volume heat release process of the theoretical cycle and has a higher thermal efficiency.
-
(2)
The effect of the ratio of hydrogen and carbon monoxide in syngas on the average temperature and pressure in cylinder is far less than that of the ratio of syngas to gasoline. A higher proportion of hydrogen in the syngas leads to the advance of the peak pressure in the cylinder during the combustion of the gasoline engine. The in-cylinder heat release process of dual fuel engine with a higher proportion of hydrogen is closer to the constant volume heat release at the top dead center, so it has a higher thermal efficiency.
-
(3)
According to the analysis of the emission process, with the increase in the proportion of syngas in the dual fuel, the nitrogen oxide emission is gradually reduced. Soot emission increases monotonously with the increase in the mass ratio of syngas in the dual fuel, while unburned hydrocarbon emission decreases first and then increases. In the process of increasing the proportion of syngas in dual fuels from 0 to 20%, the carbon monoxide emission monotonically increases, and the carbon dioxide emission is negatively correlated with the proportion of syngas mass in the dual fuel.
-
(4)
A higher proportion of hydrogen in syngas makes nitrogen oxide emission higher during the process of combustion. As the proportion of hydrogen in syngas gradually increases, the emission quality of soot significantly decreases. The ratio of hydrogen and carbon monoxide in syngas has little effect on unburned hydrocarbon emission. In addition, with the increasing proportion of hydrogen in syngas, carbon monoxide emission shows a decreasing trend, and carbon dioxide emission increases first and then decreases.
Acknowledgments
This work was supported by the Special Key Project of Chongqing Technology Innovation and Application Development (Grant Numbers: cstc2020jscx-dxwtBX0024 and cstc2021jscx-dxwtBX 0024).
Author Contributions
G.F., Z.Z., and Z.Z. conceived and designed the study. Z.Z. and G.F. performed the experiments. G.F. wrote the paper. G.F., Z.Z., and Z.Z. reviewed and edited the manuscript. All authors read an approved the manuscript.
The authors declare no competing financial interest.
References
- Chen S.; Zhang Q.; Mclellan B.; Zhang T. Review on the petroleum market in China: history, challenges and prospects. Petrol. Sci. 2020, 17, 1779–1794. 10.1007/s12182-020-00501-6. [DOI] [Google Scholar]
- Jiao J.; Zuo F.; Li L.; Yuan H.; Li J. Estimation of China’s alternative policies of automotive fuels – A perspective of oil dependence. J. Cleaner Prod. 2017, 161, 698–707. 10.1016/j.jclepro.2017.05.107. [DOI] [Google Scholar]
- Lu H.; Xu F.; Liu H.; Wang J.; Campbell D. E.; Ren H. Emergy-based analysis of the energy security of China. Energy 2019, 181, 123–135. 10.1016/j.energy.2019.05.170. [DOI] [Google Scholar]
- Li J.; Tian Y.; Yan X.; Yang J.; Wang Y.; Xu W.; Xie K. Approach and potential of replacing oil and natural gas with coal in China. Front. In. Energy 2020, 14, 419–431. 10.1007/s11708-020-0802-0. [DOI] [Google Scholar]
- Rahim M. R.; Trisasongko A. P.; Mohd Jaafar M. N.; Othman N.; Ramli Y.; Abdul Malik M. S.; Said M. Review: Development of gasification technology and its application. J. Teknol. 2021, 84, 193–210. 10.11113/jurnalteknologi.v84.17709. [DOI] [Google Scholar]
- Sanlisoy A.; Ozdinc Carpinlioglu M. Microwave Plasma Gasification of a Variety of Fuel for Syngas Production. Plasma Chem. Plasma Process. 2019, 39, 1211–1225. 10.1007/s11090-019-10004-x. [DOI] [Google Scholar]
- Ning W.; Zhao L.; Bei Z. Analysis of the Impact of China’s Energy Consumption Structure on Energy Security. E3S. Web. Conf. 2021, 245, 1054. 10.1051/e3sconf/202124501054. [DOI] [Google Scholar]
- Pan X.; Wang L.; Dai J.; Zhang Q.; Peng T.; Chen W. Analysis of China’s oil and gas consumption under different scenarios toward 2050: An integrated modeling. Energy 2020, 116991. 10.1016/j.energy.2020.116991. [DOI] [Google Scholar]
- Zhao C.; Chen B. China’s oil security from the supply chain perspective: A review. Appl. Energy 2014, 136, 269–279. 10.1016/j.apenergy.2014.09.016. [DOI] [Google Scholar]
- Shahbaz M.; Yusup S.; Inayat A.; Patrick D. O.; Pratama A.; Ammar M. Optimization of hydrogen and syngas production from PKS gasification by using coal bottom ash. Bioresour. Technol. 2017, 241, 284–295. 10.1016/j.biortech.2017.05.119. [DOI] [PubMed] [Google Scholar]
- Mario Toledo T.; Karina Araus S.; Diego Vasconcelo A. Syngas production from coal in presence of steam using filtration combustion. Int. J. Hydrogen Energy 2015, 40, 6340–6345. 10.1016/j.ijhydene.2015.03.022. [DOI] [Google Scholar]
- Xu J.; Yang Y.; Li Y.-W. Recent development in converting coal to clean fuels in China. Fuel 2015, 152, 122–130. 10.1016/j.fuel.2014.11.059. [DOI] [Google Scholar]
- Fiore M.; Magi V.; Viggiano A. Internal combustion engines powered by syngas: A review. Appl. Energy 2020, 276, 115415 10.1016/j.apenergy.2020.115415. [DOI] [Google Scholar]
- Kashyap S.; Vairakannu P. Movable injection point–based syngas production in the context of underground coal gasification. Int. J. Energy Res. 2020, 44, 3574–3586. 10.1002/er.5119. [DOI] [Google Scholar]
- Zhong S.; Xu S.; Bai X.-S.; Peng Z.; Zhang F. Large eddy simulation of n-heptane/syngas pilot ignition spray combustion: Ignition process, liftoff evolution and pollutant emissions. Energy 2021, 233, 121080 10.1016/j.energy.2021.121080. [DOI] [Google Scholar]
- Ran Z.; Hariharan D.; Lawler B.; Mamalis S. Experimental study of lean spark ignition combustion using gasoline, ethanol, natural gas, and syngas. Fuel 2019, 235, 530–537. 10.1016/j.fuel.2018.08.054. [DOI] [Google Scholar]
- Kozlov V. E.; Titova N. S.; Chechet I. V. Modeling study of hydrogen or syngas addition on combustion and emission characteristics of HCCI engine operating on iso-octane. Fuel 2018, 221, 61–71. 10.1016/j.fuel.2018.02.062. [DOI] [Google Scholar]
- Park H.; Lee J.; Jamsran N.; Oh S.; Kim C.; Lee Y.; Kang K. Comparative assessment of stoichiometric and lean combustion modes in boosted spark-ignition engine fueled with syngas. Energy Convers. Manage. 2021, 239, 114224 10.1016/j.enconman.2021.114224. [DOI] [Google Scholar]
- Zhao L.; Wang D.; Qi W. Comparative study on air dilution and hydrogen-enriched air dilution employed in a SI engine fueled with iso-butanol-gasoline. Int. J. Hydrogen Energy 2020, 45, 10895–10905. 10.1016/j.ijhydene.2019.12.124. [DOI] [Google Scholar]
- Martinez-Boggio S. D.; Merola S. S.; Teixeira Lacava P.; Irimescu A.; Curto-Risso P. L. Effect of Fuel and Air Dilution on Syngas Combustion in an Optical SI Engine. Energies 2019, 12, 1566. 10.3390/en12081566. [DOI] [Google Scholar]
- Oh S.; Kim C.; Lee Y.; Yoon S.; Lee J.; Kim J. Experimental investigation of the hydrogen-rich offgas spark ignition engine under the various compression ratios. Energy Convers. Manage. 2019, 201, 112136 10.1016/j.enconman.2019.112136. [DOI] [Google Scholar]
- Hagos F. Y.; Aziz A. R. A.; Sulaiman S. A. Effect of injection timing on combustion, performance and emissions of lean-burn syngas (H2/CO) in spark-ignition direct-injection engine. Int. J. Engine Res. 2016, 17, 921–933. 10.1177/1468087415623910. [DOI] [Google Scholar]
- Fiore M.; Viggiano A.; Fanelli E.; Braccio G.; Magi V. Influence of piston shape and injector geometry on combustion and emission characteristics of syngas in direct-injection spark-ignition engine. Energy. Procedia. 2018, 148, 392–399. 10.1016/j.egypro.2018.08.100. [DOI] [Google Scholar]
- Jamsran N.; Park H.; Lee J.; Oh S.; Kim C.; Lee Y.; Kang K. Influence of syngas composition on combustion and emissions in a homogeneous charge compression ignition engine. Fuel 2021, 306, 121774 10.1016/j.fuel.2021.121774. [DOI] [Google Scholar]
- Caligiuri C.; Žvar Baškovič U.; Renzi M.; Seljak T.; Oprešnik S. R.; Baratieri M.; Katrašnik T. Complementing Syngas with Natural Gas in Spark Ignition Engines for Power Production: Effects on Emissions and Combustion. Energies 2021, 14, 3688. 10.3390/en14123688. [DOI] [Google Scholar]
- Lei P.; Zhang G.; Xie K.; Peng C.; Wang H. Simulation Analysis of Influence of Boundary Parameters on the Performance of Gasoline Compression Ignition Engine. IOP. Conf. Ser. Mater. Sci. Eng. 2018, 423, 12106. 10.1088/1757-899X/423/1/012106. [DOI] [Google Scholar]
- Pomraning E.; Richards K.; Senecal P. K. Modeling turbulent combustion using a RANS model, detailed chemistry, and adaptive mesh refinement. SAE. Int. 2014, 10.4271/2014-01-1116. [DOI] [Google Scholar]
- Yang S. Development of a mechanism-dynamic-selection turbulent premixed combustion model with application to gasoline engine combustion and emissions simulation. Combust. Theor. Model. 2021, 25, 315–350. 10.1080/13647830.2020.1869309. [DOI] [Google Scholar]
- Beale J. C.; Reitz R. D. Modeling spray atomization with the kelvin-helmholtz/rayleigh-taylor hybrid model. Atomization Spray 1999, 9, 623–650. 10.1615/AtomizSpr.v9.i6.40. [DOI] [Google Scholar]
- Andreassi L.; Ubertini S.; Allocca L. Experimental and numerical analysis of high pressure diesel spray–wall interaction. Int. J. Multiphase Flow 2007, 33, 742–765. 10.1016/j.ijmultiphaseflow.2007.01.003. [DOI] [Google Scholar]
- Liu Y.-D.; Jia M.; Xie M.-Z.; Pang B. Enhancement on a Skeletal Kinetic Model for Primary Reference Fuel Oxidation by Using a Semidecoupling Methodology. Energy Fuels 2012, 26, 7069–7083. 10.1021/ef301242b. [DOI] [Google Scholar]
- Liu Y.-D.; Jia M.; Xie M.-Z.; Pang B. Development of a New Skeletal Chemical Kinetic Model of Toluene Reference Fuel with Application to Gasoline Surrogate Fuels for Computational Fluid Dynamics Engine Simulation. Energy Fuels 2013, 27, 4899–4909. 10.1021/ef4009955. [DOI] [Google Scholar]
- Davis S. G.; Joshi A. V.; Wang H.; Egolfopoulos F. An optimized kinetic model of H2/CO combustion. P. Combust. Inst. 2005, 30, 1283–1292. 10.1016/j.proci.2004.08.252. [DOI] [Google Scholar]
- Kalitan D. M.; Mertens J. D.; Crofton M. W.; Petersen E. L. Ignition and oxidation of lean CO/H2 fuel blends in air. J. Propul. Power 2007, 23, 1291–1301. 10.2514/1.28123. [DOI] [Google Scholar]
- Cancino L. R.; Fikri M.; Oliveira A. A. M.; Schulz C. Autoignition of gasoline surrogate mixtures at intermediate temperatures and high pressures: Experimental and numerical approaches. P. Combust. Inst. 2009, 32, 501–508. 10.1016/j.proci.2008.06.180. [DOI] [Google Scholar]
- Bouvet N.; Chauveau C.; Gökalp I.; Lee S. Y.; Santoro R. J. Characterization of syngas laminar flames using the Bunsen burner configuration. Int. J. Hydrogen Energy 2011, 36, 992–1005. 10.1016/j.ijhydene.2010.08.147. [DOI] [Google Scholar]
- Zhao Z.; Conley J. P.; Kazakov A.; Dryer F. L. Burning Velocities of Real Gasoline Fuel at 353 K and 500 K. SAE. Int. 2003, 10.4271/2003-01-3265. [DOI] [Google Scholar]
- Jerzembeck S.; Peters N.; Pepiotdesjardins P.; Pitsch H. Laminar burning velocities at high pressure for primary reference fuels and gasoline: Experimental and numerical investigation. Combust. Flame 2009, 156, 292–301. 10.1016/j.combustflame.2008.11.009. [DOI] [Google Scholar]
- Zhang Q.; Pei Y.; An Y.; Peng Z.; Qin J.; Shi H.; Zhang B.; Zhang Z.; Gao D. Study of water direct injection on knock control and combustion process of a high compression ratio GDI engine. Fuel 2021, 306, 121631 10.1016/j.fuel.2021.121631. [DOI] [Google Scholar]