

Abstract

Securing decarbonized economies for energy and commodities will require abundant and widely available green H2. Ubiquitous wastewaters and nontraditional water sources could potentially feed water electrolyzers to produce this green hydrogen without competing with drinking water sources. Herein, we show that the energy and costs of treating nontraditional water sources such as municipal wastewater, industrial and resource extraction wastewater, and seawater are negligible with respect to those for water electrolysis. We also illustrate that the potential hydrogen energy that could be mined from these sources is vast. Based on these findings, we evaluate the implications of small-scale, distributed water electrolysis using disperse nontraditional water sources. Techno-economic analysis and life cycle analysis reveal that the significant contribution of H2 transportation to costs and CO2 emissions results in an optimal levelized cost of hydrogen at small- to moderate-scale water electrolyzer size. The implications of utilizing nontraditional water sources and decentralized or stranded renewable energy for distributed water electrolysis are highlighted for several hydrogen energy storage and chemical feedstock applications. Finally, we discuss challenges and opportunities for mining H2 from nontraditional water sources to achieve resilient and sustainable economies for water and energy.
Keywords: Green hydrogen, hydrogen economy, water electrolysis, nontraditional water sources, water treatment, techno-economic analysis
Short abstract
Given the relatively insignificant cost of water treatment, utilization of nontraditional water sources could enable distributed water electrolysis to reduce the significant costs and CO2 emissions associated with hydrogen transportation, advancing the transition to sustainable sourcing of energy and chemical feedstocks.
Introduction
Decarbonizing our society will require production of green H2 at scale. Currently, refineries and industrial usage account for the overwhelming majority of global demand for hydrogen. Anticipated adoption of green hydrogen-based fuels and strong growth in hydrogen demand could provide 6% of total cumulative emissions reductions between 2021 and 2050 in the Net Zero Emissions Scenario, avoiding up to 60 Gt CO2 emissions.1 In addition to replacing fossil fuel-derived H2 in the chemical industry, hydrogen-based fuels may fulfill energy storage needs for applications that are difficult to decarbonize such as long-haul trucking, rail transport, maritime shipping, and aviation. Compared to batteries, which can match hourly energy supply and demand trends, hydrogen-based fuels enable seasonal and long-duration energy storage,2 reduce challenges associated with materials scarcity and costs,3 and have a lower extrinsic mission energy (i.e., vehicle weight decreases as energy is consumed).4
Despite the potential of green H2 to advance decarbonization, the transition to a green hydrogen economy has been limited by complexities in the transportation and distribution of H2. For example, small H2 gas molecules easily leak from pipes and storage containers, and liquefaction for easier storage and transport involves significant energy input.5,6 Furthermore, H2 is typically transported by diesel-fueled tube trailers, increasing CO2 emissions for hydrogen usage. The lack of a robust network of distributed refueling stations and the explosion hazards associated with large-volume hydrogen storage also represent crucial bottlenecks.7 In addition to these challenges, green H2 production also requires sources of renewable energy and high-purity water to feed the electrolyzer. Renewable energy costs have become competitive with those of fossil fuels,8 but significant supplies of renewables such as solar and wind remain distributed, remote, or even stranded.9 Considering the challenges of hydrogen distribution and renewable energy transmission, near-point-of-use water electrolysis could minimize the need for transportation of H2 to end-use sites while enabling utilization of local renewable energy resources.
Efforts to produce H2 on a large scale have prioritized direct seawater electrolysis, assuming that the inexhaustible supply of water from the ocean is needed to provide enough water for future green hydrogen needs while avoiding competition with freshwater resources.10−13 However, several recent studies have reported that the energy required for seawater purification is negligible (<0.1%) compared to the electrolysis energy consumption,14−16 suggesting that coupling desalination with high-purity water electrolysis is much more favorable compared to technically challenging direct seawater electrolysis.17 These results imply that the energy and costs of water and wastewater treatment would be eclipsed by those of water electrolysis, mitigating the water-energy trade-off. Therefore, distributed point-of-use water electrolysis could potentially utilize abundant local sources of wastewaters and other nontraditional water sources. If the costs associated with purification of these water sources are negligible, these waters could be mined for decentralized water electrolysis to minimize H2 transportation and renewable energy transmission bottlenecks.
Herein, we evaluate opportunities for decentralized, near-point-of-use hydrogen production from nontraditional water sources. We consider several types of water sources (e.g., municipal wastewater, industrial wastewaters, and brackish groundwater) and assess their capacity for H2 energy extraction as well as the associated energy consumption and costs. Given the opportunities to utilize these water sources for decentralized water electrolysis, we analyze the economic and environmental implications of a distributed hydrogen economy. By quantifying the contributions of transportation distance and economies of scale, we find that distributed water electrolysis can significantly reduce costs and CO2 emissions for green H2 production. Based on these results, we propose opportunities to synergize distributed renewable energy, wastewater sources, and hydrogen production to advance decarbonization for energy storage and the chemical industry. We conclude with a discussion of the challenges and opportunities for a decentralized hydrogen economy. Overall, our study suggests that distributed water electrolysis using nontraditional water sources may facilitate the renewable energy transition to mitigate climate change while also bolstering resilience in energy and water infrastructure as we adapt to life in a changing climate.
Nontraditional Water Sources for Water Electrolysis
To ensure efficient operation (i.e., avoid potential interference of side reactions, ionic poisoning, and cell corrosion), water electrolysis requires the use of high purity water, with the minimum recommended water quality standard typically being American Society for Testing and Materials (ASTM) Type II deionized water.16,18 ASTM Type II water can be produced by passing water through reverse osmosis (RO) followed by an additional polishing step (e.g., ion exchange or electrodeionization), resulting in a product water resistivity of ≥1 MΩ cm and total organic carbon (TOC) of <50 ppb. Because RO is a highly versatile treatment technology, capable of producing consistently high-quality product water for a wide range of feedwater conditions, numerous nontraditional water sources can be considered as feed supply for electrolyzers.
In Table 1, we provide the typical flow rates of several nontraditional waters that could prove valuable to realizing a distributed hydrogen economy. We note that while there may be significant variability in flow rates among different sites, we estimate typical flow rates for water source sites in the United States based on recent surveys and literature (cited in Table 1). Among the evaluated source waters, household water, municipal wastewater, and industrial wastewater are of particular interest, as they are readily compatible with decentralized water electrolysis. Additionally, with the number of seawater desalination plants growing in response to water scarcity, seawater is also a promising source water which can provide relatively large flow rates for electrolyzers. Resource extraction (i.e., upstream oil and gas, hydraulic fracturing operations, and mining) and CO2 sequestration processes also produce large volumes of water,19,20 providing opportunities for the application of water electrolysis at such sites.
Table 1. Summary of Nontraditional Source Waters and Corresponding Opportunities for Mining of H2.
| water source | typical water flow rate per site (m3 yr–1) | H2 produced (kg yr–1)a | H2 energy (kWh yr–1)b | water purification cost ($ m–3)c |
|---|---|---|---|---|
| seawater | 5.17 × 10627,28 | 2.59 × 10⁸ | 3.41–5.11 × 10⁹ | 2.84 |
| household water (public supply) | 4.15 × 10229 | 2.08 × 10⁴ | 2.73–4.10 × 10⁵ | 2.64 |
| municipal wastewater | 3.18 × 10630,31 | 1.59 × 10⁸ | 2.10–3.14 × 10⁹ | 2.64 |
| industrial/textile wastewater | 3.36 × 10632 | 1.68 × 10⁸ | 2.21–3.32 × 10⁹ | 2.67 |
| industrial/concrete wastewater | 5.30 × 10533 | 2.65 × 10⁷ | 3.49–5.23 × 10⁸ | 2.65 |
| industrial/semiconductor wastewater | 5.53 × 10634 | 2.77 × 10⁸ | 3.64–5.47 × 10⁹ | 2.64 |
| CO2 geologic storage produced water | 6.74 × 10619 | 3.37 × 10² | 4.44–6.66 × 10⁹ | 3.79 |
| brackish groundwater | 6.72 × 10635 | 3.36 × 10⁸ | 4.43–6.65 × 10⁹ | 2.66 |
| resource extraction wastewater | 5.67 × 10920 | 2.84 × 10¹¹ | 3.73–5.60 × 10¹² | 4.88 |
Assuming conversion ratio of 10 L of water to 1 kg of H2.
Assuming 40–60% fuel cell efficiency.
Assuming ASTM Type II water production via reverse osmosis followed by ion-exchange resin, excluding pretreatment.
For each water source considered in Table 1, we estimate the amount of hydrogen that can be produced based on the common assumption that the generation of 1 kg of hydrogen requires 10 L of water.21 We note that for each of the water sources, the flow rate of water to the electrolysis step is based on the assumption of 50% water recovery after water treatment (i.e., half of the typical water flow rate per production site). The produced hydrogen from the water electrolysis can then be used for energy generation, with the most common conversion processes involving combustion or electrochemical fuel cells.22 Fuel cells have been investigated heavily as they directly convert the chemical energy in hydrogen to electricity, with pure water and small amounts of heat as the only byproducts. Though fuel cells can theoretically generate electrical energy up to the Gibbs free energy of formation of water (i.e., 237.2 kJ mol–1),23 practical cells incur inevitable irreversible losses, generally operating between 40% and 60% efficiency.24,25 Hence, in Table 1, we present the potential H2 energy recovered for each source water according to this efficiency range. To clearly illustrate the huge magnitude of potential hydrogen energy that could be harvested from relatively small volumes of water, we show several reference energy consumptions for comparison in Figure 1A. For example, the potential hydrogen energy that could be generated from just one average industrial wastewater site is greater than the annual energy consumed by all the vehicles in the United States combined.
Figure 1.

(A) The potential H2 energy that can be harvested via water electrolysis using various source waters assuming a water recovery of 50% and an H2 conversion efficiency of 40%. The horizontal dashed lines show several relevant energy consumptions to serve as reference values for contextualizing the amount of H2 energy that can be harvested. (B) The contribution of water purification to the total energy consumption (orange bars) and cost (blue bars) of the overall water electrolysis process among various source waters. For the cost and energy calculation of water electrolysis, we assume a hydrogen production rate of 7.85 × 10⁵ kg-H2 yr–1 and no carbon tax.
For the purpose of producing hydrogen for energy storage using electrolysis, we must consider that both the electrolysis process and the required feedwater treatment consume energy. However, it is critical to note that the electrolysis process consumes significantly more energy than the water treatment step. We note that the energy consumption of water treatment is assumed to be solely based on the RO desalination step—which is the most energy-intensive part of the water treatment process—with further details on the calculations provided in the Supporting Information (Text S1). In accordance with the energy consumption, the cost of water treatment (i.e., cost of electricity and ion exchange resins) is also negligible compared to the cost of the water electrolysis process (see Supporting Information, Text S2, for details on cost estimation of water treatment and water electrolysis). In Figure 1B, we show the percentage contribution of the water treatment step to the energy consumption and cost of the overall electrolysis process. Even in the case of purifying seawater, which is generally considered an energy-intensive process,26 the contribution of the water treatment step is less than 0.3% of the total energy consumption. When assessed in terms of cost, the contribution is even more minor (<0.046%), as the capital cost of electrolyzers greatly outweighs that of water purification equipment (e.g., membrane module). Hence, Figure 1B implies that the use of nontraditional source waters is both economically and energetically viable.
Economic and Environmental Benefits of Distributed Water Electrolysis
Distributed water sources offer the opportunity for hydrogen production through decentralized, small-scale electrolyzers rather than through a large centralized production plant, as has been the standard for many hydrogen production facilities.36 Decentralized hydrogen production would enable collocation of small-scale plants close to the hydrogen point of use, minimizing hydrogen transport. Since hydrogen transportation plays a key role in the economic feasibility and environmental impact of hydrogen production, we evaluate the influence of plant size and transportation distance on hydrogen production cost and CO2 emissions using techno-economic analysis (TEA) and life cycle assessment (LCA).
The impact of production plant size is estimated by modeling the water purification and electrolysis processes over a range of representative hydrogen production volumes, from neighborhood-scale to industrial scale. The levelized cost of the hydrogen produced is calculated based on economic and mass flow modeling. To represent an increased service area as the plant size increases, the transportation distance increases linearly with the square root of plant size, where the hydrogen use rate per unit area remains constant (Supporting Information, eq S22). Renewable electricity is used to power the system. The electrolyzer technology used in this work is a pressurized polymer electrolyte membrane (PEM) electrolyzer, and the water purification technology used is RO followed by an ion exchange polishing process.
The LCA uses a cradle-to-gate system boundary and a functional unit of 1 kg-H2 delivered. The produced hydrogen is transported in diesel-powered tube trailers, and costs associated with CO2 emissions are calculated using carbon tax values from the World Bank. Detailed assumptions, equations, and parameters used for the TEA as well as life cycle inventory data can be found in the Supporting Information (Texts S2 and S3). The results of this analysis represent typical values based on the assumptions described in the Supporting Information; results such as the optimal plant size will vary based on specific geographic cases. We note that the levelized cost of hydrogen (LCOH) obtained in this work is higher than that of conventional fossil fuel-based hydrogen production, although cost competitiveness can be achieved through electrolyzer technology development, renewable electricity cost reductions, and strict environmental policies.
The impact of hydrogen production scale on the LCOH is shown in Figure 2. Hydrogen is least expensive to produce at scales on the order of 105 kg per year. At smaller scales, hydrogen is more expensive to produce due to the increase in equipment costs relative to their throughput rate, which is the inverse of the benefit of returns to scale. At larger production volumes, the transportation distance increases, which causes an increase in price. Additionally, accounting for the influence of a carbon tax results in a further price increase, since a significant amount of CO2 is produced by the trucks used to transport hydrogen.
Figure 2.
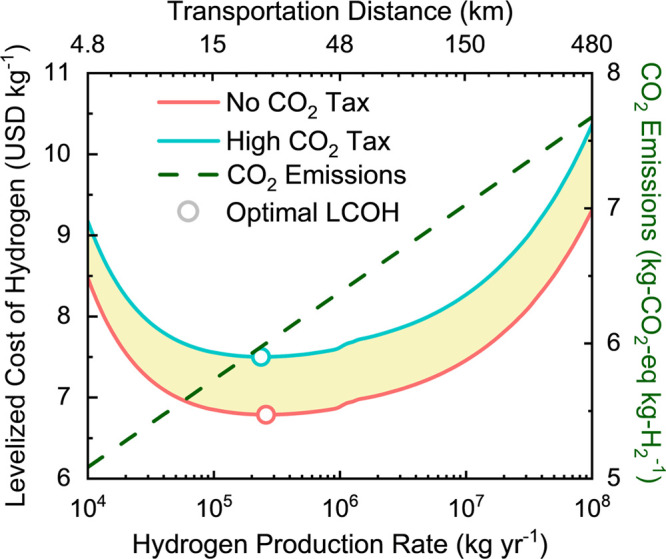
Levelized cost of hydrogen (LCOH) including taxes due to CO2 (left axis) and CO2 emissions (right axis) as a function of hydrogen production rate. The top axis represents the transportation distance associated with the corresponding hydrogen production rate on the bottom axis. The red line represents the LCOH with no CO2 tax, and the blue line corresponds to the LCOH with the highest current CO2 tax price according to the World Bank, found in Sweden. The shaded region bounded by these two curves corresponds to the range of possible LCOH values depending on the CO2 tax price. The circles correspond to the minimum LCOH for each scenario. The dashed green line shows the CO2 emissions from hydrogen production including transportation in a diesel-fueled tube trailer.
Figure 2 shows that including the cost of CO2 emissions using a carbon tax raises the overall LCOH across all production volumes, since CO2 is produced throughout the life cycle even when renewable energy is used. The CO2 tax contribution to the overall cost is smaller at lower production volumes as the transportation distance is shorter, approximately 0.70 USD per kg-H2, and increases (>1 USD per kg-H2) as the production volume grows. The effect of these taxes would be even greater if the CO2 production increased due to the use of nonrenewable energy or more inefficient transport. Since the high CO2 tax scenario uses the highest CO2 tax in the world according to the World Bank, implementation of current CO2 tax rates in other countries or states would result in an LCOH within the shaded region on the figure.
The CO2 emissions associated with hydrogen production are also shown in Figure 2 for varying transportation distances. Green hydrogen production and distribution result in CO2 emissions between 5.1 and 7.7 kg-CO2-eq kg-H2–1. As transportation distance increases, CO2 emissions also increase due to the additional diesel fuel required to transport hydrogen to the point of use.37 The costs due to CO2 taxes used in the TEA are based on these CO2 emissions calculations. The increase in the LCOH due to CO2 emissions considering the high CO2 tax ranges from approximately 7.6% to 10.2% relative to the no tax scenario.
The minimum LCOH is attained for small-to-moderate plant sizes, demonstrating the benefit of a decentralized approach to hydrogen production. The benefit of decentralized production is further intensified by carbon taxes, albeit to a relatively minor extent. For example, imposing a high carbon tax reduces the optimal production rate from 2.59 × 10⁵ kg-H2 per year to 2.36 × 10⁵ kg-H2 per year. The transportation distances for these optimal LCOH points are 24.6 km and 23.5 km for the no CO2 tax and high CO2 tax scenarios, respectively. We note that the optimal LCOH is not at the minimum transport distance, despite this being the point with the minimum transport and carbon tax costs, due to the economies of scale associated with increasing plant size. However, this analysis does not consider potential capital cost reductions from the mass production of smaller electrolyzers, which is a likely consequence of increased adoption of decentralized production. Hence, it is possible that the optimal size of the plant may even be smaller once these returns to production scale are considered.
The breakdown of costs at the optimal LCOH for both tax scenarios is shown in Figure 3A. The levelized cost is dominated by the electricity used for electrolysis, making up greater than two-thirds of the overall cost. The CO2 taxes contribute almost as much to cost as the annualized capital costs. Increasing production scale would increase the transportation distance, which in turn increases the CO2 emissions and therefore the carbon taxes, further demonstrating the importance of small scale for minimizing costs. Note that contributions of the RO plant to capital cost and energy are too small to be visible on the chart.
Figure 3.

(A) A breakdown of the relative contributions to cost for hydrogen production at the minimum levelized cost of hydrogen for both the “No CO2 Tax” and “High CO2 Tax” scenarios. Note that the RO energy consumption and RO plant CapEx are too small to be observed in the chart. (B) Contributions to CO2 emissions associated with supplying green H2, including H2 production (1 MW PEM WE stack, PEM WE balance of plant (BOP), water, and electricity for PEM WE), storage, and transportation (40.23 km). The contributions for PEM WE stack, PEM WE BOP, and water (collectively represented as the small green section of the large pie chart, left) are enlarged to show the detailed contributions in the smaller pie chart on the right. The functional unit is 1 kg-H2, and the system boundary is cradle-to-gate. The electricity for PEM electrolysis is 50% solar photovoltaic-based and 50% onshore wind-based. The CO2 equivalent mass (kg-CO2-eq ) is calculated by multiplying the weight of the greenhouse gas (e.g., methane, nitrous oxide) emitted during green H2 production and distribution by the global warming potential of the gas. The carbon intensity of green H2 distribution for this transportation distance is 5.28 kg-CO2-eq kg-H2–1.
Figure 3B shows the contributions to CO2 emissions from electrolysis, hydrogen storage (pressurization to 350 bar), and transportation for a sample data point with a hydrogen transportation distance of 40.23 km (details in Supporting Information, Tables S1 and S2). For this distance, hydrogen transportation is the largest contributor to the environmental impact (52.2%), followed by electricity for electrolysis.37 As the transportation distance increases, the fraction of the total CO2 emissions contributed by transportation continues to increase, since the absolute CO2 emissions increase linearly with transportation distance. Water purification for hydrogen production makes up only 0.3% of the total CO2 emissions, indicating that the contribution of water purification to CO2 emissions for the overall green hydrogen production process is insignificant.
Synergizing Water, Energy, and Hydrogen Economies
Transportation contributes significantly more to the overall economic costs and CO2 emissions associated with H2 production than water treatment, regardless of water source. The potential to advance the economic feasibility of a low-carbon hydrogen economy by minimizing H2 transportation–which also avoids the practical complexities of establishing a hydrogen distribution network–suggests the favorability of on-site green hydrogen production. This opportunity is reinforced by the low returns to scale for water electrolysis. In addition to avoiding H2 transportation inefficiencies, point-of-use electrolysis could utilize local renewable energy sources, eluding challenges associated with transitioning to a renewable energy grid and minimizing energy losses that occur over long-distance transmission.38 Since our analysis reveals that various nontraditional water sources may be pretreated for use in water electrolysis with negligible impact on the overall H2 production energy, cost, and CO2 emissions, we exemplify opportunities for near-point-of-use water electrolysis utilizing local nontraditional water sources and renewable energy for H2 energy storage and chemical feedstock applications.
To facilitate the use of local or stranded intermittent renewable energy sources to power stationary industrial processes, hydrogen may be used to provide energy storage. Hydrogen energy storage may be particularly expedient for industrial processes that require continuous energy supply over long or frequent gaps in renewable energy availability, which are challenging to manage using batteries due to their limited ability to provide power over a prolonged time period. This energy storage strategy may be most immediately applicable to processes dedicated to water purification. For example, an RO desalination plant powered by solar or wind energy with short-term battery storage may divert a proportion of treated water to water electrolysis during peak energy availability, as illustrated in Figure 4A. When energy harvesting declines, stored H2 can be used to bridge long or frequent gaps in energy source availability. This scheme capitalizes upon local renewable energy sources and local seawater or brackish groundwater to achieve low-carbon water purification. Similar approaches could be employed for various industrial processes that require continuous energy supplies, where H2 could provide electrical power via fuel cells or thermal energy via combustion. These stationary energy storage solutions could facilitate the societal transition to low-carbon energy, ensuring reliable power supplies for industrial processes before grid-level renewable energy supply and storage can be achieved.
Figure 4.

Schematic of synergistic opportunities for near-point-of-use distributed water purification and H2 production. Representative opportunities illustrate utilization of local sources of renewable energy and water to produce H2 for energy storage (left) and chemical feedstock (right) applications. (A) Reverse osmosis (RO) desalination plants may fully transition to renewable power by redirecting a fraction of permeate to water electrolysis (WE), enabling long-term energy storage for continuous operation at times when renewable energy sources such as solar and wind are not available. (B) Household greywater and municipal wastewater from wastewater treatment plants (WWTP) may be treated to feed small-scale WE and produce H2 for refueling stations, supporting a hydrogen economy while minimizing CO2 emissions associated with long-distance H2 transportation. (C) Onsite green H2 production for chemical synthesis processes can utilize nearby municipal and industrial wastewater (WW) as well as stranded renewable energy. (D) Treatment of produced water and WW from oil and gas or other industrial sources for WE may be combined with CO2 capture from the same point sources, enabling conversion of CO2 with H2 to produce chemicals and fuels. This scheme accomplishes carbon-neutral storage of renewable energy while utilizing waste CO2 and water.
Since transportation accounts for the largest source of total greenhouse gas emissions in the United States at 27%,39 electric vehicles powered by hydrogen fuel cells have been suggested as a potential solution to reduce reliance on fossil fuels, especially for heavy duty vehicles and fleet vehicles that return to the same place for refueling.2 Adoption of hydrogen-fueled vehicles requires a robust and convenient network of refueling stations.40 However, supplying hydrogen to widely distributed refueling stations from centralized production facilities introduces substantial additional costs and CO2 emissions due to H2 transportation. Alternatively, neighborhood-level water electrolyzers could supply refueling stations to minimize H2 transportation costs (Figure 4B). Local municipal wastewater could be treated for production of H2 to supply local refueling stations, and local renewable energy sources could power the electrolyzers without the need for long-distance transmission. On an even smaller scale, rooftop solar energy and household greywater could be diverted to generate H2, which could be used both for household energy storage to promote energy independence and for vehicle refueling. Due to the return to scale benefits for water treatment, though, mining domestic wastewater for local hydrogen fuel production likely would be more feasible at the scale of a neighborhood or municipality rather than at the household level.
While hydrogen energy storage may catalyze a future transition to a low-carbon society, significant opportunities for decarbonization exist based on replacing fossil fuel-based H2 in chemical industrial processes such as petrochemical refining, ammonia fertilizer synthesis, methanol synthesis, or Fischer–Tropsch synthesis with green hydrogen. Currently, global demand for hydrogen as a feedstock in chemical industrial processes is 51 Mt-H2 yr–1, where 90% of this demand is for ammonia and methanol synthesis.1 Replacing H2 derived from natural gas with green H2 could abate the significant CO2 emissions associated with these processes, around 9 kg-CO2-eq kg-H2–1.41,42 Furthermore, production of ammonia or methanol using green H2 could enable these products to serve as sustainable nonfossil fuel-based liquid fuels. As public and private stakeholders architect strategies to decarbonize H2 for the chemical industry, exploitation of nontraditional water sources for electrolysis may provide opportunities to minimize H2 transportation and renewable energy transmission inefficiencies, while promoting sustainable circular resource economies.
In the United States, a majority of petrochemical and ammonia plants are located in the West Central and South Central regions of the country, such as in Louisiana and Texas.43−45 Similarly, substantial current and planned wind energy resources exist in the West Central region, and current and planned solar energy projects are located in the South Central region.46 These areas of the country also produce significant volumes of wastewater from industrial and municipal activities, as evidenced by their high density of wastewater treatment plants.47,48 The convergence of renewable energy sources, wastewater sources, and chemical manufacturing in these locations suggests that local water electrolyzers could synergize these resource economies while minimizing H2 transportation and energy transmission losses (Figure 4C). Especially in land-locked locations in the Central United States, harnessing nontraditional water sources to feed electrolyzers could provide the missing link to utilizing stranded wind energy for decarbonization of chemical manufacturing.
Beyond H2 chemical feedstock demands in traditional chemical industries, expanded green hydrogen production from nontraditional water sources could promote future opportunities for CO2 utilization strategies that hinge upon the availability of green H2. For example, oil and gas activities produce significant amounts of waste CO2 from refining and methane flares,49 while also producing large amounts of contaminated wastewaters from extraction activities such as hydraulic fracturing and enhanced oil recovery.50,51 Given the relatively low contribution of treating geologic produced water and industrial wastewaters to the total energy and costs of water electrolysis (Table 1 and Figure 1) and the relatively high contribution of H2 transport to the overall costs and process CO2 emissions (Figure 3), wastewaters produced by oil and gas could be mined for H2 to enable CO2 utilization (Figure 4D). For example, CO2 may be converted with H2 into valuable products such as methanol for chemicals and fuels.52 Creation of these value streams from waste CO2 and industrial wastewater may motivate repurposing of industrial waste streams to promote sustainable resource economies. While future chemical manufacturing may eventually utilize renewable resources rather than fossil fuel feedstocks, the CO2 emissions associated with current fossil fuel production may be partially mitigated by interim CO2 utilization solutions enabled by greater availability of green hydrogen.
Challenges and Opportunities
Achieving low-carbon energy storage and chemicals manufacturing will require abundant availability of green H2. As we demonstrate above, minimizing H2 transportation can substantially reduce the overall costs and CO2 emissions for green H2 supply. Near-point-of-use water electrolysis can achieve these reductions and may be advantageous due to the lack of returns to scale for electrolyzers. Since small-scale H2 production will require local sources of pure water, we identify opportunities to utilize nontraditional water sources for water electrolysis, where the additional energy and costs to treat these waters for electrolysis account for less than 0.3% and 0.05% of the total energy and cost for electrolysis, respectively (Figure 1B). In addition to advancing decarbonization via green H2, mining waste and nontraditional water sources for valuable hydrogen creates opportunities for bolstering water security and reducing environmental contamination. In particular, local treatment and reuse of nontraditional water sources can facilitate achievement of a circular water economy and pipe parity.20
A distributed hydrogen economy (15–40 km between production and end use sites, according to Figure 2) minimizes economic costs and CO2 emissions. Decentralized hydrogen generation introduces several practical challenges, though. Onsite production may entail greater safety concerns and require more extensive training of personnel compared to onsite storage of hydrogen produced at central generation facilities. However, onsite generation will also enable lower volumes and pressures for hydrogen storage, reducing explosion hazards and improving safety. Near-point-of-use hydrogen generation (e.g., at an industrial site or serving a neighborhood) would likely be favored over very small-scale electrolysis (e.g., household level), due to the need for trained personnel and safety concerns as well as favorable cost profiles for midrange electrolyzers capable of producing ∼5 × 10⁵ kg-H2 yr–1. In the future, more widespread familiarity with hydrogen handling and technology improvements leading to greater ease of use for electrolyzers may encourage greater adoption of near-point-of-use water electrolysis.
While H2 provides long-term storage of renewable energy for applications that are not amenable to battery storage, it is unlikely to replace batteries for short-term and light duty or stationary energy storage. Growing renewable energy storage needs may be challenging to meet using batteries alone due to limited materials availability, battery lifetime limitations, and recyclability challenges.53 PEM electrolyzers and fuel cells also rely upon scarce materials for precious metal electrocatalysts and advanced materials for membranes.54 Employing short-term battery storage to supply stable electricity to electrolyzers could enable other electrolyzer types that do not require precious metal electrocatalysts to be employed for hydrogen production, including alkaline water electrolysis, high-temperature solid oxide water electrolysis, and anion exchange membrane water electrolysis. For example, anion exchange membrane water electrolyzers have the combined benefits of the versatility and high performance of PEM electrolyzers (i.e., operation at higher current density due to the lower ohmic resistance and improved safety with a nonporous polymeric membrane) and the low cost of alkaline water electrolyzers, but significant research and development is needed before anion exchange membrane electrolysis can be commercialized. Growth in water electrolysis and fuel cell industries at any scale will require further advancements to lower precious metal loadings and electrolyzer materials costs.
As climate change exacerbates extreme weather events that lead to volatility in energy reliability, enhanced distributed energy storage can build resilience into energy infrastructure. Decentralized hydrogen generation provides opportunities to promote energy security through infrastructure that is resilient to grid-level outages as well as unpredictability in oil supply and prices. Since hydrogen energy is intimately linked to water availability, such energy resilience relies upon resilience in water infrastructure. Especially during crises or in resource-limited areas where the energy supply is unreliable, potable water may also be scarce. These challenges highlight additional advantages of sourcing nontraditional waters for hydrogen generation: using nonpotable water sources to make hydrogen can potentially mitigate this water-energy trade-off by avoiding competition with drinking water sources.
Significant challenges remain to reduce the costs of green hydrogen production. Even as technologies improve, the road to a green hydrogen economy will involve many technical, political, and social hurdles. The development of models to determine the optimal hydrogen production plant size based on case study parameters including geography, population density, energy use density, transportation networks, and availability of water sources will be valuable for designing efficient distributed hydrogen infrastructure. Since electricity price accounts for about 70–80% of the green hydrogen production cost, future reductions in the price of renewable electricity would significantly improve the economic feasibility of green hydrogen production.55 The capital investments and barriers to entry for small-scale water electrolyzers are lower than those for new large-scale, centralized green hydrogen production plants.56 Adoption of small-scale, near-point-of-use water electrolyzers for distributed hydrogen production therefore may ease the transition toward broader implementation and promote learning-by-doing. Development of a more robust decentralized hydrogen economy, enabled by utilization of nontraditional water sources, will in turn facilitate the transition to renewable and circular economies for both energy and water.
Acknowledgments
This work was supported by the NSF Nanosystems Engineering Research Center for Nanotechnology-Enabled Water Treatment (EEC-1449500) and the National Alliance for Water Innovation (NAWI), funded by the U.S. Department of Energy, Office of Energy Efficiency and Renewable Energy (EERE), Advanced Manufacturing Office, under Funding Opportunity Announcement Number DE-FOA-0001905 through a subcontract to Yale University. N.J.C. acknowledges the eFellows Postdoctoral Fellowship from the American Society for Engineering Education (through NSF Grant Number EEC-2127509).
Biography

Lea Winter is an Assistant Professor in the Department of Chemical and Environmental Engineering at Yale University. She received her B.S. in Chemical Engineering from Yale in 2015 and Ph.D. in Chemical Engineering from Columbia University as an NSF Graduate Research Fellow in 2020. She received postdoc training as a Nanotechnology Enabled Water Treatment (NEWT) Distinguished Postdoctoral Fellow at Yale in 2020–2022. Her research focuses on electrified processes at the food, energy, water, and climate nexus, including development of sustainable and circularized processes for conversion of CO2 to chemicals and fuels, green nitrogen fixation to fertilizers and nitrogen-based fuels, and transformation of contaminants in wastewater into useful products while recovering fit-for-purpose water. Dr. Winter’s research utilizes plasma and electrochemistry to activate chemical reactions while integrating design of earth-abundant catalysts and sustainable materials to selectively control chemical transformation pathways. She is the recipient of the 2022 Caltech Young Investigator Lecture Series Award, 2019 North American Catalysis Society Kokes Award, and 2018 Columbia Engineering Grossman Scholarship.
Supporting Information Available
The Supporting Information is available free of charge at https://pubs.acs.org/doi/10.1021/acs.est.2c02439.
Energy consumption and cost calculations for water treatment; techno-economic analysis methods, parameters, and equations; and life cycle analysis methods and parameters (PDF)
Author Contributions
# L.R.W. and N.J.C. contributed equally.
The contents of this work are solely the responsibility of the authors and do not necessarily represent the official views of the Awardee, Subawardee, or the NSF.
The authors declare no competing financial interest.
Supplementary Material
References
- IEA . Global Hydrogen Review 2021; International Energy Agency: Paris, 2021; 10.1787/39351842-en. [DOI]
- Kempler P. A.; Slack J. J.; Baker A. M.; James J. Research Priorities for Seasonal Energy Storage Using Electrolyzers and Fuel Cells. Joule 2022, 6, 280. 10.1016/j.joule.2021.12.020. [DOI] [Google Scholar]
- Nitta N.; Wu F.; Lee J. T.; Yushin G. Li-Ion Battery Materials: Present and Future. Mater. Today 2015, 18, 252–264. 10.1016/j.mattod.2014.10.040. [DOI] [Google Scholar]
- Viswanathan V.; Epstein A. H.; Chiang Y.-M.; Takeuchi E.; Bradley M.; Langford J.; Winter M. The Challenges and Opportunities of Battery-Powered Flight. Nature 2022, 601 (7894), 519–525. 10.1038/s41586-021-04139-1. [DOI] [PubMed] [Google Scholar]
- Mazloomi K.; Gomes C. Hydrogen as an Energy Carrier: Prospects and Challenges. Renew. Sustain. Energy Rev. 2012, 16 (5), 3024–3033. 10.1016/j.rser.2012.02.028. [DOI] [Google Scholar]
- Ball M.; Wietschel M. The Future of Hydrogen - Opportunities and Challenges. Int. J. Hydrogen Energy 2009, 34 (2), 615–627. 10.1016/j.ijhydene.2008.11.014. [DOI] [Google Scholar]
- Turner J. A. A Realizable Renewable Energy Future. Science (80-.) 1999, 285, 687–689. 10.1126/science.285.5428.687. [DOI] [PubMed] [Google Scholar]
- Lazard . Lazard’s Levelised Cost of Energy Analysis; 2019; Vol. Version 13.
- Reese M.; Marquart C.; Malmali M.; Wagner K.; Buchanan E.; McCormick A.; Cussler E. L. Performance of a Small-Scale Haber Process. Ind. Eng. Chem. Res. 2016, 55, 3742–3750. 10.1021/acs.iecr.5b04909. [DOI] [Google Scholar]
- Khatun S.; Hirani H.; Roy P. Seawater Electrocatalysis: Activity and Selectivity. J. Mater. Chem. A 2021, 9 (1), 74–86. 10.1039/D0TA08709B. [DOI] [Google Scholar]
- Dingenen F.; Verbruggen S. W. Tapping Hydrogen Fuel from the Ocean: A Review on Photocatalytic, Photoelectrochemical and Electrolytic Splitting of Seawater. Renew. Sustain. Energy Rev. 2021, 142 (February), 110866. 10.1016/j.rser.2021.110866. [DOI] [Google Scholar]
- Tong W.; Forster M.; Dionigi F.; Dresp S.; Sadeghi Erami R.; Strasser P.; Cowan A. J.; Farràs P. Electrolysis of Low-Grade and Saline Surface Water. Nat. Energy 2020, 5 (5), 367–377. 10.1038/s41560-020-0550-8. [DOI] [Google Scholar]
- Wang H. Y.; Weng C. C.; Ren J. T.; Yuan Z. Y. An Overview and Recent Advances in Electrocatalysts for Direct Seawater Splitting. Front. Chem. Sci. Eng. 2021, 15 (6), 1408–1426. 10.1007/s11705-021-2102-6. [DOI] [Google Scholar]
- Hausmann J. N.; Schlögl R.; Menezes P. W.; Driess M. Is Direct Seawater Splitting Economically Meaningful?. Energy Environ. Sci. 2021, 14 (7), 3679–3685. 10.1039/D0EE03659E. [DOI] [Google Scholar]
- Dresp S.; Klingenhof M.; Strasser P.; Dionigi F. Direct Electrolytic Splitting of Seawater: Opportunities and Challenges. ACS Energy Lett. 2019, 4, 933–942. 10.1021/acsenergylett.9b00220. [DOI] [Google Scholar]
- Khan M. A.; Al-Attas T.; Roy S.; Rahman M. M.; Ghaffour N.; Thangadurai V.; Larter S.; Hu J.; Ajayan P. M.; Kibria M. G. Seawater Electrolysis for Hydrogen Production: A Solution Looking for a Problem?. Energy Environ. Sci. 2021, 14 (9), 4831–4839. 10.1039/D1EE00870F. [DOI] [Google Scholar]
- Beswick R. R.; Oliveira A. M.; Yan Y. Does the Green Hydrogen Economy Have a Water Problem?. ACS Energy Lett. 2021, 6 (9), 3167–3169. 10.1021/acsenergylett.1c01375. [DOI] [Google Scholar]
- Barbir F. PEM Electrolysis for Production of Hydrogen from Renewable Energy Sources. Sol. Energy 2005, 78 (5), 661–669. 10.1016/j.solener.2004.09.003. [DOI] [Google Scholar]
- Sathre R.; Breunig H.; Greenblatt J.; Larsen P.; Masanet E.; McKone T.; Quinn N.; Scown C. Spatially-Explicit Water Balance Implications of Carbon Capture and Sequestration. Environ. Model. Softw. 2016, 75, 153–162. 10.1016/j.envsoft.2015.10.011. [DOI] [Google Scholar]
- Sedlak D.; Mauter M.; Macknick J.; Stokes-draut J.; Fiske P.; Breckenridge R.; Childress A.; Jiang S.; Katz L.; Stoll Z.. NAWI Master Technology Roadmap; DOE/GO-102021-5617; National Alliance for Water Innovation: 2021; 10.2172/1818076. [DOI]
- IEA . The Future of Hydrogen; OECD: International Energy Agency: Paris, 2019.
- Acar C.; Dincer I.. 4.24 Hydrogen Energy Conversion Systems. In Comprehensive Energy Systems; Elsevier: 2018; pp 947–984, 10.1016/B978-0-12-809597-3.00441-7. [DOI] [Google Scholar]
- Harrison K. W.; Remick R.; Martin G. D.. Hydrogen Production: Fundamentals and Case Study Summaries. In 18th World Hydrogen Energy Conference; Essen, Germany, 2010.
- Fickett A. P.Fuel Cells for Electric Utility Power Generation. In Advances in Energy Systems and Technology; Auer P. L., Douglas D., Eds.; Academic Press: 1986; pp 1–73, 10.1016/B978-0-12-014905-6.50004-6. [DOI] [Google Scholar]
- Mitsushima S.; Gollas B.; Hacker V.. Chapter 1 - Introduction. In Fuel Cells and Hydrogen; Hacker V., Mitsushima S., Eds.; Elsevier: 2018; pp 1–13, 10.1016/B978-0-12-811459-9.00001-3. [DOI] [Google Scholar]
- Elimelech M.; Phillip W. A. The Future of Seawater Desalination: Energy, Technology, and the Environment. Science (80-.) 2011, 333 (6043), 712–717. 10.1126/science.1200488. [DOI] [PubMed] [Google Scholar]
- Mickley M.Updated and Extended Survey of U.S. Municipal Desalination Plants; DWPR Report No. 207; US DOI Bureau of Reclamation: Denver, 2018.
- Voutchkov N.Desalination - Past, Present and Future. International Water Association. https://iwa-network.org/desalination-past-present-future/ (accessed 2022-04-01).
- U.S. Environmental Protection Agency . How We Use Water. WaterSense. https://www.epa.gov/watersense/how-we-use-water (accessed 2022-04-01).
- Seiple T. E.; Coleman A. M.; Skaggs R. L. Municipal Wastewater Sludge as a Sustainable Bioresource in the United States. J. Environ. Manage. 2017, 197, 673–680. 10.1016/j.jenvman.2017.04.032. [DOI] [PubMed] [Google Scholar]
- Maupin M.Summary of Estimated Water Use in the United States in 2015; Fact Sheet 2018-3035; U.S. Geological Survey: Reston, VA, 2018; 10.3133/fs20183035. [DOI]
- Civil Engineering Research Foundation . Clean Technologies in U.S. Industries: Focus on Textiles; United States-Asia Environmental Partnership: Reston, VA, 1997.
- Miller S. A.; Horvath A.; Monteiro P. J. M. Impacts of Booming Concrete Production on Water Resources Worldwide. Nat. Sustain. 2018, 1 (1), 69–76. 10.1038/s41893-017-0009-5. [DOI] [Google Scholar]
- Baskaran A.Waste Not Want Not - Water Use in the Semiconductor Industry. Sustainalytics. https://www.sustainalytics.com/esg-research/resource/investors-esg-blog/waste-not-want-not-water-use-in-the-semiconductor-industry (accessed 2022-04-01).
- U.S. Geological Survey . How is Brackish Groundwater Being Used. USGS. https://water.usgs.gov/ogw/gwrp/brackishgw/use.html (accessed 2022-04-01).
- Ayers K.; Danilovic N.; Ouimet R.; Carmo M.; Pivovar B.; Bornstein M. Perspectives on Low-Temperature Electrolysis and Potential for Renewable Hydrogen at Scale. Annu. Rev. Chem. Biomol. Eng. 2019, 10 (1), 219–239. 10.1146/annurev-chembioeng-060718-030241. [DOI] [PubMed] [Google Scholar]
- Wulf C.; Reuß M.; Grube T.; Zapp P.; Robinius M.; Hake J.-F.; Stolten D. Life Cycle Assessment of Hydrogen Transport and Distribution Options. J. Clean. Prod. 2018, 199, 431–443. 10.1016/j.jclepro.2018.07.180. [DOI] [Google Scholar]
- Fitiwi D. Z.; Olmos L.; Rivier M.; de Cuadra F.; Pérez-Arriaga I. J. Finding a Representative Network Losses Model for Large-Scale Transmission Expansion Planning with Renewable Energy Sources. Energy 2016, 101, 343–358. 10.1016/j.energy.2016.02.015. [DOI] [Google Scholar]
- U.S. Environmental Protection Agency . Sources of Greenhouse Gas Emissions; Greenhouse Gas Emissions. https://www.epa.gov/ghgemissions/sources-greenhouse-gas-emissions (accessed 2022-04-01).
- Rose P. K.; Neumann F. Hydrogen Refueling Station Networks for Heavy-Duty Vehicles in Future Power Systems. Transp. Res. Part D Transp. Environ. 2020, 83, 102358. 10.1016/j.trd.2020.102358. [DOI] [Google Scholar]
- Spath P. L.; Mann M. K.. Life Cycle Assessment of Hydrogen Production via Natural Gas Steam Reforming; Golden, CO, United States, 2001; 10.2172/764485. [DOI]
- Sun P.; Young B.; Elgowainy A.; Lu Z.; Wang M.; Morelli B.; Hawkins T. Criteria Air Pollutants and Greenhouse Gas Emissions from Hydrogen Production in U.S. Steam Methane Reforming Facilities. Environ. Sci. Technol. 2019, 53, 7103–7113. 10.1021/acs.est.8b06197. [DOI] [PubMed] [Google Scholar]
- U.S. EPA . Chapter 8: Inorganic Chemical Industry. In AP-42, Fifth ed. Compilation of Air Pollutant Emissions Factors, Vol. 1: Stationary Point and Area Sources; 2009; pp 8.1–1. [Google Scholar]
- Fernández L.Ammonia Plant Production Capacity in the United States in 2019, by Facility. Statista. https://www.statista.com/statistics/1266392/ammonia-plant-capacities-united-states/ (accessed 2022-04-01).
- U.S. Energy Information Administration . Refinery Capacity Report; U.S. Department of Energy: Washington, DC, 2021.
- U.S. Energy Information Administration . Where Wind Power Is Harnessed. Wind Explained. https://www.eia.gov/energyexplained/wind/where-wind-power-is-harnessed.php (accessed 2022-04-01).
- Resource Watch . 2020 U.S. Sewage Facilities by Compliance Status. Wastewater Treatment Plants (U.S.). https://resourcewatch.org/data/explore/wat026rw1-Wastewater-Treatment-Plants-US (accessed 2022-04-01).
- U.S. Environmental Protection Agency . EPA Facility Registry Service: Wastewater Treatment Plants. https://edg.epa.gov/metadata/catalog/search/resource/details.page?uuid=%7B85D9302D-8216-44B0-A712-B65D0C328C2F%7D (accessed 2022-04-01).
- IEA . Methane Tracker 2020; International Energy Agency: Paris, 2020.
- Benko K. L.; Drewes J. E. Produced Water in the Western United States: Geographical Distribution, Occurrence, and Composition. Environ. Eng. Sci. 2008, 25 (2), 239–246. 10.1089/ees.2007.0026. [DOI] [Google Scholar]
- Zhang L.; Hascakir B. A Review of Issues, Characteristics, and Management for Wastewater Due to Hydraulic Fracturing in the U.S. J. Pet. Sci. Eng. 2021, 202, 108536. 10.1016/j.petrol.2021.108536. [DOI] [Google Scholar]
- Porosoff M. D.; Yan B.; Chen J. G. Catalytic Reduction of CO2 by H2 for Synthesis of CO, Methanol and Hydrocarbons: Challenges and Opportunities. Energy Environ. Sci. 2016, 9, 62–73. 10.1039/C5EE02657A. [DOI] [Google Scholar]
- Abraham K. M. Prospects and Limits of Energy Storage in Batteries. J. Phys. Chem. Lett. 2015, 6 (5), 830–844. 10.1021/jz5026273. [DOI] [PubMed] [Google Scholar]
- Badgett A.; Ruth M.; James B.; Pivovar B. Methods Identifying Cost Reduction Potential for Water Electrolysis Systems. Curr. Opin. Chem. Eng. 2021, 33, 100714. 10.1016/j.coche.2021.100714. [DOI] [Google Scholar]
- Mayyas A.; Ruth M.; Pivovar B.; Bender G.; Wipke K.. Manufacturing Cost Analysis for Proton Exchange Membrane Water Electrolyzers; NREL/TP-6A20-72740; Golden, CO, United States, 2018; 10.2172/1557965 [DOI]
- McAfee R. P.; Mialon H. M.; Williams M. A. What Is a Barrier to Entry?. Am. Econ. Rev. 2004, 94 (2), 461–465. 10.1257/0002828041302235. [DOI] [Google Scholar]
Associated Data
This section collects any data citations, data availability statements, or supplementary materials included in this article.