

Abstract
Sensory substitution devices (SSDs) such as the ‘vOICe’ preserve visual information in sound by turning visual height, brightness, and laterality into auditory pitch, volume, and panning/time respectively. However, users have difficulty identifying or tracking multiple simultaneously presented tones – a skill necessary to discriminate the upper and lower edges of object shapes. We explore how these deficits can be addressed by using image-sonifications inspired by auditory scene analysis (ASA). Here, sighted subjects (N=25) of varying musical experience listened to, and then reconstructed, complex shapes consisting of simultaneously presented upper and lower lines. Complex shapes were sonified using the vOICe, with either the upper and lower lines varying only in pitch (i.e. the vOICe’s ‘unaltered’ default settings), or with one line degraded to alter its auditory timbre or volume. Results found that overall performance increased with subjects’ years of prior musical experience. ANOVAs revealed that both sonification style and musical experience significantly affected performance, but with no interaction effect between them. Compared to the vOICe’s ‘unaltered’ pitch-height mapping, subjects had significantly better image-reconstruction abilities when the lower line was altered via timbre or volume-modulation. By contrast, altering the upper line only helped users identify the unaltered lower line. In conclusion, adding ASA principles to vision-to-audio SSDs boosts subjects’ image-reconstruction abilities, even if this also reduces total task-relevant information. Future SSDs should seek to exploit these findings to enhance both novice user abilities and the use of SSDs as visual rehabilitation tools.
I. Introduction
Sensory substitution devices (SSDs) are a form of assistive technology that can convert the visual features of images into abstract patterns of auditory or tactile stimulation, allowing this visual information to remain accessible to the blind. For example, the ‘vOICe’ (1992, seeingwithsound.com) converts a greyscale image into electronic tones once per second by turning visual height, brightness, and laterality into auditory pitch, volume, and panning/time respectively [1] (Figure 1, top image). From this, sonifying a  -shape would produce a high-pitched tone that rapidly descends and then ascends in pitch, travelling from left to right. This approach accurately preserves a high level of visual detail in sound as illustrated using spectrograms (Figure 1, bottom image), allowing users to mentally reconstruct the image, and use this information to interact with the visual world [2]. By conveying the rules that govern vision, blind(folded) users can continue to experience visual perspective, occlusion, and contrast [3], albeit through sound. Users can discriminate and recognise a wide variety of objects using sound [4], and use their knowledge of the imagesound conversion rules to correctly identify new objects and describe their unique features [5].
Figure 1.
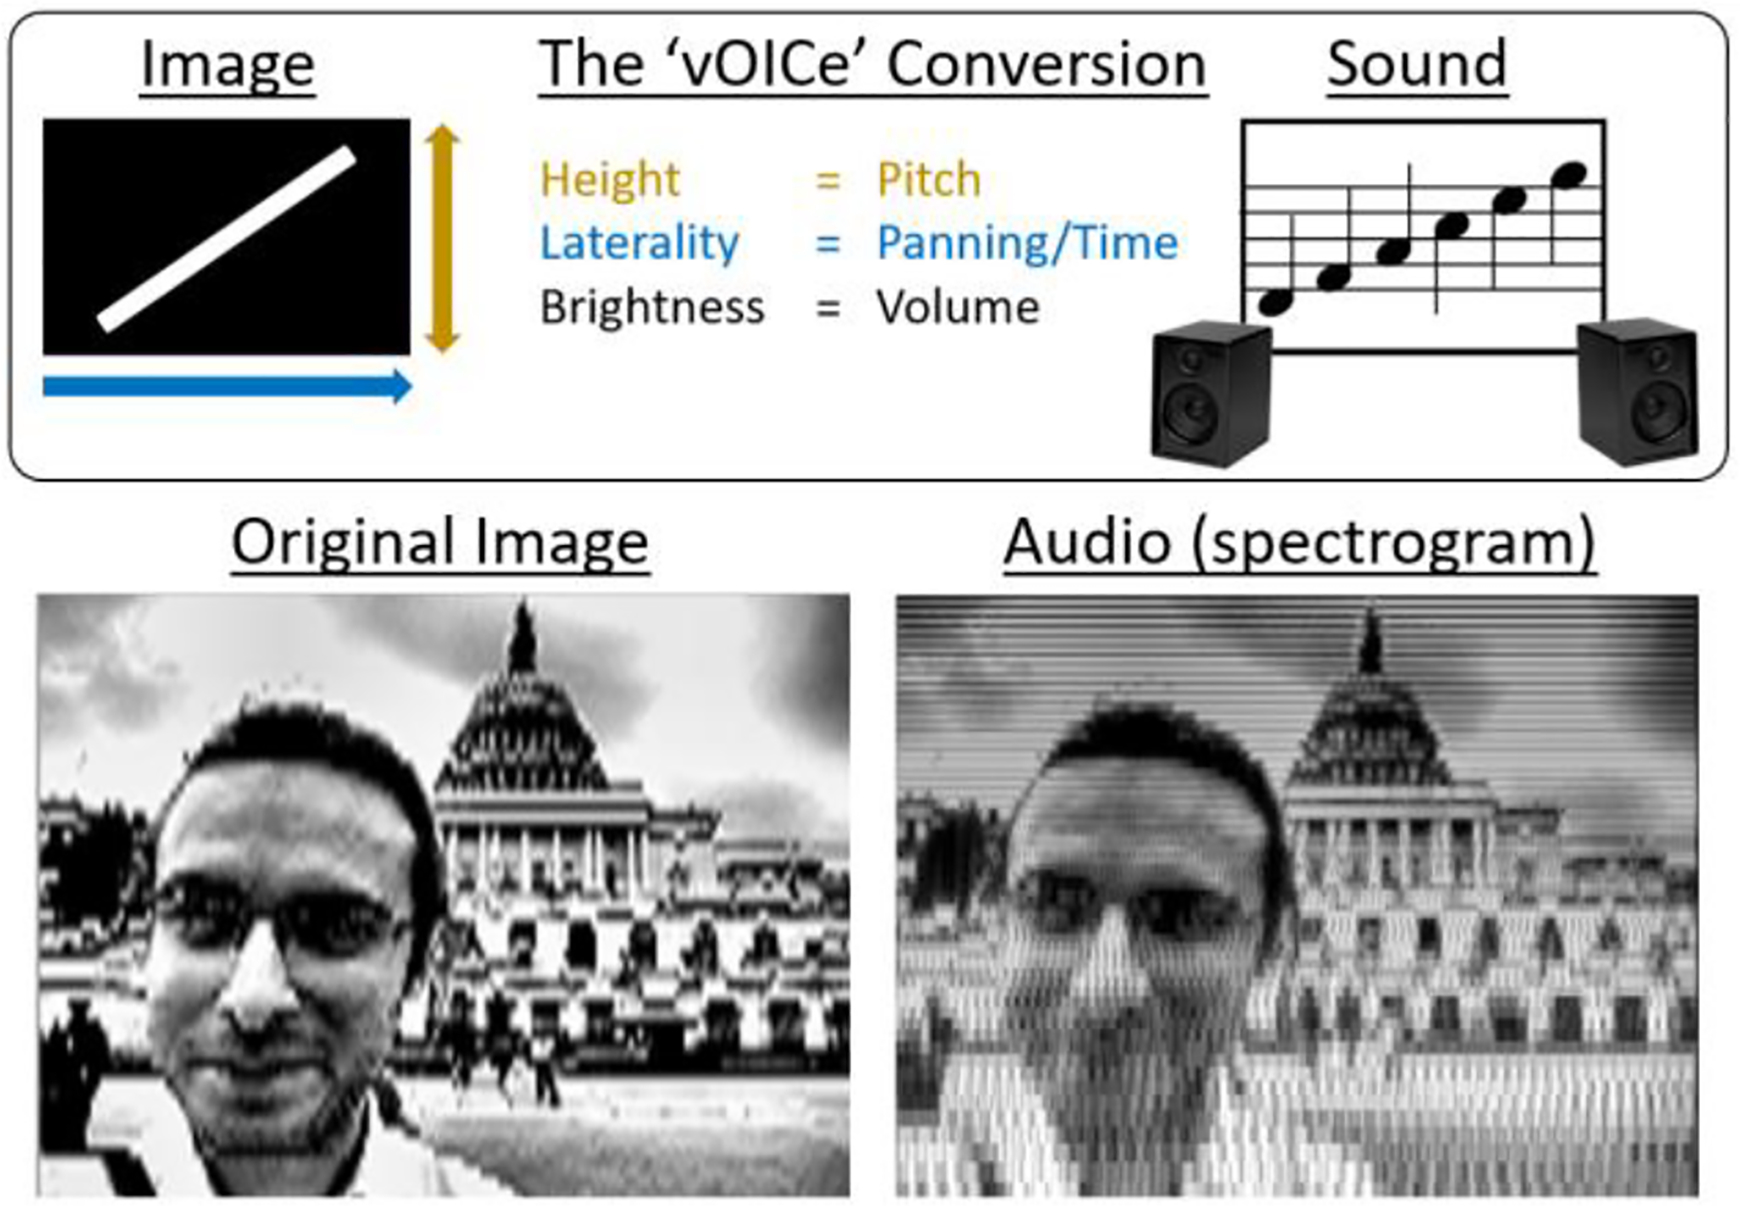
Top image shows how the ‘vOICe’ converts images into sound by converting visual height into pitch, laterality into panning/time, and brightness into volume. Bottom image shows how the details of the original image are preserved in the resulting sound using a spectrogram.
Visual assistive technologies not only need to preserve information on a technical level, but also convey it to the end user on a perceptual level. The result is the user’s functional resolution. This is commonly assessed via visual acuity testing. For auditory SSDs, congenitally blind users with ~70 hours of training have been able to reach a ‘visual’ acuity of up to 20/200 [6], matching the World Health Organization threshold for legal blindness. This outperforms current visual prosthesis competitors, including stimulation of the retina (Argus II 20/1262 [7]; Alpha-IMS 20/546 [8]; Alpha-AMS 20/500 [9]; MPDA 20/1000 [10]; PRIMA 20/460 [11]), cortical surface (Dobelle-Implant 20/1200 [12]), or tongue (TDU 20/860 [13]; BrainPort 20/5500 [14]). Auditory SSDs also used a wider field of view (66°) than the BrainPort (44°) or other alternatives (<20° or not reported), and as such a direct comparison of these results underestimates the current superior visual acuity of auditory SSDs.
While auditory SSDs have the highest ‘visual’ acuities to date, users show a variety of deficits when reconstructing complex images from sound. Prior research with the vOICe has shown that the ability to identify, count, and track multiple tones is a specific source of difficulty for users. Stiles and Shimojo [15] showed that while subjects were good at discriminating the number and thickness of vertical lines denoted through the timing of noise bursts, they were at chance level with discriminating parallel horizontal lines which requires counting the number of frequency bands within a complex sound. Brown and colleagues [16] also explored user abilities when discriminating parallel horizontal lines, showing that dissonance helped separate out lines that were otherwise masked by harmonics, and that performance improved as the frequency difference between the lines increased. Brown and Proulx [17] showed that sonifying the top half, and then bottom half of an object silhouette was easier for subjects than sonifying the full silhouette twice, despite the reduction in task-relevant information. This allowed subjects to concentrate on the higher, and then lower, pitch-changes in isolation before mentally reconstructing the shape. However, this approach doubles sonification time, and as the stimuli did not vary systematically, this obscures pinpointing user deficits. Another study using the EyeMusic found that an E-orientation visual acuity task was easier when the back of an ‘E’ was represented by a different color/timbre to its protrusions [18]. However, it is unclear whether this higher ‘visual’ acuity is due to the additional selectively applied color information, allowing the task to be solved at spatial resolutions too low to fully represent the ‘E’ optotype, or whether this is due to the additional auditory variation. It is also not clear whether users are mentally reconstructing these ‘E’ optotypes or listening for specific audio cues - e.g. whether the timbre for the E’s ‘back’ was the first, last, lowest, or highest pitch. Relative to all prior approaches, our method seeks to be systematic and necessitate mental reconstruction to solve the task, while also being novel in contrasting informational gain against auditory variation.
Across these examples, performance appears to improve when the soundscape is perceptually segmented for the user – through either intermittent silence, dissonance, frequencydistance, timbre, or isolating higher/lower frequencies in the soundscape. This pattern of findings corresponds well with what would be expected by auditory scene analysis (ASA). This describes the grouping principles that explain how a complex auditory soundscape is perceptually segmented into distinct auditory streams. For example, specific notes within a musical piece can be grouped off into a different auditory stream if only those notes become similar on one or more auditory factors (e.g. spatial position, frequency-range, volume-modulation, or timbre). From this, listeners can then attend to, or suppress, specific auditory streams [19]. This allows listeners to isolate a specific auditory stream and track its pitch-contours (rises and falls), which in the case of auditory SSDs like the vOICe, communicate the visual contours essential for shape reconstruction. For horizontal lines differing in height, the vOICe’s pitch-height mapping only allows listeners to separate out the lines via their pitchdifferences. However, it has not yet been evaluated whether adding ASA techniques such as timbre or volume-modulation to image-sonification may help users to perceptually separate out lines differing in height. In the present experiment, we show how utilising these ASA techniques can affect vOICe users’ ability to reconstruct complex shapes.
II. Methods
A. Experimental Protocol
Subjects.
Twenty-five sighted subjects (14 female, age= 35.28±13.48 years) were tested for 2 hours at NYU Langone Health after providing informed consent. All experiments were approved by the NYU Langone Health Institutional Review Board.
Materials.
Visual Images –
The complex shapes consisted of an upper line and a lower line. Travelling left-to-right, the line could ‘rise-then-fall’, ‘fall’, ‘stay steady’, ‘rise’, or ‘fall-then-rise’ (Figure 2, left image). These 5 types of upper lines and 5 types of lower lines create 25 complex shapes in total. Both lines span the same length on the X-axis, making their audio onsets/offsets the same, and each line that rises/falls does so within the same Y-axis/frequency range as their alternative choices in the task. This should evoke difficulties observed in prior studies [15–17], standardize shapes, and avoid cues so that listeners must mentally reconstruct the shape to solve the task. The altered sonification styles were created by applying a visual filter to the upper or lower line, prior to sonification by the vOICe. This was done to either randomly degrade the line using visual noise, which creates a ‘whistling’-like timbral sound, or have black vertical lines applied to rapidly modulate volume (Figure 2, right image).
Figure 2.

Left image shows the trial order of the complex-shape reconstruction task. Users hear a sonified complex shape 3 times (500ms inter-stimulus interval - ISI), and answer what the upper and lower lines were in two sequential 5-AFC tasks. Feedback includes their answer, and the correct shape/sonification. Right image shows how the different sonification styles were created by altering the complex shapes prior to sonification with the vOICe.
Audio –
All images were sonified by the vOICe v. 1.94, with a vertical resolution of 64 pixels (frequency range: 500–5,000Hz; exponential scaling), a horizontal resolution of 176 pixels, played over 2 seconds, with the scan line and spatialization travelling from left-to-right. Audio was output at a 44,100Hz sampling rate (32-bit) in the wav file format.
PsychoPy v3.0 [20] was used to present visual and audio stimuli and to record subject responses on a Microsoft Surface Book 15-inch laptop (60Hz screen refresh rate), with audio delivered via TaoTronics TT-BH060 noise-cancelling overear headphones connected via a 3.5mm jack. Volume was adjusted to comfortable listening levels for each subject. During training and feedback, subjects only saw the solid white ‘unaltered’ lines, irrespective of the sonification style.
Procedure.
Subjects learnt the vOICe’s image-sonification algorithm, including how each pixel’s height, brightness, and laterality are converted into pitch, volume, and panning/time. Subjects were not blindfolded as no visual information that could assist subject performance was given during trials.
Single Lines (exposure, training trials).
Here subjects saw/listened to each of the 5 potential upper lines in isolation and were asked to track how the pitch rose or fell with the visual shape. This was followed by 5 practice trials in which subjects heard a randomly selected line and matched it to its visual shape in a 5 alternative forced choice task (5-AFC). Audio feedback was given for correct/incorrect responses. This process was repeated for the 5 lower lines in isolation. This training was repeated if subjects had a low score (≤3/5).
Complex Shapes (exposure, training trials, formal trials).
Subjects then received three visual/audio presentations for each of 5 randomly selected complex shapes. They were asked to perceptually separate out the upper and lower lines in order to track each line’s pitch-changes. This was followed by 5 practice trials, with subjects hearing a randomly selected complex shape 3 times (with visual text directing the subject’s attention to the shape, upper line, and then the lower line). Subjects then attempted to reconstruct the sonified-shape via two sequential 5-AFC tasks, first on the upper-line, and then lower-line. Visual feedback showed their answer and the correct answer, as well as its sonification. The 25 formal trials followed this procedure, with each of the 25 possible complex shapes presented in a random order (Figure 2). During the tasks, subjects could draw the shapes (e.g. pen and paper, ‘in the air’). This kept the task focused on perceptual discrimination rather than memory retention. After the formal trials, subjects were told their overall score, as well as their percentage of correctly identified upper and lower lines. This entire procedure (single lines, complex shapes) was conducted for each of the five image-sonification styles (Figure 2) in a repeated measures design. These were presented in a stratifiedrandom order (The vOICe unaltered, upper-line timbre, upperline volume-modulation; lower-line timbre, lower-line volume-modulation), and counter-balanced across subjects. Analysis was done with IBM SPSS v. 26.
III. Results
Subjects had an image-reconstruction score counting how many times they correctly identified both the upper and lower lines of a sonified complex-shape image, and proportion correct scores for the upper and lower lines.
There was a high level of individual variation in subjects’ average image-reconstruction scores, with a linear regression revealing that 23.6% of this variation is explained by prior musical experience, F(1,23)=7.09, p=.014 (Figure 3). This predicts that subjects with no musical experience will score 6.58/25, and that for every additional year of musical experience their score would increase by 0.86.
Figure 3.

Regression line showing how additional years of musical experience increase subjects’ average image reconstruction scores.
When subjects were categorised into musically experienced (years ≥3) or not, a 2 (background: musical, non-musical) by 5 (sonification style) mixed ANOVA reveals that there is a significant main effect of sonification style, F(2.51,37.61)=5.00, p=.008, ηp2=.250, with Bonferronicorrected post-hoc tests revealing that only the timbremodified lower line significantly outperformed the unaltered vOICe (p=.013) (Figure 4). There was a significant main effect of musical experience, F(1,15)=5.58, p=.032, ηp2=.271, with the musically-experienced (mean score=15.02±2.29 SEM) doubling the number of correctly reconstructed shapes to those without (mean score=7.15±2.43 SEM). However there is no interaction effect between sonification style and musical experience, F(2.51, 37.61)=0.73, p=.519, ηp2=.046, indicating that prior musical experience confers a pure advantage in reconstructing complex shapes for all sonification styles.
Figure 4.

Effects of sonification style and musical experience on imagereconstruction scores. Both sonification style and musical experience significantly affected performance, with no interaction effect between the two. Post-hoc tests revealed altering the lower-line’s timbre significantly outperformed the unaltered vOICe. Key: *=p<.05, error bars=±1SEM.
To account for the large variations in individual performance, we subtracted the score for the unaltered vOICe from each alternative sonification style and ran a series of Bonferroni-corrected one-sample t-tests. This revealed that the unaltered vOICe was significantly outperformed when the lower line was modified by timbre, t(17)=4.06, p=.004, mean difference=4.06±1.00 SEM, or by volume-modulation, t(16)=2.98, p=.036, mean difference=3.24±1.09 SEM. No performance changes occurred from altering the upper line via timbre or volume-modulation (all p’s>.05) (Figure 5).
Figure 5.
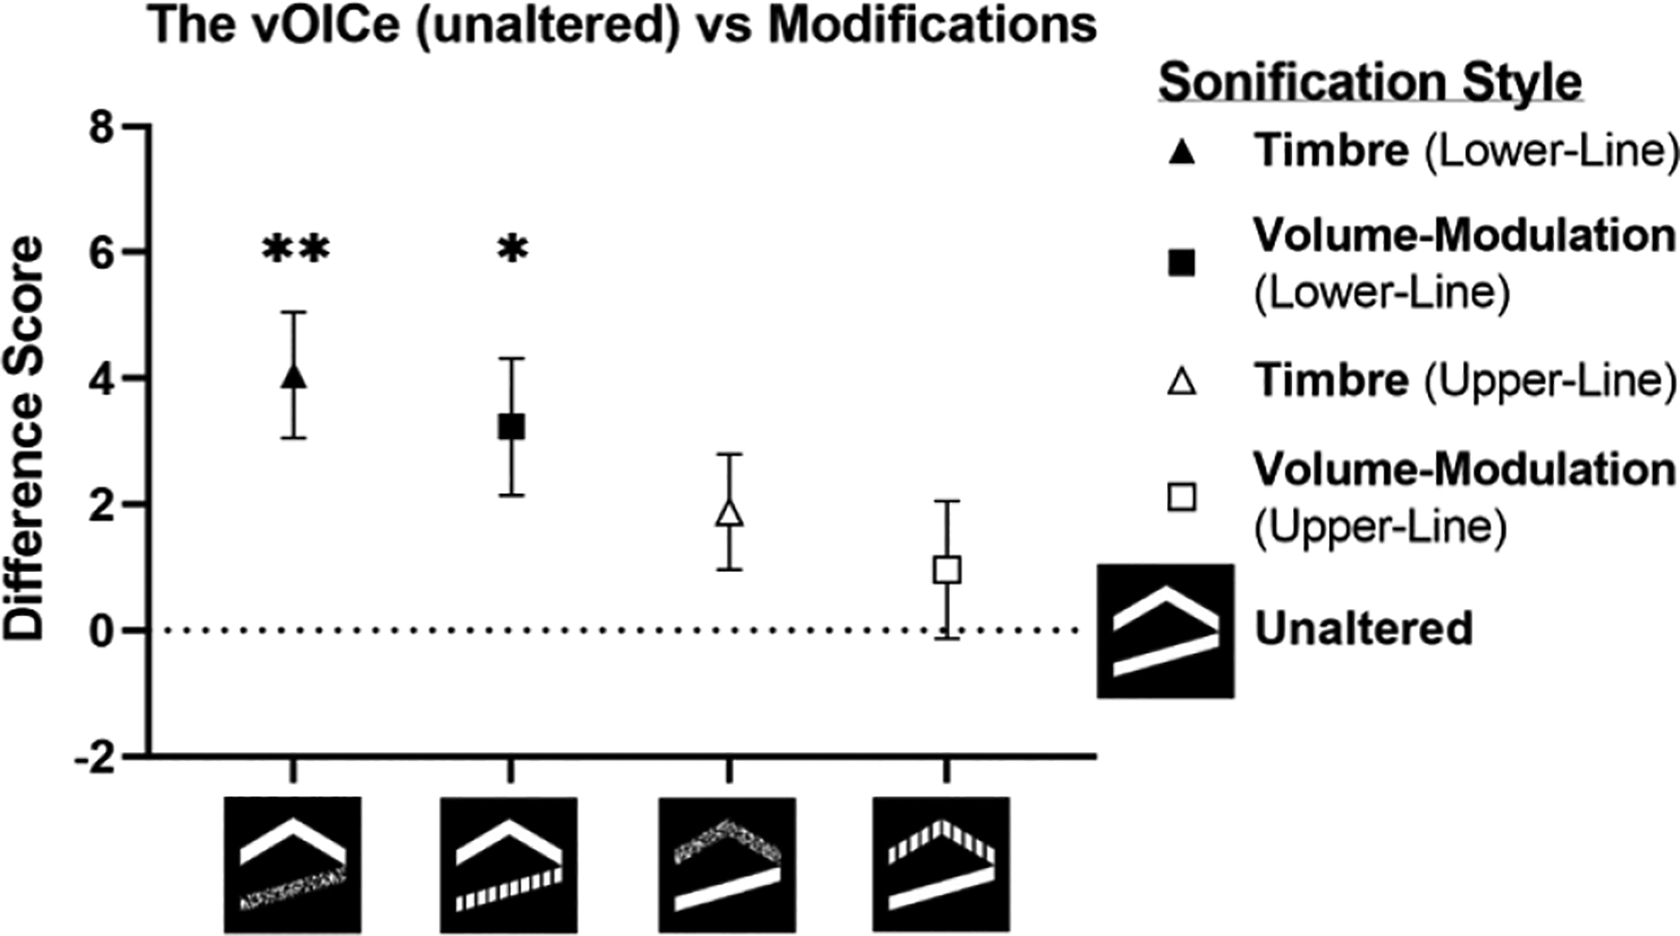
Mean-difference scores between the vOICe unaltered (denoted by the dotted line), and alternative sonification styles. This revealed that despite variations in user abilities, differentiating the lower line via timbre or volume-modulation significantly improved the subject’s imagereconstruction scores. Key: *=p<.05, **=p<.01, error bars=±1SEM.
To explore subject performance on individual lines, a 2 (line: upper, lower) by 5 (sonification style) repeated measures ANOVA was conducted, revealing that there was a significant main effect of sonification style, F(2.41,38.60)=3.12, p=.047, ηp2=.163, with no significant post-hocs after Bonferronicorrection. There was no significant main effect of line, F(1,16)=2.71, p=.119, ηp2=.145, indicating that overall, the upper and lower lines were equally difficult for subjects to discriminate. However, there was a significant interaction between sonification style and line, F(2.35,37.64)=3.47, p=.035, ηp2=.178, indicating a differing difficulty for lines across sonification styles. Bonferroni-corrected paired comparisons between the upper- and lower-line scores for each sonification style revealed that subjects had significantly higher performance for the lower lines when the upper line was modified by timbre t(24)=−3.23, p=.018, d=0.38, or volumemodulation t(24)=−2.91, p=.038, d=0.37 (Figure 6).
Figure 6.

Proportion of upper and lower lines correctly identified by subjects. A series of Bonferroni-corrected pairwise comparisons between upper- and lower-line scores for each image-sonification style revealed that when the upper line was modified using either timbre or volumemodulation, subjects had a significantly higher performance for the unaltered lower line. Key: *=p<.05, error bars=±1SEM.
IV. Conclusion
We show that SSD user performance is enhanced by both years of prior musical experience, and image sonifications that use additional ASA principles, specifically in lower regions / frequencies. These improvements occurred despite reductions in task-relevant information from degrading the visual signal. These results suggest that SSD designs should focus on auditory discriminability to improve performance, rather than increasing the visual information available [21]. These ASAinspired sonifications can be directly implemented into related SSDs like the SoundSight [22], which can sonify silhouettes from depth and thermal images. Boosting the abilities of novice users may help address the initial ‘frustrating’ learning phase reported by users, and in turn help facilitate longer-term adoption [23]. Future research should look to confirm these benefits for blind SSD users and develop image-sonifications that do not rely on pitch-discrimination to assist users who are non-musical or insensitive to certain frequencies. Finally, research should look to re-evaluate the image-sonification process to take advantage of how human listeners perceptually segment the auditory stream (as described by ASA) so that key visual features become more aurally salient. From this, SSDs could seek to go beyond the current 20/200 visual acuity barrier as well as enhance users’ initial image-reconstruction and comprehension abilities.
Acknowledgments
This work is supported in part by the National Institutes of Health R01-EY028125 (Bethesda, Maryland); and an unrestricted grant from Research to Prevent Blindness to NYU Langone Health Department of Ophthalmology (New York, New York).
Contributor Information
Giles Hamilton-Fletcher, Department of Ophthalmology, NYU Grossman School of Medicine, NYU Langone Health, New York University, New York, NY 10017 USA;.
Kevin C. Chan, Departments of Ophthalmology and Radiology, NYU Grossman School of Medicine, NYU Langone Health, New York University, New York, NY, 10017 USA
REFERENCES
- [1].Meijer PB, “An experimental system for auditory image representations,” IEEE Trans Biomed Eng, vol. 39, no. 2, pp. 112–21, Feb 1992. [DOI] [PubMed] [Google Scholar]
- [2].Merabet LB, Battelli L, Obretenova S, Maguire S, Meijer P, and Pascual-Leone A, “Functional recruitment of visual cortex for sound encoded object identification in the blind,” Neuroreport, vol. 20, no. 2, pp. 132–8, Jan 28 2009. [DOI] [PMC free article] [PubMed] [Google Scholar]
- [3].Ward J and Meijer P, “Visual experiences in the blind induced by an auditory sensory substitution device,” Conscious Cogn, vol. 19, no. 1, pp. 492–500, Mar 2010. [DOI] [PubMed] [Google Scholar]
- [4].Striem-Amit E, Cohen L, Dehaene S, and Amedi A, “Reading with sounds: sensory substitution selectively activates the visual word form area in the blind,” Neuron, vol. 76, no. 3, pp. 640–52, Nov 8 2012. [DOI] [PubMed] [Google Scholar]
- [5].Netzer O, Buchs G, Heimler B, and Amedi A, “A systematic computerized training program for using Sensory Substitution Devices in real-life,” presented at the 2019 International Conference on Virtual Rehabilitation (ICVR), 2019. [Google Scholar]
- [6].Striem-Amit E, Guendelman M, and Amedi A, “‘Visual’ acuity of the congenitally blind using visual-to-auditory sensory substitution,” PLoS One, vol. 7, no. 3, p. e33136, 2012. [DOI] [PMC free article] [PubMed] [Google Scholar]
- [7].Humayun MS et al. , “Interim results from the international trial of Second Sight’s visual prosthesis,” Ophthalmology, vol. 119, no. 4, pp. 779–88, Apr 2012. [DOI] [PMC free article] [PubMed] [Google Scholar]
- [8].Stingl K et al. , “Subretinal Visual Implant Alpha IMS--Clinical trial interim report,” Vision Res, vol. 111, no. Pt B, pp. 149–60, Jun 2015. [DOI] [PubMed] [Google Scholar]
- [9].Cehajic Kapetanovic J et al. , “Highest reported visual acuity after electronic retinal implantation,” Acta Ophthalmol, Apr 28 2020. [DOI] [PubMed] [Google Scholar]
- [10].Zrenner E et al. , “Subretinal electronic chips allow blind patients to read letters and combine them to words,” Proc Biol Sci, vol. 278, no. 1711, pp. 1489–97, May 22 2011. [DOI] [PMC free article] [PubMed] [Google Scholar]
- [11].Palanker D, Le Mer Y, Mohand-Said S, Muqit M, and Sahel JA, “Photovoltaic Restoration of Central Vision in Atrophic Age-Related Macular Degeneration,” Ophthalmology, Feb 25 2020. [DOI] [PMC free article] [PubMed] [Google Scholar]
- [12].Dobelle WH, “Artificial vision for the blind by connecting a television camera to the visual cortex,” ASAIO J, vol. 46, no. 1, pp. 3–9, Jan-Feb 2000. [DOI] [PubMed] [Google Scholar]
- [13].Chebat DR, Rainville C, Kupers R, and Ptito M, “Tactile-’visual’ acuity of the tongue in early blind individuals,” Neuroreport, vol. 18, no. 18, pp. 1901–4, Dec 3 2007. [DOI] [PubMed] [Google Scholar]
- [14].Nau A, Bach M, and Fisher C, “Clinical Tests of Ultra-Low Vision Used to Evaluate Rudimentary Visual Perceptions Enabled by the BrainPort Vision Device,” Transl Vis Sci Technol, vol. 2, no. 3, p. 1, 2013. [DOI] [PMC free article] [PubMed] [Google Scholar]
- [15].Stiles NR and Shimojo S, “Auditory Sensory Substitution is Intuitive and Automatic with Texture Stimuli,” Sci Rep, vol. 5, p. 15628, Oct 22 2015. [DOI] [PMC free article] [PubMed] [Google Scholar]
- [16].Brown DJ, Simpson AJ, and Proulx MJ, “Auditory scene analysis and sonified visual images. Does consonance negatively impact on object formation when using complex sonified stimuli?,” Front Psychol, vol. 6, p. 1522, 2015. [DOI] [PMC free article] [PubMed] [Google Scholar]
- [17].Brown DJ and Proulx MJ, “Audio–vision substitution for blind individuals: Addressing human information processing capacity limitations,” IEEE Journal of Selected Topics in Signal Processing, vol. 10, no. 5, pp. 924–31, 2016. [Google Scholar]
- [18].Levy-Tzedek S, Riemer D, and Amedi A, “Color improves “visual” acuity via sound,” Front Neurosci, vol. 8, p. 358, 2014. [DOI] [PMC free article] [PubMed] [Google Scholar]
- [19].Bregman A, Auditory scene analysis: The perceptual organization of sound. MIT press, 1994. [Google Scholar]
- [20].Peirce J et al. , “PsychoPy2: Experiments in behavior made easy,” Behav Res Methods, vol. 51, no. 1, pp. 195–203, Feb 2019. [DOI] [PMC free article] [PubMed] [Google Scholar]
- [21].Brown DJ, Simpson AJ, and Proulx MJ, “Visual objects in the auditory system in sensory substitution: how much information do we need?,” Multisens Res, vol. 27, no. 5–6, pp. 337–57, 2014. [DOI] [PubMed] [Google Scholar]
- [22].Hamilton-Fletcher G, Alvarez J, Obrist M, and Ward J, “SoundSight: A Mobile Sensory Substitution Device that Sonifies Colour, Distance, and Temperature,” Journal on Multimodal User Interfaces, pp. 1–17, 2021. [Google Scholar]
- [23].Hamilton-Fletcher G, Obrist M, Watten P, Mengucci M, and Ward J, ““I Always Wanted to See the Night Sky” Blind User Preferences for Sensory Substitution Devices.,” presented at the Proceedings of the 2016 CHI Conference on Human Factors in Computing Systems, 2016. [Google Scholar]