Abstract
Clear cell renal cell carcinoma (ccRCC) is one of the most common malignant tumors of the urinary system. Distant metastasis is the leading cause of poor prognosis in ccRCC. However, ccRCC is found poorly responsitive to radiotherapy and chemotherapy. Effective therapeutic strategies for its metastasis remain scarce. We analyzed clinical samples and public database, for differential expression of SLC27A2 and further explored its relationship with clinical prognosis. Biochemistry and functional experiments were carried out to study the potential mechanisms of SLC27A2, CDK3, and EMT. SLC27A2 was significantly downregulated in clinical specimens and renal cancer cell lines and predicted poor prognosis. We found that specific upregulation of SLC27A2 could significantly inhibited the proliferation, migration, and invasion of renal cancer cell lines. SLC27A2 could also influence the Epithelial-mesenchymal transition (EMT) signaling pathway, linked to the progression and metastasis of renal cancer. Using whole transcriptome sequencing of SLC27A2, CDK3 was identified as a regulatory SLC27A2 target. In terms of mechanism, SLC27A2 may further inhibit the epithelial-to-mesenchymal transition by negatively regulating CDK3. Our work suggests that functional inhibition of SLC27A2-CDK3-EMT axis may be an attractive therapeutic target for metastasis of ccRCC.
Subject terms: Renal cell carcinoma, Gene regulation
Introduction
Renal cancer is a highly prevalent malignant solid tumor of the urinary system. According to the Chinese Medical Journal of renal malignancies, approximately 77,410 and 71,676 new kidney cancer cases will be diagnosed in China and the United States, respectively, in 2022, and approximately 46,345 and 15,259 people will die from the disease [1]. CcRCC takes accounts for most of the malignant subtypes of kidney cancer [2].
Distant metastasis occurs in 30% of ccRCC patients during initial diagnosis, resulting in a poor prognosis [3]. The molecular mechanism of renal cell carcinoma metastasis remains unclear. Therefore, it is critical to investigate the mechanism of renal cell carcinoma metastasis and identify new targets for clinical treatment.
SLC27A2, a member of the solute carrier family 27, is a critical fatty acid transporter involved in various developmental processes, including lipid biosynthesis and fatty acid breakdown [4]. SLC27A2, as a tumor suppressor gene, is associated with multiple human malignancies, for instance, lung cancer [5], ovarian cancer [6], and prostate cancer [7]. However, there are few studies on the expression of SLC27A2 and its biological behavior in renal cell carcinoma [8].
Epithelial to mesenchymal transition (EMT) is crucial in differentiating various tissues and organs [9]. EMT contributes to tissue repair, but it can also promote cancer progression through various mechanisms [10]. EMT gives cells the ability to migrate and invade, induces stem cell qualities, inhibits apoptosis and senescence, and contributes to immunosuppression [11]. Moreover, the ability of cells to move to distant organs and maintain stem cells is linked to the mesenchymal state. Therefore, exploring the EMT-related mechanisms in tumors and targeting EMT in the treatment of tumors have received much attention. However, the relationship between SLC27A2 and EMT in renal cancer has not been explored.
Cyclin-dependent kinase 3 (CDK3) encodes a cyclin-associated protein kinase family member. The protein induces S phase in cells by activating E2F transcription factor family members [12]. The protein is also associated with cyclin C and phosphorylates the retinoblastoma 1 protein to promote exit from the G0 stage [13]. CDK3 has been linked to EMT and the growth of cancerous tumors [14]. Whether and what role CDK3 plays in SLC27A2 affecting EMT remains unclear.
In this article, we verified the low expression level of SLC27A2 in both cell lines and renal cancer tissues. Upregulation of SLC27A2 significantly inhibited the migration and invasion abilities of renal cancer cells 786-O and CAKI. Increased SLC27A2 expression partially reversed the EMT process in ccRCC cells and downregulated the expression of CDK3. As a result, we speculated that SLC27A2 might take part in the migration and invasion of renal cancer cell by coordinating CDK3-mediated EMT in ccRCC. Mechanistic and functional studies revealed that SLC27A2 orchestrates EMT through CDK3, partially reversing this process and inhibiting tumor progression. It provided a theoretical basis for considering SLC27A2 as a potential therapeutic target for ccRCC.
Results
SLC27A2 was downregulated in RCC and could act as a potential biomarker for RCC
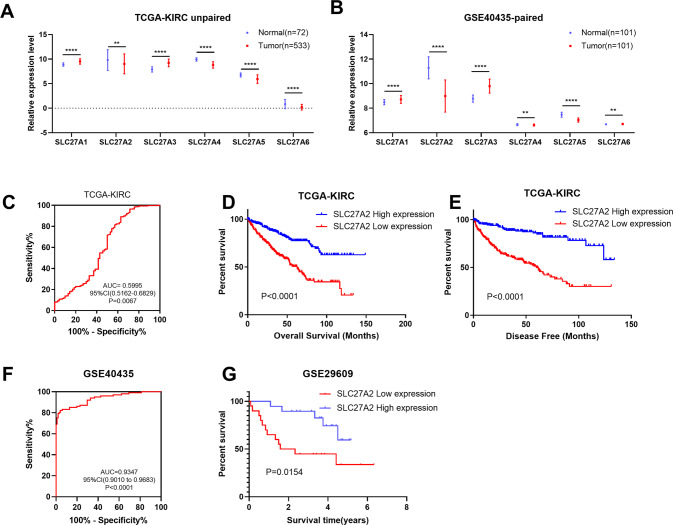
To determine the roles that genes in the solute carrier family 27 play in the ccRCC, the relative mRNA levels of SLC27A1 to SLC27A6 were analyzed using the TCGA-KIRC database and confirmed using data from GSE40435 [15] and GSE29609 [16]. The results showed that SLC27A1 and SLC27A3 were higher-expressed in tumor samples of both sets, while SLC27A2, SLC27A4, and SLC27A5 expressions were much lower (Fig. 1A, B). Notably, SLC27A6 expressed lower in TCGA tumor samples than in GSE40435 tumor tissues. Furthermore, overall survival (OS) and disease free survival (DFS) analysis of all six candidates were analyzed using TCGA-KIRC related information. The results revealed that none of SLC27A1, 3, 4, 5, 6 possessed prognostic values for both the OS and DFS of ccRCC simultaneously (Fig. S1). Although the calculated p-value of SLC27A6 was less than 0.05, it expressed lower in tumor tissues, and the lower expression of SLC27A6 suggested better survival performance. Meaningfully, the low expression of SLC27A2 exhibited poor OS and DFS, suggesting it as an effective prognostic biomarker for ccRCC (Fig. 1D, E). In addition, data from GSE29609 were used to prove the prognostic value of SLC27A2 (Fig. 1G). ROC curves suggested that SLC27A2 could act as a diagnostic biomarker for ccRCC using TCGA-KIRC and GSE40435 data (Fig. 1C, P = 0.0067; Fig. 1F, P < 0.0001).
Fig. 1. SLC27A2 was downregulated in ccRCC and could act as a potential biomarker for ccRCC.
A Expression profiles of SLC27As mRNA in ccRCC tissues (n = 533) and neighboring normal tissues n = 72) were downloaded from TCGA-PRAD database. B Expression profiles of SLC27As mRNA in ccRCC tissues (n = 101) and neighboring normal tissues (n = 101) were downloaded from GSE40435-paired. C ROC curve of SLC27A2. D, E Kaplan–Meier curves of SLC27A2 expression. F ROC curve of SLC27A2 in GSE40435. G Kaplan–Meier curves of SLC27A2 expression.
Aberrant expression of SLC27A2 was significantly associated with different clinical features
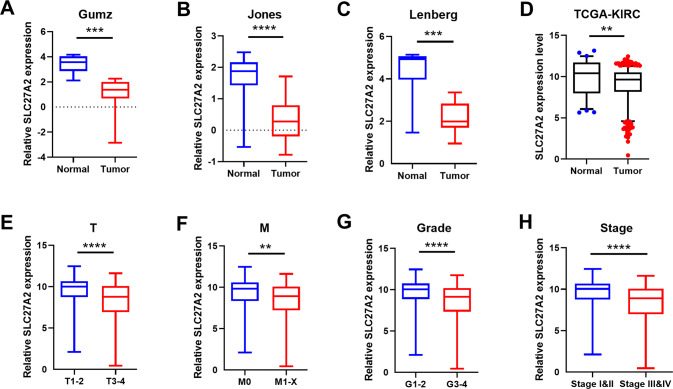
Using public databases, we initially confirmed that SLC27A2 expression level was lower in ccRCC than in normal kidney samples. The results showed that SLC27A2 was notably downregulated in Gumz, Jones, Lenberg, and The Cancer Genome Atlas Kidney Renal Clear Cell Carcinoma (TCGA-KIRC) data (Fig. 2A–D). In addition, SLC27A2 expression was found to be substantially linked with a variety of clinical characteristics. The higher the T stage was, the lower the SLC27A2 expressed (Fig. 2E). The expression of SLC27A2 was lower in samples with the M1 stage than those with the M0 stage (Fig. 2F). Patients in G1 or G2 grade showed higher SLC27A2 expression levels than the TNM III or IV (Fig. 2G, H). SLC27A2 was an independent predictor of ccRCC in univariate and multivariate cox proportional hazards regression analyses. Thus, SLC27A2 could be used as a diagnostic and prognostic biomarker in ccRCC (Tables 1 and 2).
Fig. 2. Aberrant expression of SLC27A2 was significantly associated with different clinical features.
A–C SLC27A2 mRNA expression in three Oncomine subsets, including Gumz, Jones and Lenberg renal statistics, **p < 0.01, ***p < 0.001, and ****p < 0.0001. D–H SLC27A2 expression in TCGA-KIRC datasets, including cancer versus para-cancer, T stage, M stage, G stage, and TNM stage.
Table 1.
Univariate and multivariate analyses of risk score and patient overall survival.
| Variables | Univariate analysis | Multivariate analysisc | ||||
|---|---|---|---|---|---|---|
| HRa | 95% CIb | P value | HRa | 95% CIb | P value | |
| Age (years) <60 vs ≥60 | 1.766 | 1.297–2.404 | <0.001 | 1.680 | 1.232–2.293 | 0.001 |
| Gender Female vs Male | 0.965 | 0.707–1.318 | 0.825 | |||
| T stage T1 or T2 vs T3 or T4 | 3.043 | 2.245–4.124 | <0.001 | 1.528 | 1.062–2.197 | 0.022 |
| N stage N0 or Nx vs N1 | 3.554 | 1.871–6.748 | <0.001 | 1.864 | 0.968–3.591 | 0.063 |
| M stage M0 or Mx vs M1 | 4.369 | 3.197–5.971 | <0.001 | 2.505 | 1.739–3.609 | <0.001 |
| Grade G1 or G2 or Gx vs G3 or G4 | 2.605 | 1.853–3.661 | <0.001 | 1.559 | 1.078–2.256 | 0.018 |
| SLC27A2 High vs Low | 0.350 | 0.252–0.486 | <0.001 | 0.520 | 0.367–0.738 | <0.001 |
aHazard ratio, estimated from Cox proportional hazard regression model.
bConfidence interval of the estimated HR.
cMultivariate models were adjusted for T, N, M classification, age, and gender.
Table 2.
Univariate and multivariate analyses of risk score and patient disease free survival.
| Variables | Univariate analysis | Multivariate analysisc | ||||
|---|---|---|---|---|---|---|
| HRa | 95% CIb | P value | HRa | 95% CIb | P value | |
| Age(years) <60 vs ≥60 | 1.384 | 0.968–1.977 | 0.075 | 1.406 | 0.962–2.056 | 0.078 |
| Gender Female vs Male | 1.469 | 0.985–2.193 | 0.060 | 1.026 | 0.677–1.554 | 0.905 |
| T stage T1 or T2 vs T3 or T4 | 4.460 | 3.090–6.437 | <0.001 | 1.872 | 1.224–2.864 | 0.004 |
| N stage N0 or Nx vs N1 | 6.110 | 3.067–12.173 | <0.001 | 3.043 | 1.458–6.348 | 0.003 |
| M stage M0 or Mx vs M1 | 8.487 | 5.834–12.348 | <0.001 | 4.568 | 3.004–6.947 | <0.001 |
| TNM stage I + II vs III + IV | 6.579 | 4.408–9.820 | <0.001 | |||
| Grade G1 or G2 or Gx vs G3 or G4 | 3.400 | 2.250–5.136 | <0.001 | 2.075 | 1.340–3.216 | 0.001 |
| SLC27A2 High vs Low | 0.243 | 0.160–0.370 | <0.001 | 0.378 | 0.242–0.589 | <0.001 |
aHazard ratio, estimated from Cox proportional hazard regression model.
bConfidence interval of the estimated HR.
cMultivariate models were adjusted for T, N, M classification, age, and gender.
SLC27A2 was importantly downregulated in ccRCC tissues and cell lines
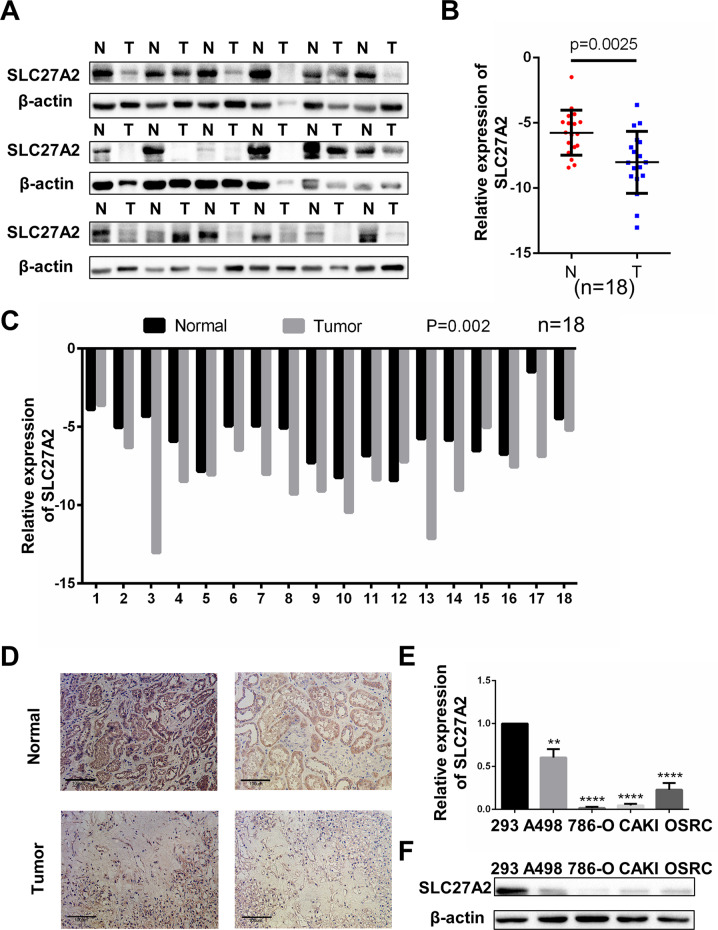
Paired tissues were obtained from Wuhan Union Hospital to confirm the level of SLC27A2 expression in ccRCC tissues. The SLC27A2 expression level was lower in ccRCC tissues compared to neighboring normal tissue samples in Western blotting and qRT-PCR detection (Fig. 3A–C). The results of immunohistochemistry were similar (Fig. 3D). We also used qRT-PCR and Western blotting to show that SLC27A2 in RCC cells (A498, 786-O, Caki, and OSRC) was lower than in a normal kidney cell line (293) in both mRNA and protein levels (Fig. 3E, F). Collectively, these results confirm the fact that SLC27A2 is underexpressed in ccRCC.
Fig. 3. SLC27A2 was significantly downregulated in ccRCC tissues and cell lines.
A The protein levels of SLC27A2 in ccRCC tissues and neighboring normal tissues. B, C qRT-PCR analysis of SLC27A2 mRNA expression in 18 pairs of ccRCC tissues and neighboring normal tissues. D The immunohistochemistry (IHC) staining for SLC27A2 in ccRCC tissues and neighboring normal tissues (Magnification: 200×). E, F The mRNA levels and protein levels in five ccRCC cell lines (A498, 786-O, CAKI, and OSRC) and normal cell line (293), t-test, **p < 0.01,****p < 0.0001.
SLC27A2 functioned as an anti-oncogene and inhibited metastasis and EMT in ccRCC
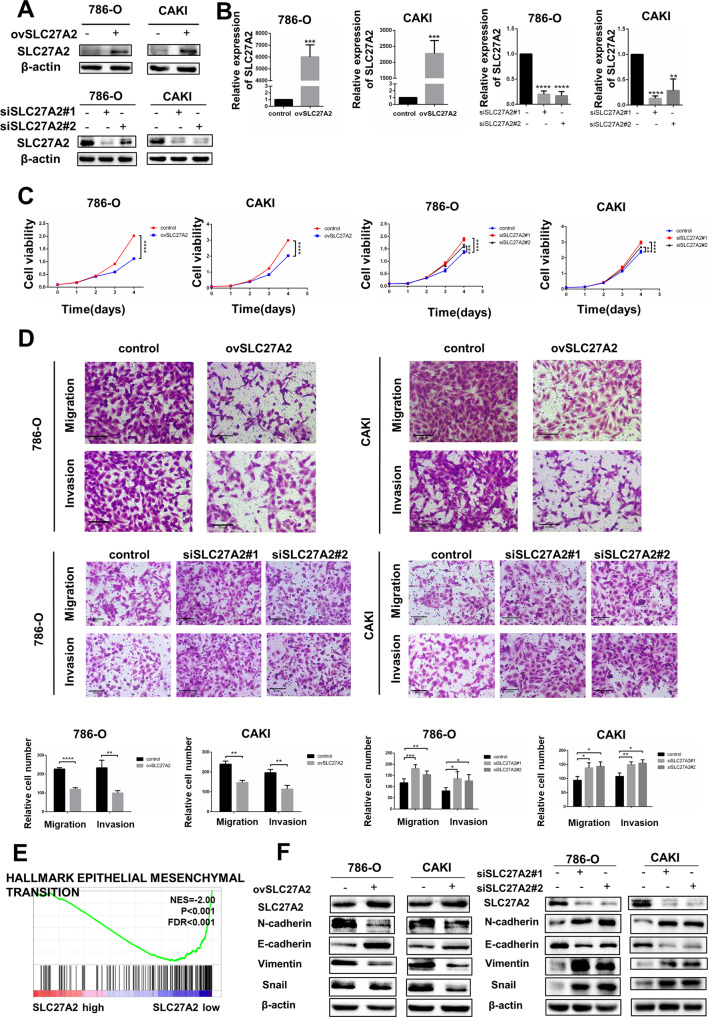
To figure out the influence of SLC27A2 to the metastasis of RCC, we performed numbers of functional tests utilizing mentioned above cell lines. SLC27A2-overexpressing lentivirus and SLC27A2 small interfering RNA (siRNA) were transfected into relevant cell lines to generate renal cancer cells with high SLC27A2 expression and low SLC27A2 expression (786-O and Caki) (Fig. 4A, B). The capacity of ccRCC cells to proliferate was assessed using the CCK8 assay. According to the findings, the proliferation rate of 786-O and Caki cells was dramatically reduced in cells overexpressing SLC27A2 (Fig. 4C). Meanwhile, the proliferation rate of 786-O and Caki cells was improved in cells when knocking down SLC27A2 (Fig. 4C).
Fig. 4. SLC27A2 functioned as an anti-oncogene and inhibited metastasis and EMT in ccRCC.
A, B SLC27A2 protein and mRNA expression after overexpression or knockdown. C Cell growth curves of CCK8 assay for indicated cells. D Migration and invasion assays for indicated cells (Magnification: 200×). E GSEA assays for the correlation of EMT signaling pathway and mRNA level of SLC27A2 according to TCGA database. F The expression change of EMT markers in ccRCC cells with overexpressing or knockdown SLC27A2. *p < 0.5, **p < 0.01, ***p < 0.001, and ****p < 0.0001.
To determine the role of SLC27A2 in cell migration, trasnwell migration experiments were performed in 786-O and Caki cells by comparing groups before and after lentiviral transfection. As expected, the migratory capability was decreased in 786-ovSLC27A2 and caki-ovSLC27A2 cells while the migratory capability was increased in 786-siSLC27A2 and caki-siSLC27A2 cells (Fig. 4D). Transwell invasion assays were also used to measure invasion capabilities. The ability of SLC27A2 overexpressing cells to invade was dramatically diminished while the ability of cancer cells with SLC27A2 koncked down to invade was dramatically rised (Fig. 4D).
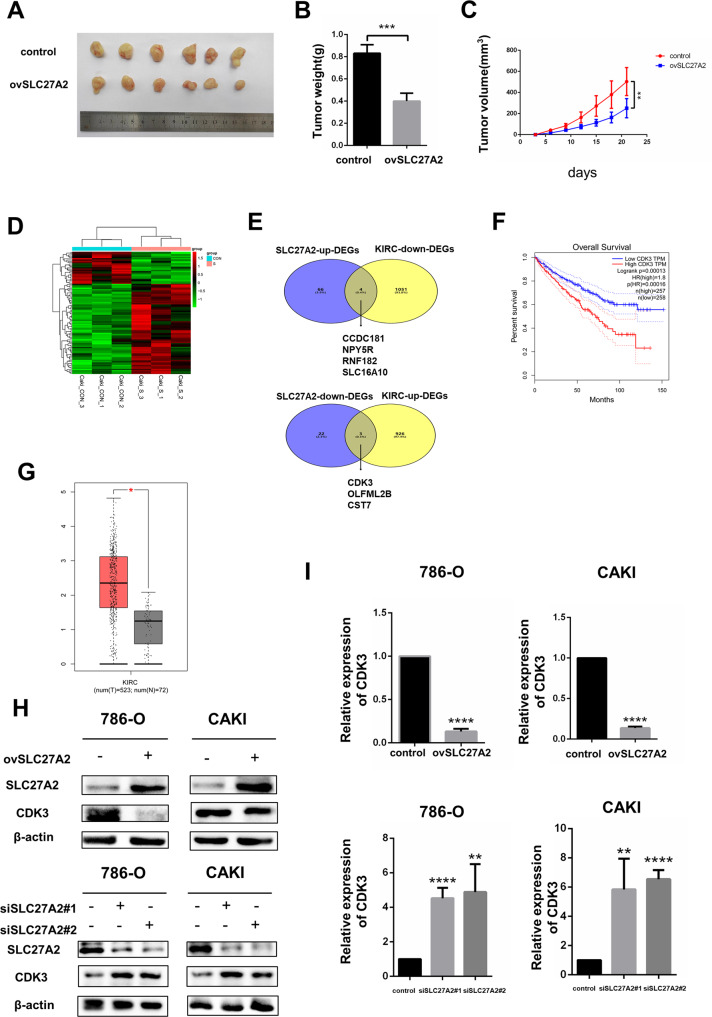
Since we had studied the function of SLC27A2 in vitro, further function validation were conducted in vivo. Caki cells overexpressing SLC27A2 lentivirus were seeded subcutaneously in nude mice. Tumor sizes were measured every 3 days, and subcutaneous tumors were removed from nude mice on day 21. The results showed that overexpression of SLC27A2 reduced tumor weights and volumes in vivo (Fig. 5A–C). The above experiments provided conclusive evidence that SLC27A2 inhibited the proliferation, migration, and invasion of ccRCC cells, having important implications in the process of tumor metastasis.
Fig. 5. SLC27A2 could negatively regulate the expression of CDK3 in RCC.
A Nude mice were inoculated with CAKI cells stably overexpressing SLC27A2. Images of tumors dissected from the mice at the end of experiment. B Tumors were weighted after excision. The data are presented as the means ± SEM. C The tumor size was measured every 3 days. D Cluster analysis heatmap based on sequencing results. E The upper part is the interaction of SLC27A2-up-DEGs and TCGA-KIRC-down-DEGs. The lower half is interaction of SLC27A2-down-DEGs and TCGA-KIRC-up-DEGs. F The Kaplan–Meier curves of CDK3 in ccRCC for overall survival (OS). G The expression level comparsion of CDK3 between tumor samples and normal samples in TCGA-KIRC cohort. H The protein level of CDK3 after overexpressing or knockdown SLC27A2 in 786-O and CAKI cell lines. I The mRNA level of CDK3 after overexpressing or knockdown SLC27A2 in 786-O and CAKI cell lines. *p < 0.5, **p < 0.01, ***p < 0.001, and ****p < 0.0001.
Gene Set Enrichment Analysis (GSEA) was used to study the biological processes involved in SLC27A2 regulation based on the TCGA database to see how SLC27A2 affected ccRCC carcinogenesis and progression (Fig. 4E). The findings demonstrated that SLC27A2 was strongly linked to EMT signaling characteristics. Thus, we speculated that SLC27A2 affected the EMT process. Study examined at the changes in numerous EMT markers in SLC27A2 overexpression cells and siSLC27A2 cells to test this theory. These results confirmed that E-cadherin expression level was higher, and Vimentin, Snail1, N-cadherin expression level were lower in 786-O and Caki cells transfected with SLC27A2 overexpression lentivirus than 786-O and Caki cells at protein levels (Fig. 4F). The opposite results were observed in siSLC27A2 cells (Fig. 4F). In summary, SLC27A2 overexpression inhibited ccRCC EMT in vitro while the knockdown of SLC27A2 in renal cancer cells promoted ccRCC EMT in vitro.
SLC27A2 could negatively regulate the expression of CDK3 in RCC
CAKI cells with SLC27A2 overexpression were chosen for whole transcriptome sequencing to better understand the mechanism of EMT by SLC27A2. Further analyses were used to explore potential downstream genes based our seq-data (Fig. 5D). These results confirmed that 69 mRNAs were up-regulated, and 25 mRNAs were down-regulated in overexpressing SLC27A2 CAKI cells (|fold change | > 2, P < 0.05). Additional bioinformatics analyses were used to analyze the sequencing results among these differentially expressed genes, and alignment with the TCGA-KIRC database yielded 7 genes with biological significance (Fig. 5E). We performed overall survival analyses and found that CDK3 was the only one in above seven candidate genes significantly associated with prognosis of renal cancer patients (Figs. 5F, S2). The mRNA expression of CDK3 in renal cancer tissues was much higher than in normal tissues, consistent with the survival analysis results, indicating that CDK3 was an unfavorable biomarkers for RCC and might participate in cancer progression (Fig. 5G). Since we had found that SLC27A2 was significantly associated with EMT signaling (Fig. 4E, F), while CDK3 was previously reported to regulate the EMT signaling pathway [14], whether SLC27A2 regulated EMT processes through CDK3 needed further study. As a result, we identified CDK3 as an important downstream molecule of SLC27A2 and conducted further experiments to figure out potential mechanism. We also verified the regulatory effect of SLC27A2 on CDK3 using qRT-PCR and western blot in two renal cancer cells (Fig. 5H, I).
CDK3 was up-regulated in RCC and promoted its metastasis
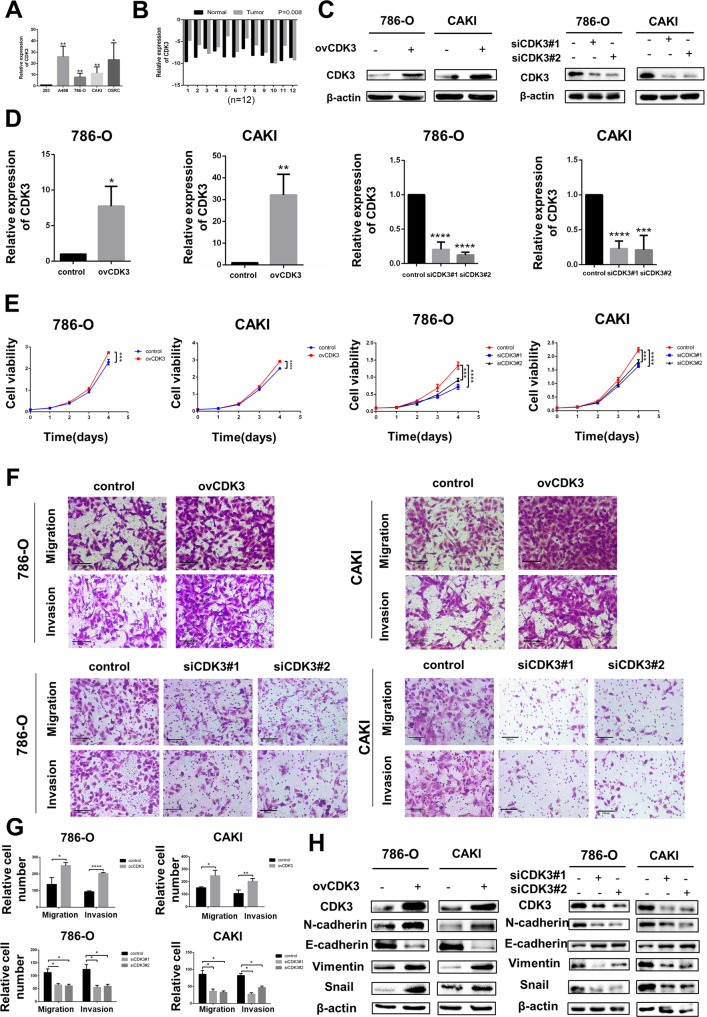
We used qRT-PCR to validate the increment of CDK3 in ccRCC cells and cancer tissues. According to these findings, the CDK3 level was considerably higher in RCC cells and cancer tissues (Fig. 6A, B) [14]. To probe the effect of CDK3 on the biological behavior of renal cell carcinoma, CDK3 plasmid was used to transfect renal cancer cells and up-regulate CDK3 expression. Compared to the negative controls, mRNA and protein expression of CDK3 in 786-O and Caki were observably higher (Fig. 6C, D). SLC27A2 small interfering RNA was used to transfect renal cancer cells and down-regulate CDK3 expression in mRNA and protein (Fig. 6C, D).
Fig. 6. CDK3 was up-regulated in RCC and promoted its metastasis.
A The mRNA levels of CDK3in ccRCC cells. B The mRNA levels of CDK3 in 12 pairs of ccRCC tissues and neighboring normal tissues. C, D CDK3 protein and mRNA expression after overexpression or knockdown. E Cell growth curves of CCK8 assays for indicated cells. F, G Migration and invasion assay for overexpressing or knockdown CDK3 (Magnification: 200×). t-test, *p < 0.05, **p < 0.01,***p < 0.001, ****p < 0.0001. H The expression change of EMT markers in overexpressing CDK3 cells or siCDK3 cells.
The capacity of ccRCC cells to proliferate was assessed using a CCK8 assay. These results confirmed that cells overexpressing CDK3 increased the proliferation rate of CAKI and 786-O cells significantly but knock-down of CDK3 decreased the proliferation rate of CAKI and 786-O cells (Fig. 6E). To determine the role of CDK3 in cell migration, the migratory capability of 786-ovCDK3 cells and caki-ovCDK3 cells was increased compared to the migration of control cells. The migratory capability of 786-siCDK3 cells and caki-siCDK3 cells was decreased compared to the migration of control cells. Transwell migration experiments in two ccRCC cell lines corroborated the aforesaid findings. Similarly, transwell invasion experiments were used to determine invasion capability. The potential to invade was greatly boosted in CDK3 cells that were overexpressed whereas the opposite phenomenom was observed in siCDK3 cells (Fig. 6F, G).
According to the findings, CDK3 could boost ccRCC migratory and invasive capabilities. Because EMT frequently results in the increased migratory and invasive ability of epithelial cells, and according to a previous article, CDK3 could promote the EMT process [14]. We hypothesized that CDK3 could also affect EMT processes in renal cancer. We assessed alterations in several EMT markers in CDK3-overexpressing cells to test this hypothesis. At the protein level, E-cadherin expression decreased while the expression of Vimentin, Snail1, and N-cadherin increased in 786-O and Caki transfected with CDK3 overexpression plasmid. However, in siCDK3 cells, the protein level changes of the above EMT markers were reversed (Fig. 6H). As a result, overexpression of CDK3 promoted EMT process of ccRCC in vitro while knockdown of CDK3 could inhibit EMT process.
SLC27 A2 promoted EMT signaling and ccRCC metastasis in a CDK3-mediated manner
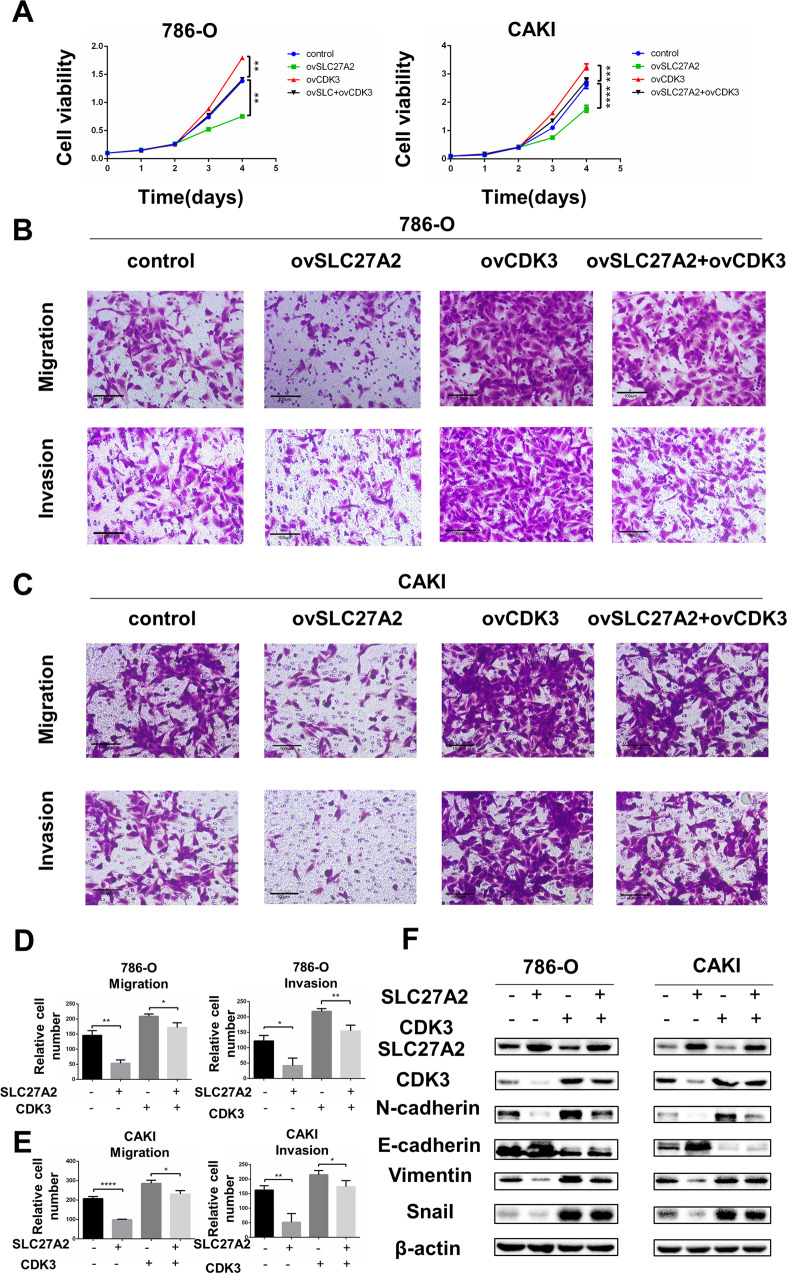
Based on the above experimental results, we proposed that SLC27A2 influences ccRCC development by affecting CDK3-dependent EMT processes. To demonstrate the relevance of the SLC27A2-CDK3 axis in ccRCC, a functional rescue test was carried out. Using previous methods, we constructed four sets of cell lines for rescue experiments, cell lines with control group, cell lines with overexpression SLC27A2 group, cell lines with overexpression CDK3 group, and cell lines with overexpression SLC27A2 and CDK3. As mentioned, overexpression of SLC27A2 can greatly reduce the capacity of ccRCC cells to proliferate. The CCK8 experiment revealed that overexpressing CDK3 could reduce the SLC27A2-induced suppression of cell growth to some extent (Fig. 7A). Similarly, we also constructed four cell lines for rescue experiments using small interfering RNAs, cell lines with control group, cell lines with siSLC27A2 group, cell lines with siCDK3 group, and cell lines with siSLC27A2 and siCDK3. The CCK8 experiment revealed that siCDK3 could reduce the siSLC27A2-induced cell growth to some extent (Fig. S3A).
Fig. 7. SLC27A2 promoted EMT signaling and ccRCC metastasis in a CDK3-mediated manner.
A Cell growth curves of CCK8 assays for indicated cells. B–E Migration and invasion assay for indicated ccRCC cells (Magnification: 200×). t-test, *p < 0.05, **p < 0.01,***p < 0.001, ****p < 0.0001. F The expression change of EMT markers in indicated cells.
Using transwell experiments to determine migration and invasion potential. Similarly, overexpression of CDK3 could partially reverse the SLC27A2-induced inhibition of migration and invasion (Fig. 7B–E). And siCDK3 could partially reverse the siSLC27A2-induced promotion of migration and invasion (Fig. S3B–E). As a result, a consistent conclusion about the effects of EMT signaling on ccRCC could be drawn. Overexpression of SLC27A2 alone significantly reduces epithelial-to-mesenchymal transition (EMT). As a result, overexpression of CDK3 and low expression of CDK3 can significantly promote and inhibit the transfer of the EMT pathway. To put it another way, overexpressing CDK3 could effectively counteract the physiologic consequences of SLC27A2 and knocking down CDK3 could counteract the physiologic consequences of siSLC27A2 (Fig. 7F and Fig. S3F). We could deduce that SLC27A2 inhibit ccRCC progression mainly through the CDK3-mediated EMT signaling pathway.
Discussion
Accumulated evidence indicates that SLC27A2 is significantly underexpressed in various human malignancies, including ovarian, prostate, and lung cancers. Previous studies have shown that SLC27A2 in ovarian and lung cancers alleviates their resistance to chemotherapeutics. Conversely, SLC27A2 can promote cancer cell proliferation and migration in thyroid cancer. These findings imply that SLC27A2 may have a role in a variety of cancers. Different tumor microenvironments and genetic backgrounds may influence SLC27A2’s physiological roles in different cancers. The function of SLC27A2 in RCC, on the other hand, is unknown.
SLC27A2 was discovered to be downregulated in renal cell carcinoma tissues and cell lines, which matches numerous prior results from other cancer types. Our results suggested that SLC27A2 may inhibit migration and invasion. We used qRT-PCR and western blotting to evaluate the expression of EMT-associated markers in RCC cell lines to better know the fundamental molecular pathways by which SLC27A2 prevents RCC metastasis. The results confirmed that the protein level of epithelial cell marker E-cadherin in renal cell carcinoma cell lines was up-regulated when SLC27A2 was overexpressed. In contrast, the mesenchymal cell markers N-cadherin, Vimentin, and Snail were down-regulated when overexpressing SLC27A2, suggesting that the EMT process is inhibited during renal cell carcinoma progression. Moreover, we knocked down the expression of SLC27A2 using siRNA in renal cancer cells and observed the opposite changes of EMT markers. In vivo, overexpreesion of SLC27A2 could inhibit tumor growth. Thus, SLC27A2 may prevent RCC from migrating and invading by suppressing EMT.
The whole transcriptome sequencing showed that the increased expression of SLC27A2 can lead to the downregulation of CDK3, and it has been reported that CDK3 promotes the EMT process in colorectal cancer. Therefore, we speculated that SLC27A2 affected the EMT process through CDK3 and perform a series of experiments to validate the hypothesis. However, our study has some limitations. SLC27A2 is involved in lipid formation and fatty acid degradation and can turn free long-chain fatty acids to fatty acyl-CoA esters. Based on the prior findings of our investigation, we speculated that SLC27A2 has a regulative function in the aberrant metabolic process of ccRCC, particularly lipid metabolism. Our next study will focus on the relationship between SLC27A2 and lipid metabolism in ccRCC.
In summary, SLC27A2 expression is diminished in ccRCC, and this lower SLC27A2 expression may accelerate tumor progression through CDK3-mediated EMT. In addition, SLC27A2 has the potential to become a new diagnostic marker and prognostic factor for ccRCC, providing novel options for treating ccRCC.
Conclusion
Our work collectively highlights the vital role of SLC27A2 in regulating EMT signaling through CDK3 in ccRCC metastasis and suggests that functional inhibition of SLC27A2-CDK3-EMT axis may be an attractive therapeutic target for metastasis of ccRCC.
Materials and methods
Cell culture and reagents
The American Type Culture Collection (ATCC, USA) provided the human renal carcinoma cell lines A498, 786-0, CAKI, OSRC, and 293 as well as the normal cell line 293 for this study [17]. Cells were cultured in DMEM high glucose media supplemented with 10% fetal bovine serum (FBS) and 1% penicillin-streptomycin in a 5% CO2 incubator at 37 °C [18].
Cell infection and transfection
SLC27A2 overexpression lentivirus and the matching control vector were transfected in CAKI and 786-O cell lines by Polybrene (Genechem) and Enhanced Infection Solution (Genechem) according to the producer’s instructions. Protein lysates and total RNA were gathered 4 days after transfection for western blot and qRT-PCR verification of transfection effectiveness. When transfecting the plasmid, 3 µg of CDK3 plasmid was transfected into approximately 3 × 10⁶ cells by Lipofectamine 3000 (Invitrogen, CA, USA). 5 µg siRNA for SLC27A2 and CDK3 were transfected into approximately 3 × 10⁶ cells by Lipofectamine 3000 (Invitrogen, CA, USA). Protein lysates and total RNA were obtained 48 h after transfected for western blot and qRT-PCR verification of transfection effectiveness.
Clinical renal cancer samples
Clinical kidney cancer samples were collected from patients in the Department of Urology, Union Hospital, Wuhan, China, who had a partial or radical nephrectomy. CcRCC samples were taken and paired with normal kidney tissues in the adjacent area. Tissue samples were frozen in −80 °C for follow-up research like RNA extractions or Western Blots. The patient had not received anticancer therapy prior to surgery. The Human Research Ethics Committee of Huazhong University of Science and Technology (Wuhan, China) approved this study and experimental protocols, and all patients provided written informed consent [18].
IHC assay
The 4 µM formalin-fixed paraffin-embedded tissue slices were incubated for 12 h at 4 °C with a rabbit antibody against SLC27A2 (1:100) [19, 20]. The portion was then washed in PBS. 50 µl DAKO secondary antibody per section was used for immunodetection, and the sections were incubated with secondary antibodies at 25 °C for around 2 h. We chose three random fields under a light microscope at magnifications of 200× and 400×.
RNA extraction and qRT-PCR
Total RNA was isolated from tissues and cell lines using the TRizol reagent (Thermo; Massachusetts, USA) [21, 22]. 1 μg enriched RNA was used to synthesize cDNA through reverse transcription, which the HiScript Q RT SuperMix accomplished for qPCR (Vazyme; Nanjing, CHN) [18, 23]. The HiScript II, One Step qRT-PCR SYBR Green Kit (Vazyme; Nanjing, CHN) was used for qPCR analysis by Analytikjena qPCR System (Analytikjena; GER). Samples were normalized by β-Actin.
Western blotting experiments
Proteins from cells and tissues was obtained using radio-immunoprecipitation assay (RIPA) protein lysis buffer (Beyotime Institute of Biotechnology, Haimen, China) with added protease inhibitor cocktail and PMSF. 30 µg protein was subjected to SDS-PAGE gel [24]. Sorting the proteins was done using gel electrophoresis, and the proteins were then transferred to polyvinylidene fluoride (PVDF) membranes. The membranes were occluded at room temperature using 5% nonfat dried skimmed milk. Then, the membranes of targeted protein were reacted overnight with corresponding primary antibodies. Lastly, the membranes were removed in PBST to remove unbound antibody and then incubated with rabbit mAb or mouse mAb (HRP-conjugated Affinipure Goat Anti-Mouse IgG (H + L) and HRP-conjugated Affinipure Goat Anti-Rabbit IgG (H + L) were purchased from Proteintech and deliquated 1:3000). The antibodies used for western blots were: SLC27A2(1:2000; Abclonal, A1077), CDK3 (1:4000; Proteintech, 55103-1-AP), N-Cadherin (1:2000; Abclonal, A0433), E-Cadherin Rabbit (1:1000; Abclonal, A11509), Vimentin (1:2000; Abclonal, A11952), Snail (1:2000; Abclonal, A5243), and β-Actin (1:200000; Abclonal, AC026) [25].
Whole transcriptome sequencing
As before reported [17, 26], total RNA was isolated by TRizol reagent (Thermo; Massachusetts, USA). The Agilent 2100 Bioanalyzer was used to assess RNA integrity (Agilent Technologies, Santa Clara, CA, USA). Following RNA extraction, purification, and library creation, paired-end sequencing on these libraries was performed using Next-Generation Sequencing technology on the Illumina sequencing platform. PANOMIX, China, supplied whole transcriptome sequencing techniques and procedures.
Cell viability assays
2 × 10³ cells were grown in 96-well plates for the cell viability test. The CCK8 technique was used to determine the cell proliferation rate. Cell viability was evaluated at 0, 1, 2, 3, and 4 days upon treatments at 450 nm [27, 28].
Migration and invasion assays
Cells were collected 2 days after transfection and resuspended in serum-free media. 3 × 10⁴ cells in serum-free medium were planted into the Boyden Transwell chambers (Corning; New York, USA) with 8-μm membrane filters for migration, whereas 6 × 10⁴ cells in serum-free medium were planted into the mentioned chambers, which were pre-coated with Matrigel (Thermo Fisher Scientific; Waltham, USA) for invasion. In advance, the chambers were placed on 24-well plates with a complete medium containing 10% FBS [29]. After 24 h at 37 °C with 5% CO2, the cells on the top portion were erased, while those on the bottom part were fixed in 100% methyl alcohol and dyed with 0.05 % crystal violet [30]. Below a microscope, cells were observed under a light microscope. All test was carried out three times in a row.
Bioinformatics analysis
The Cancer Genome Atlas Kidney Clear Cell Carcinoma (TCGA-KIRC) database [31] was used to obtain clinical and Hiseq data used for univariate and multivariate Cox proportional hazard regression. We selected the differentially expressed genes (DEGs) of KIRC using the “limma” [32] package with parameters of adjusted p < 0.05 and log2 | FC | > 2 according to methods from previous articles [33, 34]. GSE40435 and GSE29609 data were downloaded from the NCBI-GEO database. Differential expression of SLC27A2 mRNA in three RCC datasets, including Gumz Jones and Lenberg, was obtained from the Oncomine database [35]. Detailed clinical information and characteristics of TCGA-KIRC could be downloaded from the Xena [36].
The major targets were overall survival (OS) and disease-free survival (DFS). The period from diagnosis and death, or reviewed at the last follow-up, was used to determine OS. The time between diagnosis or surgery and progression of disease or death at the last follow-up was designated as DFS. The KM curves of OS and DFS were plotted using GraphPad Prism 6.0. Overall survival analyses of seven candidate downstream genes were perfomed using online tools GEPIA [37].
According to the grouping, the GSEA software [38] was conducted for enrichment analysis. The relevant enriched pathways were thought to be p < 0.05, and the false discovery rate (FDR) value < 0.25.
Statistical analysis
Excel 2016 (Microsoft) and SPSS 22.0 were used for all statistical analyses (IBM SPSS, Chicago, IL). All in vitro studies were repeated for three times, and all data were reported as mean SEM. The Student’s t-test and Pearson correlation coefficient were used in the statistical analysis. The significance value was determined with p < 0.05.
In vivo tumor transplantation
There were 6 male nude mice in both the experimental group and the control group. 2 × 10⁶ tumor cells (Caki) were subcutaneously injected into each nude mouse. We measured tumor size every 3 days, mice were sacrificed at day 21, tumor sizes and weights were measured. All animal experiments were approved by the Institutional Animal Use and Care Committee of Tongji Medical College, Huazhong University of Science and Technology.
Supplementary information
Acknowledgements
Wuhan Science and Technology Plan Application Foundation Frontier Project, Grant/Award Number: 2020020601012247; National Key Scientific Instrument Development Project, Grant/Award Number: 81927807; National Natural Science Foundation of China, Grant/Award Numbers: 81902588, 81874090; Key Research and Development Plan in China, Grant/Award Number: 2017YFB1303100; National Natural Science Foundation of China (NSFC) Grant [81773282 and 81672528].
Author contributions
HY, XZ, and XW designed this article. NX and WX performed the experiments and wrote the manuscript. XM and WL helped analyzed the data. All authors agreed to publish the manuscript.
Data availability
The public datasets used in the current study can be obtained from TCGA-KIRC, Xena websites and NCBI-GEO databases. The RNA sequence data about SLC27A2 in two cell lines can be obtained from the corresponding author upon reasonable request.
Competing interests
The authors declare no competing interests.
Ethics approval and consent to participate
All procedures performed in studies involving human participants were in accordance with the ethical standards of the Institutional Review Board of Huazhong University of Science and Technology (S175).
Consent for publication
All authors agreed to publish.
Footnotes
Publisher’s note Springer Nature remains neutral with regard to jurisdictional claims in published maps and institutional affiliations.
These authors contributed equally: Ning Xu, Wen Xiao.
Contributor Information
Xuegang Wang, Email: wangxuegang@xmu.edu.cn.
Xiaoping Zhang, Email: xzhang@hust.edu.cn.
Hongmei Yang, Email: hyang@hust.edu.cn.
Supplementary information
The online version contains supplementary material available at 10.1038/s41420-022-01145-8.
References
- 1.Xia C, Dong X, Li H, Cao M, Sun D, He S, et al. Cancer statistics in China and United States, 2022: profiles, trends, and determinants. Chin Med J (Engl) 2022;135:584–90. doi: 10.1097/CM9.0000000000002108. [DOI] [PMC free article] [PubMed] [Google Scholar]
- 2.Moch H, Cubilla AL, Humphrey PA, Reuter VE, Ulbright TM. The 2016 WHO classification of tumours of the urinary system and male genital organs-part A: renal, penile, and testicular tumours. Eur Urol. 2016;70:93–105. doi: 10.1016/j.eururo.2016.02.029. [DOI] [PubMed] [Google Scholar]
- 3.Capitanio U, Montorsi F. Renal cancer. Lancet (Lond, Engl) 2016;387:894–906. doi: 10.1016/S0140-6736(15)00046-X. [DOI] [PubMed] [Google Scholar]
- 4.Khan S, Cabral PD, Schilling WP, Schmidt ZW, Uddin AN, Gingras A, et al. Kidney proximal tubule lipoapoptosis is regulated by fatty acid transporter-2 (FATP2) J Am Soc Nephrology: JASN. 2018;29:81–91. doi: 10.1681/ASN.2017030314. [DOI] [PMC free article] [PubMed] [Google Scholar]
- 5.Su J, Wu S, Tang W, Qian H, Zhou H, Guo T. Reduced SLC27A2 induces cisplatin resistance in lung cancer stem cells by negatively regulating Bmi1-ABCG2 signaling. Mol Carcinogenesis. 2016;55:1822–32. doi: 10.1002/mc.22430. [DOI] [PubMed] [Google Scholar]
- 6.Chen FD, Chen HH, Ke SC, Zheng LR, Zheng XY. SLC27A2 regulates miR-411 to affect chemo-resistance in ovarian cancer. Neoplasma. 2018;65:915–24. doi: 10.4149/neo_2018_180122N48. [DOI] [PubMed] [Google Scholar]
- 7.Yi Y, Nandana S, Case T, Nelson C, Radmilovic T, Matusik RJ, et al. Candidate metastasis suppressor genes uncovered by array comparative genomic hybridization in a mouse allograft model of prostate cancer. Mol Cytogenetics. 2009;2:18. doi: 10.1186/1755-8166-2-18. [DOI] [PMC free article] [PubMed] [Google Scholar]
- 8.Wang Y, Chen Y, Zhu B, Ma L, Xing Q. A novel nine apoptosis-related genes signature predicting overall survival for kidney renal clear cell carcinoma and its associations with immune infiltration. Front Mol Biosci. 2021;8:567730. doi: 10.3389/fmolb.2021.567730. [DOI] [PMC free article] [PubMed] [Google Scholar]
- 9.Singh M, Yelle N, Venugopal C, Singh SK. EMT: Mechanisms and therapeutic implications. Pharm Ther. 2018;182:80–94. doi: 10.1016/j.pharmthera.2017.08.009. [DOI] [PubMed] [Google Scholar]
- 10.Brabletz T, Kalluri R, Nieto MA, Weinberg RA. EMT in cancer. Nat Rev Cancer. 2018;18:128–34. doi: 10.1038/nrc.2017.118. [DOI] [PubMed] [Google Scholar]
- 11.Thiery JP, Acloque H, Huang RY, Nieto MA. Epithelial-mesenchymal transitions in development and disease. Cell. 2009;139:871–90. doi: 10.1016/j.cell.2009.11.007. [DOI] [PubMed] [Google Scholar]
- 12.Hofmann F, Livingston DM. Differential effects of cdk2 and cdk3 on the control of pRb and E2F function during G1 exit. Genes Dev. 1996;10:851–61. doi: 10.1101/gad.10.7.851. [DOI] [PubMed] [Google Scholar]
- 13.Ren S, Rollins BJ. Cyclin C/cdk3 promotes Rb-dependent G0 exit. Cell. 2004;117:239–51. doi: 10.1016/S0092-8674(04)00300-9. [DOI] [PubMed] [Google Scholar]
- 14.Lu J, Zhang ZL, Huang D, Tang N, Li Y, Peng Z, et al. Cdk3-promoted epithelial-mesenchymal transition through activating AP-1 is involved in colorectal cancer metastasis. Oncotarget. 2016;7:7012–28. doi: 10.18632/oncotarget.6875. [DOI] [PMC free article] [PubMed] [Google Scholar]
- 15.Wozniak MB, Le Calvez-Kelm F, Abedi-Ardekani B, Byrnes G, Durand G, Carreira C, et al. Integrative genome-wide gene expression profiling of clear cell renal cell carcinoma in Czech Republic and in the United States. PloS One. 2013;8:e57886. doi: 10.1371/journal.pone.0057886. [DOI] [PMC free article] [PubMed] [Google Scholar]
- 16.Edeline J, Mottier S, Vigneau C, Jouan F, Perrin C, Zerrouki S, et al. Description of 2 angiogenic phenotypes in clear cell renal cell carcinoma. Hum Pathol. 2012;43:1982–90. doi: 10.1016/j.humpath.2012.01.023. [DOI] [PubMed] [Google Scholar]
- 17.Xiong Z, Xiao W, Bao L, Xiong W, Xiao H, Qu Y, et al. Tumor cell “slimming” regulates tumor progression through PLCL1/UCP1-mediated lipid browning. Adv Sci (Weinh, Baden-Wurtt, Ger) 2019;6:1801862. doi: 10.1002/advs.201801862. [DOI] [PMC free article] [PubMed] [Google Scholar]
- 18.Xiao W, Xiong Z, Xiong W, Yuan C, Xiao H, Ruan H, et al. Melatonin/PGC1A/UCP1 promotes tumor slimming and represses tumor progression by initiating autophagy and lipid browning. J Pineal Res. 2019;67:e12607. doi: 10.1111/jpi.12607. [DOI] [PubMed] [Google Scholar]
- 19.Ji SQ, Yao L, Zhang XY, Li XS, Zhou LQ. Knockdown of the nucleosome binding protein 1 inhibits the growth and invasion of clear cell renal cell carcinoma cells in vitro and in vivo. J Exp Clin Cancer Res: CR. 2012;31:22. doi: 10.1186/1756-9966-31-22. [DOI] [PMC free article] [PubMed] [Google Scholar]
- 20.Cocco E, Leo M, Canzonetta C, Di Vito S, Mai A, Rotili D, et al. KAT3B-p300 and H3AcK18/H3AcK14 levels are prognostic markers for kidney ccRCC tumor aggressiveness and target of KAT inhibitor CPTH2. Clin Epigenetics. 2018;10:44. doi: 10.1186/s13148-018-0473-4. [DOI] [PMC free article] [PubMed] [Google Scholar]
- 21.Eikmans M, Rekers NV, Anholts JD, Heidt S, Claas FH. Blood cell mRNAs and microRNAs: optimized protocols for extraction and preservation. Blood. 2013;121:e81–89. doi: 10.1182/blood-2012-06-438887. [DOI] [PubMed] [Google Scholar]
- 22.Akhtar N, Haqqi TM. MicroRNA-199a* regulates the expression of cyclooxygenase-2 in human chondrocytes. Ann Rheum Dis. 2012;71:1073–80. doi: 10.1136/annrheumdis-2011-200519. [DOI] [PMC free article] [PubMed] [Google Scholar]
- 23.Xue D, Wang H, Chen Y, Shen D, Lu J, Wang M, et al. Circ-AKT3 inhibits clear cell renal cell carcinoma metastasis via altering miR-296-3p/E-cadherin signals. Mol Cancer. 2019;18:151. doi: 10.1186/s12943-019-1072-5. [DOI] [PMC free article] [PubMed] [Google Scholar]
- 24.Schrödter S, Braun M, Syring I, Klümper N, Deng M, Schmidt D, et al. Identification of the dopamine transporter SLC6A3 as a biomarker for patients with renal cell carcinoma. Mol Cancer. 2016;15:10. doi: 10.1186/s12943-016-0495-5. [DOI] [PMC free article] [PubMed] [Google Scholar]
- 25.Hoefflin R, Harlander S, Schäfer S, Metzger P, Kuo F, Schönenberger D, et al. HIF-1α and HIF-2α differently regulate tumour development and inflammation of clear cell renal cell carcinoma in mice. Nat Commun. 2020;11:4111. doi: 10.1038/s41467-020-17873-3. [DOI] [PMC free article] [PubMed] [Google Scholar]
- 26.Hu J, Chen Z, Bao L, Zhou L, Hou Y, Liu L, et al. Single-cell transcriptome analysis reveals intratumoral heterogeneity in ccRCC, which results in different clinical outcomes. Mol Ther: J Am Soc Gene Ther. 2020;28:1658–72. doi: 10.1016/j.ymthe.2020.04.023. [DOI] [PMC free article] [PubMed] [Google Scholar]
- 27.Li T, Cheng Y, Wang P, Wang W, Hu F, Mo X, et al. CMTM4 is frequently downregulated and functions as a tumour suppressor in clear cell renal cell carcinoma. J Exp Clin Cancer Res: CR. 2015;34:122. doi: 10.1186/s13046-015-0236-4. [DOI] [PMC free article] [PubMed] [Google Scholar]
- 28.Li JK, Chen C, Liu JY, Shi JZ, Liu SP, Liu B, et al. Long noncoding RNA MRCCAT1 promotes metastasis of clear cell renal cell carcinoma via inhibiting NPR3 and activating p38-MAPK signaling. Mol Cancer. 2017;16:111. doi: 10.1186/s12943-017-0681-0. [DOI] [PMC free article] [PubMed] [Google Scholar]
- 29.Zheng Z, Zhao F, Zhu D, Han J, Chen H, Cai Y, et al. Long non-coding RNA LUCAT1 promotes proliferation and invasion in clear cell renal cell carcinoma through AKT/GSK-3β signaling pathway. Cell Physiol Biochem: Int J Exp Cell Physiol, Biochem, Pharmacol. 2018;48:891–904. doi: 10.1159/000491957. [DOI] [PubMed] [Google Scholar]
- 30.Wang Q, Ding H, He Y, Li X, Cheng Y, Xu Q, et al. NLRC5 mediates cell proliferation, migration, and invasion by regulating the Wnt/β-catenin signalling pathway in clear cell renal cell carcinoma. Cancer Lett. 2019;444:9–19. doi: 10.1016/j.canlet.2018.11.024. [DOI] [PubMed] [Google Scholar]
- 31.Tomczak K, Czerwińska P, Wiznerowicz M. The Cancer Genome Atlas (TCGA): an immeasurable source of knowledge. Contemp Oncol (Pozn, Pol) 2015;19:A68–77. doi: 10.5114/wo.2014.47136. [DOI] [PMC free article] [PubMed] [Google Scholar]
- 32.Ritchie ME, Phipson B, Wu D, Hu Y, Law CW, Shi W, et al. limma powers differential expression analyses for RNA-sequencing and microarray studies. Nucleic acids Res. 2015;43:e47. doi: 10.1093/nar/gkv007. [DOI] [PMC free article] [PubMed] [Google Scholar]
- 33.Li W, Meng X, Yuan H, Xiao W, Zhang X. M2-polarization-related CNTNAP1 gene might be a novel immunotherapeutic target and biomarker for clear cell renal cell carcinoma. IUBMB Life. 2022;74:391–407. [DOI] [PubMed]
- 34.Li W, Meng X, Yuan H, Xiao W, Zhang X. A novel immune-related ceRNA network and relative potential therapeutic drug prediction in ccRCC. Front Genet. 2021;12:755706. doi: 10.3389/fgene.2021.755706. [DOI] [PMC free article] [PubMed] [Google Scholar]
- 35.Rhodes DR, Yu J, Shanker K, Deshpande N, Varambally R, Ghosh D, et al. ONCOMINE: a cancer microarray database and integrated data-mining platform. Neoplasia (N. Y, NY) 2004;6:1–6. doi: 10.1016/S1476-5586(04)80047-2. [DOI] [PMC free article] [PubMed] [Google Scholar]
- 36.Meng X, Yuan H, Li W, Xiao W, Zhang X. Biomarker screening and prognostic significance analysis for renal cell carcinoma. Int J Gen Med. 2021;14:5255–67. doi: 10.2147/IJGM.S325347. [DOI] [PMC free article] [PubMed] [Google Scholar]
- 37.Tang Z, Li C, Kang B, Gao G, Li C, Zhang Z. GEPIA: a web server for cancer and normal gene expression profiling and interactive analyses. Nucleic Acids Res. 2017;45:W98–w102. doi: 10.1093/nar/gkx247. [DOI] [PMC free article] [PubMed] [Google Scholar]
- 38.Subramanian A, Tamayo P, Mootha VK, Mukherjee S, Ebert BL, Gillette MA, et al. Gene set enrichment analysis: a knowledge-based approach for interpreting genome-wide expression profiles. Proc Natl Acad Sci USA. 2005;102:15545–50. doi: 10.1073/pnas.0506580102. [DOI] [PMC free article] [PubMed] [Google Scholar]
Associated Data
This section collects any data citations, data availability statements, or supplementary materials included in this article.
Supplementary Materials
Data Availability Statement
The public datasets used in the current study can be obtained from TCGA-KIRC, Xena websites and NCBI-GEO databases. The RNA sequence data about SLC27A2 in two cell lines can be obtained from the corresponding author upon reasonable request.


