

Abstract
Background and Aims:
Hepatocellular carcinoma (HCC) is characterized by racial/ethnic disparities in rates. Recent U.S. reports suggest that incidence has begun to decline, but it is not clear whether the declines have occurred among all groups, nor whether mortality has declined. Thus, the current study examined U.S. incidence and mortality between 1992-2018.
Approach and Results:
HCC incidence and incidence-based mortality data from the Surveillance, Epidemiology, and End Results program were used to calculate age-standardized rates by race/ethnicity, sex and age. Trends were analyzed using joinpoint regression to estimate annual percent change (APC). Age-period-cohort models assessed the effects on trends of age, calendar period, and birth-cohort. Overall, HCC incidence significantly declined between 2015-2018 (APC, −5.6%). While most groups experienced incidence declines, the trends were most evident among Asians/Pacific Islanders, women and individuals aged <50 years. Exceptions were the rates among non-Hispanic Black persons, which did not significantly decline (APC, −0.7), and among American Indians/Alaska Natives, which significantly increased (APC, +4.3%). Age-period-cohort modelling found that birth-cohort had a greater effect on rates than calendar period. Among the baby-boom cohorts, the 1950-1954 cohort had the highest rates. Similar to the overall incidence decline, HCC mortality rates declined between 2013-2018 (APC, −2.2%).
Conclusions:
HCC incidence and mortality rates began to decline for most groups in 2015, but persistent differences in rates continued to exist. Rates among non-Hispanic Black persons didn’t decline significantly, and rates among American Indians/Alaska Natives significantly increased, suggesting greater effort is needed to reduce the HCC burden among these vulnerable groups.
Keywords: incidence, mortality, age-period-cohort, hepatocellular carcinoma
BACKGROUND:
Hepatocellular carcinoma (HCC), the dominant histologic type of liver cancer, accounts for approximately 75% of all liver cancer cases.(1) Incidence and mortality rates of HCC began increasing in the U.S. around 1980.(2) It was widely speculated that a dominant driver of the upward trajectory in rates was the increased prevalence of chronic hepatitis C virus (HCV) infection among persons born during the baby boom years, 1945- 1965.(3) Based on earlier data from the Surveillance, Epidemiology, and End Results (SEER) registries, we previously forecast that HCC rates would continue to increase through 2030, although our analysis found that the risk was not equal among all baby boomers.(4) Recent publications, however, have reported that incidence began to plateau around 2010,(5) then started to decline several years later.(6) Whether the favorable HCC trends continued into 2018, and whether mortality rates, as well as incidence rates, have experienced a decline, isn’t clear. Thus, the purpose of the current study was to examine trends in HCC incidence and mortality in the U.S. by race/ethnicity, sex, age, and birth cohort between the years 1992 and 2018.
METHODS
Data sources
Data on HCC incidence and incidence-based mortality from 1992 through 2018 were obtained from the SEER-13 database, which covers approximately 13.4% of the U.S. population.(7) For sensitivity analyses, data for the period 2000-2018 were obtained from the SEER-18 database (27.8% of the population) and SEER-21 database (36.7% of the population). HCCs were identified using the International Classification of Diseases for Oncology (ICD-O), third edition, topography code C22 and morphology codes 8170-8175.
Statistical analysis
Age-standardized incidence (ASIR) and age-standardized mortality (ASMR) rates per 100,000 person-years (py) were computed for 27 calendar years (1992-2018), using SEER*Stat version 8.3.9 (Information Management Services; Silver Spring, MD). Rates were estimated overall and by race/ethnicity (non-Hispanic White [NHW], non-Hispanic Black [NHB], Hispanic, Asian/Pacific Islander [API], American Indian/Alaska Native [AIAN]), sex, and age at diagnosis (<50 years, 50-69 years and 70-84 years). All rates were adjusted by the direct method to the 2000 U.S. standard population (19 age groups). Corresponding standard errors and 95% confidence intervals (CIs) were calculated.(8)
HCC incidence and mortality trends were plotted for the entire period (1992-2018) on a semi-log scale to facilitate comparison of current rates and temporal trends.(9) Joinpoint regression analysis was used to calculate the annual percent change (APC), the average annual percent change (AAPC), and their 95% confidence intervals (95% CIs) using the National Cancer Institute’s Joinpoint Regression Program (version 4.9.0.0). Joinpoint regression identifies statistically significant trend change points (joinpoints) and the rate of change in each trend segment using a Monte Carlo permutation method.(10) A maximum number of four joinpoints was allowed. A segment was considered significant if the slope of the regression line was statistically different from zero (p<0.05). Sensitivity analyses were conducted using the SEER-21 registry database for the HCC incidence trends, and the SEER-18 registry database for the HCC incidence-based mortality trends, as incidence-based mortality data are not available in the SEER-21 registry database.
To visualize trends by birth-cohort, age-specific HCC incidence rates by birth year were plotted. Age-period-cohort models were used to evaluate the effects on rates of age, period (calendar year of diagnosis), and birth-cohort. Age-period-cohort modelling fits a log-linear model with a Poisson distribution to the observed data to estimate age, period, and cohort effects in a multiplicative model: log ʎa,p = f(a) + g(p) + h(c).(11) This equation assumes that the expected log-incidence and log-mortality rates ʎa,p are equal to a linear combination of time-related variables or effects that adjust for age (a), calendar year (p) and birth cohort (c), where cohort=period-age.(11) In order to address the non-identifiability problem due to the linear dependency of each time-related variable on the other two variables, two-effect models, an age-period model and an age-cohort model, were first selected and the remaining effect (cohort and period, respectively) was then fit to the respective model’s residual using natural splines to reduce random variation.(11) Four degrees of freedom/knots for age, seven for cohort, and two for period were used in the models. The best-fit models were determined on the basis of the Akaike information criterion (AIC). The age-period-cohort analysis was performed using the Epi package in R statistical software, version 4.0.3.
RESULTS
In 2018, the overall incidence rate of HCC was 5.91 per 100,000 person-years (Table 1). Rates were over three times higher among men (ASIR, 9.65) than women (ASIR, 2.69). Among racial/ethnic groups, rates were highest among AIAN persons (ASIR, 9.27), followed in declining order by Hispanic persons (ASIR, 8.88), NHB persons (ASIR, 8.21), API persons (ASIR, 8.08), and NHW persons (ASIR, 4.29). Although 63% of the cases occurred among persons aged 50-69 years, the highest incidence rates were experienced by persons aged 70-84 years.
Table 1.
Age-standardized incidence rates (ASIR) and 95% CIs of hepatocellular carcinoma overall and by sex, race/ethnicity and age in the U.S., SEER-13 Registries, 1992-2018
| 1992 | 2018 | Joinpoints | APC (%) Trends | AAPC | |||||||||
|---|---|---|---|---|---|---|---|---|---|---|---|---|---|
| Cases | ASIR | 95% CI | Cases | ASIR | 95% CI | 1 | 2 | 1 | 2 | 3 | % | 95% CI | |
|
|
|
|
|
|
|||||||||
| 925 | 2.96 | (2.77, 3.15) | 3,177 | 5.91 | (5.70, 6.13) | 2009 | 2015 | 4.8* | 0.9 | −5.6* | 2.6* | (2.1, 3.2) | |
| Sex | |||||||||||||
| Men | 662 | 4.79 | (4.42, 5.18) | 2,411 | 9.65 | (9.26, 10.05) | 2011 | – | 4.6* | −2.1* | – | 2.8* | (2.4, 3.1) |
| Women | 263 | 1.51 | (1.33, 1.70) | 766 | 2.69 | (2.50, 2.90) | 2013 | – | 3.7* | −3.7* | – | 2.2* | (1.5, 2.9) |
| Race/ethnicity | |||||||||||||
| Non-Hispanic White | 428 | 1.82 | (1.65, 2.00) | 1,427 | 4.29 | (4.06, 4.52) | 2013 | – | 4.8* | −3.5* | – | 3.2* | (2.8, 3.6) |
| Non-Hispanic Black | 103 | 4.07 | (3.30, 4.94) | 430 | 8.21 | (7.43, 9.05) | 2009 | – | 5.6* | −0.7 | – | 3.3* | (2.7, 4.0) |
| Hispanic | 126 | 4.86 | (4.01, 5.83) | 667 | 8.88 | (8.19, 9.61) | 2012 | – | 4.2* | −3.5* | – | 2.3* | (1.7, 3.0) |
| Asian/Pacific Islander | 261 | 10.84 | (9.51, 12.28) | 589 | 8.08 | (7.43, 8.77) | 2010 | – | 1.0* | −4.7* | – | −0.8* | (−1.4, −0.2) |
| American Indian/Alaska Native | -- | 3.14 | (0.99, 6.99) | 48 | 9.27 | (6.75, 12.42) | – | – | 4.3* | – | – | 4.3* | (2.9, 5.7) |
| Age at diagnosis, yrs | |||||||||||||
| <50 | 128 | 0.52 | (0.43, 0.62) | 120 | 0.42 | (0.35, 0.51) | 1998 | 2006 | 9.3* | 2.0 | −5.7* | −0.1 | (−1.3, 1.2) |
| 50-69 | 411 | 6.94 | (6.28, 7.65) | 1,896 | 16.83 | (16.08, 17.62) | 2011 | 2016 | 5.9* | −0.4 | −10.7* | 3.3* | (2.7, 4.0) |
| 70-84 | 345 | 14.96 | (13.42, 16.62) | 999 | 28.83 | (27.06, 30.68) | 2011 | – | 3.7* | −0.4 | – | 2.6* | (2.2, 3.0) |
Abbreviations: 95%CI, 95% Confidence Interval; APC, annual percent change; AAPC, average annual percent change; ASR, age-standardized incidence rate
Asterisk denotes that the trend was statistically different from zero at alpha=0.05
Cases may not add up to total due to unknown race/ethnicity categories (data not shown)
Between 1992 and 2018, incidence increased through the first decade of the 21st century, then began to decline in most groups (Table 1). The overall decline in incidence began in 2015 (APC: −5.6%). Both sexes experienced the decline in rates, but the decline was more pronounced among women (APC2013-2015: −3.7%) than men (APC2011-2018: −2.1%). Among racial/ethnic groups, significant declines in incidence were observed among API persons (APC2010-2018: −4.7%), Hispanic persons (APC2012-2018: −3.5%), and NHW persons (APC2010-2018: −3.5%). While a slight decline was observed in the more recent years among NHB persons (APC2009-2018: −0.7%), the decline was not statistically significant. In contrast to the trends among the other racial/ethnic groups, incidence among AIAN persons significantly increased across the entire time interval (APC1992-2018: 4.3%).
The analysis by age group found that incidence significantly decreased among the two younger age groups. While the decline began earlier for persons aged <50 years (APC2006-2018: −5.7%), the decline was more notable among individuals aged 50-69 years old (APC2016-2018: −10.7%). While a downturn in rates was also seen among persons aged 70-84 years, the decrease was not statistically significant (APC2011-2018: −0.4%). Incidence rates plotted by sex, race/ethnicity and age are displayed in Figure 1.
Figure 1.
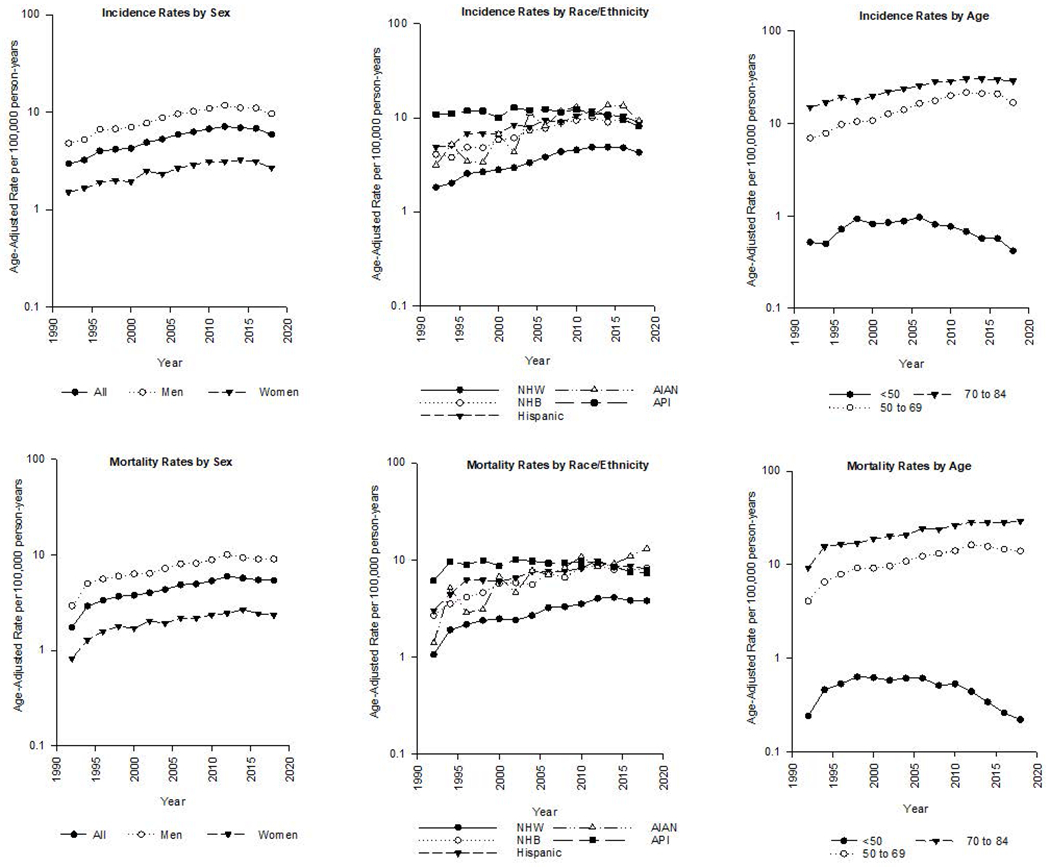
Age-adjusted rates per 100,000 person-years by sex, race and/or ethnicity of HCC incidence (top) and mortality (bottom), 1992-2018.
Table 2 displays the incidence-based mortality rates for the period 1992-2018. In the most recent year, 2018, the mortality rate was 5.39 per 100,000 py. Overall, the mortality rates were very similar to the incidence rates, with men (ASMR, 9.02) having higher rates than women (ASMR, 2.33), and AIAN persons (ASMR, 13.09) having higher rates than NHB persons (ASMR, 8.25), Hispanic persons (ASMR, 8.07), API persons (ASMR, 7.32), and NHW persons (ASMR, 3.80). Sixty percent of the HCC deaths occurred among persons 50-69 aged years, but the highest mortality rate (ASMR, 29.11) was experienced by persons aged 70-84 years.
Table 2.
Age-standardized incidence-based mortality rates (ASMR) and 95% CIs of hepatocellular carcinoma overall and by sex, race /ethnicity and age in the U.S., SEER-13 Registries, 1992-2018
| 1992 |
2018 |
Joinpoints |
APC (%) Trends |
AAPC |
|||||||||
|---|---|---|---|---|---|---|---|---|---|---|---|---|---|
| Deaths | ASMR | 95% CI | Deaths | ASMR | 95% CI | 1 | 2 | 1 | 2 | 3 | % | 95% CI | |
|
|
|
|
|
|
|||||||||
| 542 | 1.74 | (1.60, 1.90) | 2,889 | 5.39 | (5.20, 5.60) | 1994 | 2013 | 29.0* | 3.4* | −2.2* | 4.1* | (3.2, 5.0) | |
| Sex | |||||||||||||
| Men | 396 | 2.92 | (2.63, 3.22) | 2,224 | 9.02 | (8.64, 9.42) | 1994 | 2012 | 26.9* | 3.6* | −1.3* | 4.1* | (3.1, 5.1) |
| Women | 146 | 0.82 | (0.70, 0.97) | 665 | 2.33 | (2.16, 2.52) | 1995 | 2014 | 20.6* | 2.6* | −2.7 | 3.7* | (2.3, 5.0) |
| Race/ethnicity | |||||||||||||
| Non-Hispanic White | 252 | 1.06 | (0.93, 1.20) | 1,272 | 3.80 | (3.59, 4.03) | 1994 | 2014 | 28.0* | 3.9* | −2.5 | 4.5* | (3.0, 6.1) |
| Non-Hispanic Black | 69 | 2.68 | (2.07, 3.39) | 417 | 8.25 | (7.45, 9.11) | 2010 | – | 4.8* | −0.8 | – | 3.1* | (2.1, 4.1) |
| Hispanic | 77 | 3.01 | (2.35, 3.79) | 595 | 8.07 | (7.40, 8.77) | 1996 | 2013 | 14.1* | 2.9* | −2.5 | 3.4* | (1.7, 5.2) |
| Asian/Pacific Islander | 141 | 6.09 | (5.09, 7.22) | 532 | 7.32 | (6.71, 7.98) | 1994 | 2012 | 24.3* | −0.2 | −4.5* | 0.4 | (−1.1, 2.0) |
| American Indian/Alaska Native | -- | 1.39 | (0.23, 4.14) | 65 | 13.09 | (9.99, 16.83) | – | – | 4.8* | – | – | 4.8* | (3.4, 6.2) |
| Age at diagnosis, yrs | |||||||||||||
| <50 | 59 | 0.24 | (0.18, 0.31) | 61 | 0.22 | (0.16, 0.28) | 1999 | 2010 | 9.8* | −2.2* | −9.6* | −1.5 | (−3.1, 0.1) |
| 50-69 | 241 | 4.07 | (3.57, 4.62) | 1,585 | 13.99 | (13.30, 14.70) | 1994 | 2013 | 26.3* | 4.5* | −3.1* | 4.5* | (3.3, 5.8) |
| 70-84 | 214 | 9.29 | (8.08, 10.63) | 1,005 | 29.11 | (27.33, 30.98) | 1994 | 2013 | 26.9* | 3.1* | −0.3 | 4.1* | (2.9, 5.4) |
Abbreviations: 95%CI, 95% Confidence Interval; APC, annual percent change; AAPC, average annual percent change
Asterisk denotes that the trend was statistically different from zero at alpha=0.05
Cases may not add up to total due to unknown race/ethnicity categories (data not shown)
Overall trends in HCC mortality were similar to the trends in incidence rates, with rates declining significantly between 2013 and 2018 (APC: −2.2%) (Table 2). Similar to HCC incidence, declines in mortality rates were observed among both sexes (men, APC2012-2018: −1.3%; women, APC2014-2018: −2.7%), and among NHW persons (APC2014-2018: −2.5%), Hispanic persons (APC2013-2018: −2.5%) and API persons (APC2012-2018: −4.5%). While mortality rates among NHB persons slightly declined starting in 2010 (APC2010-2018: −0.8%), mortality rates among AIAN persons continued to increase through the entire time period (APC1992-2018: 4.8%). By age group, significant declines in mortality rates were observed among individuals <50 years old (APC2010-2018: −9.6%) and 50-69 years old (APC2013-2018: −3.1), while rates among persons 70-84 years plateaued starting in 2013 (APC2013-2018: −0.3).
Results of the incidence trend analysis using the SEER-21 data were similar to those using the SEER-13 data, as shown in Supplementary Table 1. As with the SEER-13 data, significant declines in rates were observed overall, for both sexes, for Hispanic persons, API persons and NHW persons and for persons age <50 years and 50-69 years. While there was a decline in rates starting in 2016 among NHB persons, the decline was not statistically significant. Conversely, for AIAN persons, there was a significant increase in incidence between 2000 and 2018. Results for the incidence-based mortality analysis using the SEER-18 data are shown in Supplementary Table 2. The analysis found a plateau in mortality for the most recent years (APC2013-2018: −0.4%), but no significant decline in the overall mortality rates. Significant declines were only observed among API persons (APC: −3.5%) and individuals aged 50-69 years (APC: −1.4%).
Figure 2a shows the age-specific incidence rates in 10-year groups for persons born between 1908 and 1984. In general, age specific rates were notably higher in the baby boomer cohorts than in the other birth cohorts. Figure 2b displays a closer examination of just the baby-boom cohorts broken into 5-year groups. Incidence rates were notably higher for persons born between 1950-1954 than they were for the other baby-boomers. This is particularly true for HCCs diagnosed starting at age 55 years.
Figure 2.
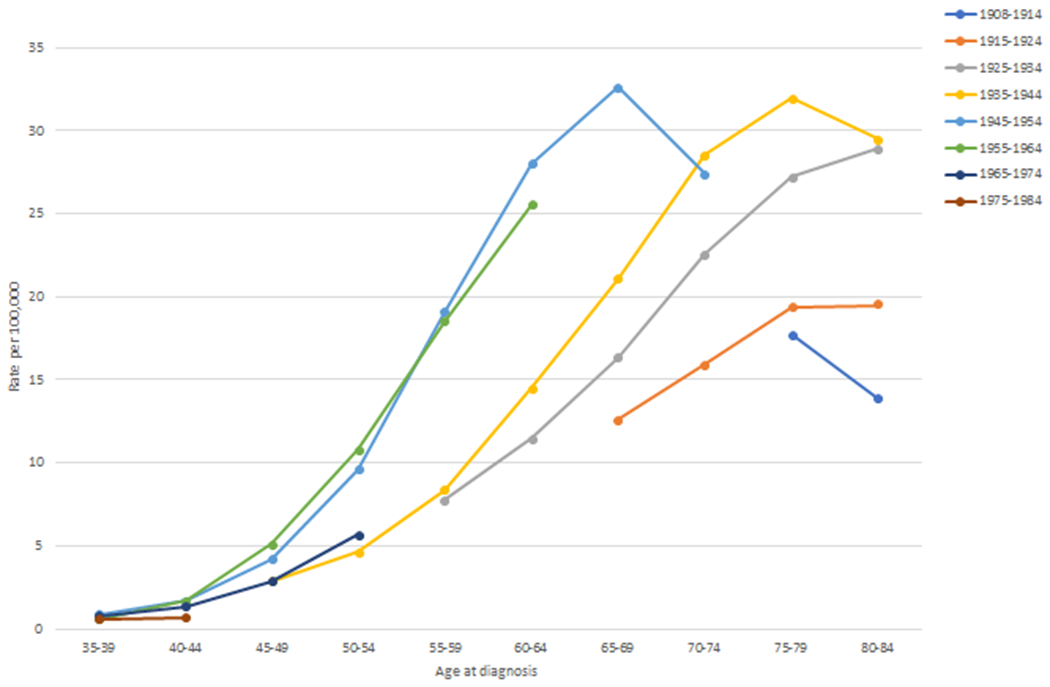

(a) Age-specific hepatocellular carcinoma incidence rates per 100,000 person-years by 10-year birth-cohorts (1908-1984); (b) Age-specific hepatocellular carcinoma incidence rates per 100,000 person-years by 5-year birth-cohorts (1945-1964).
The results of the age-period-cohort analyses are shown in Table 3. For all analyses, age-cohort models provided the best fit, indicated by lower AIC values. These results suggest that birth cohort had a greater influence on HCC incidence and mortality rates than did calendar period of diagnosis.
Table 3.
AIC values for the Age-Cohort, Age-Period, and Age-Period-Cohort models relative (difference) to the age only model for HCC incidence and mortality
| Age-Period-Cohort trend for incidence | ||||||||
|---|---|---|---|---|---|---|---|---|
|
|
||||||||
| All | Men | Women | NHW | NHB | Hispanic | AIAN | API | |
| AICa | AICa | AICa | AICa | AICa | AICa | AICa | AICa | |
|
|
||||||||
| Age-Cohort | 1466.25 | 1099.9 | 460.84 | 963.09 | 431.32 | 607.52 | 355.36 | 413.29 |
| Age-Period-Cohort | 1472.25 | 1103.9 | 466.84 | 969.09 | 435.32 | 613.52 | 361.36 | 419.29 |
| Age-Period | 3463.53 | 2937.93 | 769.24 | 2235.92 | 1308.47 | 892.7 | 372.09 | 616.92 |
| Age-Period-Cohort trend for mortality | ||||||||
|
|
||||||||
| All | Men | Women | NHW | NHB | Hispanic | AIAN | API | |
| AICa | AICa | AICa | AICa | AICa | AICa | AICa | AICa | |
|
|
||||||||
| Age-Cohort | 971.58 | 753.52 | 462.89 | 777.04 | 381.85 | 489.69 | 340.73 | 391.03 |
| Age-Period-Cohort | 977.58 | 759.52 | 468.89 | 783.04 | 387.85 | 495.69 | 346.73 | 397.03 |
| Age-Period | 2802.423 | 2280.37 | 719.28 | 1914.28 | 1086.62 | 750.01 | 350.72 | 616.89 |
Note. Relative values that weight the goodness of fit of the model to empirical data. A better model fit is indicated by lower AIC values (in bold).
Abbreviations: A, age; AIAN, American Indian/Alaska Native; AIC, Akaike information criteria; API, Asian/Pacific Islander; C, cohort; HCC, hepatocellular carcinoma; ICC, intrahepatic cholangiocarcinoma; NHB, non-Hispanic black; NHW, non-Hispanic white, P, period.
−2 x log (likelihood) + 2 x number of estimated parameters.
DISCUSSION
The current study found that the overall incidence of HCC began to decline in the U.S. starting in 2015. The decline in rates was more pronounced among API persons, women and individuals aged 50-69 years. Despite the generally favorable trends, rates did not decline significantly among NHB persons and continued to increase among AIAN persons. Overall trends in HCC mortality were similar to the incidence trends. For both HCC incidence and mortality, age-period-cohort analyses found that birth cohort had a greater effect on rates than did calendar period. In addition, age-specific rates in the 1950-1954 birth cohort were higher than rates among other baby-boom birth cohorts.
Although it has been widely suggested that rates of HCC are continuing to increase in the U.S., evidence of the beginning of a decline has recently been noted. Rich et al., examining SEER data for the years 1992-2015, reported that HCC incidence rates had declined among younger adults of both sexes and all races/ethnicities.(5) In addition, our group, examining SEER data for the years 1992-2016, reported that HCC rates had significantly declined between 2011-2016.(6) These findings, as well as the current findings through 2018, are in contrast to a prior report of our group that predicted HCC incidence rates would increase in the until at least 2030.(4) The predictions were based on SEER data through 2012, however, so preceded the year (2015) in which the downturn occurred. While that forecast is not supported by more recent data, reasons for the earlier than anticipated decline aren’t entirely clear. If the increase in HCC rates that started in 1980 was driven by HCV, declines in HCC rates could be related to the implementation of measures to prevent HCV transmission. These measures included testing of the blood supply, which started in 1990, universal precautions against the transmission of blood-born infectious agents, such as wearing of gloves during health care procedures, and regulation of tattoo and body piercing parlors. It is conceivable that the preventive measures had a greater effect on the 1955-1965 baby boomers, which would result in a lower risk of HCC than in the 1950-1954 baby boomers.
Whether HCV treatment, however, could have led to a decline in HCC rates is uncertain. While interferon therapy for HCV became available in the late 1990s, fewer than 50% of infected persons were cured and the treatment carried considerable unpleasant and toxic side effects which discouraged widespread use. In 2011, however, the first generation of oral Direct Acting Antiviral (DAAs) drugs were approved. As first generation DAAs necessitated concurrent administration with interferon, use was limited due to the interferon side effects. In 2015, use of next generation DAAs without interferon became available. Sustained virologic response (i.e., cure) rates of greater than 90% with only 8 to 12 weeks of therapy and lack of serious side effects enabled the more widespread uptake of therapy. A favorable effect on HCC rates, however, would not have been immediate. It’s also possible that HCC rates began to decline in 2015 because baby boomers born after 1954 were at lower risk than those born between 1950-1954. The lower risk may have resulted from measures to prevent HCV transmission
Factors other than HCV may have also been associated with the decline in HCC rates. For API persons in the US, many of whom had been born in hepatitis B virus (HBV) endemic countries, HBV was the leading risk factor for HCC.(12) The notable decline in HCC rates among API persons could be due to increased awareness, improved screening rates for HBV, vaccination of U.S. born API children and better care and treatment for persons with chronic HBV infection. Potent antiviral therapy available in the past 20 years, while not curative, can reduce the viral load to undetectable levels and has been shown to decrease risk for HCC.(13) In addition, recommendations for biannual surveillance of API persons with chronic HBV infection have likely contributed to the falling HCC mortality rates.(14)
As HBV and HCV have declined in importance as HCC risk factors in the U.S., nonalcoholic fatty liver disease (NAFLD) has increased. Among U.S. Hispanic and NHW persons, NAFLD is associated with a greater proportion of HCC than is any other risk factor.(15) As is shown in the current analysis, over 72% of the HCC cases in the U.S. in 2018 were among NHW and Hispanic persons. The risk of developing HCC among persons with NAFLD, however, is significantly lower than is the risk among persons infected with either HBV or HCV.(15) The progression from simple steatosis to nonalcoholic steatohepatitis (NASH), with its significantly higher risk of HCC, occurs among only 20% of persons with NAFLD. In addition, persons with NAFLD are at greater risk of mortality due to other causes than they are of HCC,(16) thus even an increased prevalence of NAFLD in the population would be unlikely to result in sharply increased rates of HCC in the future.(6) Another well-described risk factor for HCC, excessive alcohol consumption, also confers a lower risk of HCC than do other HBV an HCV (17), but there is little evidence of large changes in alcohol consumption patterns leading up to 2015. Finally, it is possible that changes in cirrhosis mortality rates have affected HCC incidence rates. As noted by a 2019 NIAAA report, cirrhosis mortality rates have been increasing since 2006.(18) As persons who die from cirrhosis can not go on to develop HCC, HCC incidence rates could decline as a result of an increase in cirrhosis mortality.(19)
While the current analysis found favorable trends in HCC incidence and mortality in many groups, the plateauing of rates among NHB persons and the continuing increase in rates among AIAN persons were also evident. These disparities in risk may be due to the greater prevalence of HCV infection among NHB and AIAN persons than among other racial/ethnic groups.(20, 21) As noted above, the risk of developing HCC related to HCV is much higher than the risk of HCC related to NAFLD. In addition, NHB and AIAN persons may have a higher prevalence of other risk factors (e.g., smoking, obesity, diabetes) and, for AIAN persons living in rural areas, poorer access to medical care. In this regard, the Indian Health Service (IHS), the principal federal agency tasked with providing healthcare to AIAN persons, spends approximately half the amount per capita on healthcare compared to per capita expenditures for federal inmates or Medicaid recipients.(22) However, in the past few years the IHS and Tribally owned and managed Health Care Organizations have launched an aggressive program to screen, identify and cure HCV, which may help to reverse the unfavorable trends in HCC. A plateauing of HCC incidence, and a decline in HCC mortality, have already been observed among Alaska Native persons.(23) In addition to HCV, Alaska Native persons are the only U.S. born population in which HBV was epidemic.(24) An aggressive HBV screening and universal vaccination program begun in the 1980’s, however, stopped transmission and prevented an increase in chronic HBV infections, the number of which is currently in the range of 1100 persons. As more extensive screening for HCV is implemented, with linkage to curative treatment of those infected, it is likely that HCV transmission rates and HCC incidence and mortality can be favorably affected.(25)
Similar to the HCC incidence trends, our study found that HCC mortality rates in the U.S. started declining in 2013. Overall, the mortality trends mirrored the incidence trends, consistent with the reality that the prognosis of HCC remains unfavorable.(26) As mortality is closely related to stage at diagnosis of HCC, improvement in mortality rates is directly related to identification and screening of high-risk persons. The AASLD Practice Guideline for HCC recommends biannual liver ultrasound and AFP testing for persons with cirrhosis of any etiology, or for some persons with chronic HBV infection, in which HCC can develop in the absence of cirrhosis.(14) At this time, the most effective therapy for advanced HCC is liver transplantation, although other approaches have also been shown to increase survival. In addition, many new immunologic therapies have been introduced in the past few years, some of which prolong survival, although most have significant side effects.(27) Improvement in the early diagnosis via better tumor markers than AFP, and better treatment regimens for advanced HCC, are necessary to improve prognosis of HCC.
The strengths of the current study include the use of high-quality, population-based data which permitted the exploration of racial/ethnic disparities and sex differences. In addition, the sensitivity analyses, which used databases with larger proportions of the population, produced results which were similar to the main results. Limitations of the study include that SEER has little information on HCC risk factors, making it challenging to determine which factors were linked to HCC in any group. In addition, Hispanic ethnicity, classified using the North American Association of Central Cancer Registries (NAACCR) Hispanic Identification Algorithm, may failed to classify some individuals correctly. (28) The NAACCR algorithm, however, has been shown to have high sensitivity (92.9), specificity (98.0), and positive predictive values (95.6).(29)
In conclusion, overall incidence and mortality rates of HCC started declining in the United States around 2015. Despite the declines, the risk among some racial/ethnic groups persisted. Further studies are important to elucidate the etiology of HCC in studies with heterogeneous racial/ethnic groups in order to inform prevention and early detection strategies for vulnerable groups.
Supplementary Material
Financial support statement:
This work was supported by the NIH Intramural Research Program, National Institutes of Health, Bethesda, MD
Footnotes
Conflict of interest: The authors have no conflicts to declare
References
- 1.Altekruse SF, Devesa SS, Dickie LA, McGlynn KA, Kleiner DE. Histological classification of liver and intrahepatic bile duct cancers in SEER registries. J Registry Manag 2011;38:201–205. [PMC free article] [PubMed] [Google Scholar]
- 2.Altekruse SF, McGlynn KA, Reichman ME. Hepatocellular carcinoma incidence, mortality, and survival trends in the United States from 1975 to 2005. J Clin Oncol 2009;27:1485–1491. [DOI] [PMC free article] [PubMed] [Google Scholar]
- 3.Smith BD, Morgan RL, Beckett GA, Falck-Ytter Y, Holtzman D, Teo CG, Jewett A, et al. Recommendations for the identification of chronic hepatitis C virus infection among persons born during 1945-1965. MMWR Recomm Rep 2012;61:1–32. [PubMed] [Google Scholar]
- 4.Petrick JL, Kelly SP, Altekruse SF, McGlynn KA, Rosenberg PS. Future of Hepatocellular Carcinoma Incidence in the United States Forecast Through 2030. J Clin Oncol 2016;34:1787–1794. [DOI] [PMC free article] [PubMed] [Google Scholar]
- 5.Rich NE, Yopp AC, Singal AG, Murphy CC. Hepatocellular Carcinoma Incidence Is Decreasing Among Younger Adults in the United States. Clin Gastroenterol Hepatol 2020;18:242–248 e245. [DOI] [PMC free article] [PubMed] [Google Scholar]
- 6.Petrick JL, Florio AA, Loomba R, McGlynn KA. Have incidence rates of liver cancer peaked in the United States? Cancer 2020;126:3151–3155. [DOI] [PMC free article] [PubMed] [Google Scholar]
- 7.Surveillance, Epidemiology, and End Results (SEER) Program (www.seer.cancer.gov) SEER*Stat Database: Incidence - SEER Research Data, 13 Registries, Nov 2020 Sub (1992-2018) - Linked To County Attributes - Time Dependent (1990-2018) Income/Rurality, 1969-2019 Counties, National Cancer Institute, DCCPS, Surveillance Research Program, released April 2021, based on the November 2020 submission. [Google Scholar]
- 8.Tiwari RC, Clegg LX, Zou Z. Efficient interval estimation for age-adjusted cancer rates. Stat Methods Med Res 2006;15:547–569. [DOI] [PubMed] [Google Scholar]
- 9.Devesa SS, Donaldson J, Fears T. Graphical presentation of trends in rates. Am J Epidemiol 1995;141:300–304. [DOI] [PubMed] [Google Scholar]
- 10.Kim HJ, Fay MP, Feuer EJ, Midthune DN. Permutation tests for joinpoint regression with applications to cancer rates. Stat Med 2000;19:335–351. [DOI] [PubMed] [Google Scholar]
- 11.Holford TR, Zhang Z, McKay LA. Estimating age, period and cohort effects using the multistage model for cancer. Stat Med 1994;13:23–41. [DOI] [PubMed] [Google Scholar]
- 12.Lok AS, McMahon BJ, Brown RS Jr., Wong JB, Ahmed AT, Farah W, Almasri J, et al. Antiviral therapy for chronic hepatitis B viral infection in adults: A systematic review and meta-analysis. Hepatology 2016;63:284–306. [DOI] [PubMed] [Google Scholar]
- 13.Varbobitis I, Papatheodoridis GV. The assessment of hepatocellular carcinoma risk in patients with chronic hepatitis B under antiviral therapy. Clin Mol Hepatol 2016;22:319–326. [DOI] [PMC free article] [PubMed] [Google Scholar]
- 14.Marrero JA, Kulik LM, Sirlin CB, Zhu AX, Finn RS, Abecassis MM, Roberts LR, et al. Diagnosis, Staging, and Management of Hepatocellular Carcinoma: 2018 Practice Guidance by the American Association for the Study of Liver Diseases. Hepatology 2018;68:723–750. [DOI] [PubMed] [Google Scholar]
- 15.Makarova-Rusher OV, Altekruse SF, McNeel TS, Ulahannan S, Duffy AG, Graubard BI, Greten TF, et al. Population attributable fractions of risk factors for hepatocellular carcinoma in the United States. Cancer 2016;122:1757–1765. [DOI] [PMC free article] [PubMed] [Google Scholar]
- 16.Paik JM, Henry L, De Avila L, Younossi E, Racila A, Younossi ZM. Mortality Related to Nonalcoholic Fatty Liver Disease Is Increasing in the United States. Hepatol Commun 2019;3:1459–1471. [DOI] [PMC free article] [PubMed] [Google Scholar]
- 17.West J, Card TR, Aithal GP, Fleming KM. Risk of hepatocellular carcinoma among individuals with different aetiologies of cirrhosis: a population-based cohort study. Aliment Pharmacol Ther 2017;45:983–990. [DOI] [PubMed] [Google Scholar]
- 18.Liver Cirrhosis Mortality in the United States: National, State, and Regional Trends, 2000-2017. November 2019, National Institute on Alcohol Abuse and Alcoholism, Division of Epidemiology and Preventioin Research, https://pubs.niaaa.nih.gov/publications/surveillance114/Cirr17.htm. [Google Scholar]
- 19.Persson EC, Quraishi SM, Welzel TM, Carreon JD, Gridley G, Graubard BI, McGlynn KA. Risk of liver cancer among US male veterans with cirrhosis, 1969-1996. Br J Cancer 2012;107:195–200. [DOI] [PMC free article] [PubMed] [Google Scholar]
- 20.Bradley H, Hall EW, Rosenthal EM, Sullivan PS, Ryerson AB, Rosenberg ES. Hepatitis C Virus Prevalence in 50 U.S. States and D.C. by Sex, Birth Cohort, and Race: 2013-2016. Hepatol Commun 2020;4:355–370. [DOI] [PMC free article] [PubMed] [Google Scholar]
- 21.Mera J, Joshi K, Thornton K, Box T, Scott J, Sedillo M, Deming P, et al. Retrospective Study Demonstrating High Rates of Sustained Virologic Response After Treatment With Direct-Acting Antivirals Among American Indian/Alaskan Natives. Open Forum Infect Dis 2019;6:ofz128. [DOI] [PMC free article] [PubMed] [Google Scholar]
- 22.Warne D Policy challenges in American Indian/Alaska Native health professions education. J Interprof Care 2007;21 Suppl 2:11–19. [DOI] [PubMed] [Google Scholar]
- 23.McMahon BJ, Rhoades ER, Heyward WL, Tower E, Ritter D, Lanier AP, Wainwright RB, et al. A comprehensive programme to reduce the incidence of hepatitis B virus infection and its sequelae in Alaskan natives. Lancet 1987;2:1134–1136. [DOI] [PubMed] [Google Scholar]
- 24.McMahon BJ, Schoenberg S, Bulkow L, Wainwright RB, Fitzgerald MA, Parkinson AJ, Coker E, et al. Seroprevalence of hepatitis B viral markers in 52,000 Alaska Natives. Am J Epidemiol 1993;138:544–549. [DOI] [PubMed] [Google Scholar]
- 25.McMahon BJ, Bulkow L, Harpster A, Snowball M, Lanier A, Sacco F, Dunaway E, et al. Screening for hepatocellular carcinoma in Alaska natives infected with chronic hepatitis B: a 16-year population-based study. Hepatology 2000;32:842–846. [DOI] [PubMed] [Google Scholar]
- 26.McGlynn KA, Petrick JL, El-Serag HB. Epidemiology of Hepatocellular Carcinoma. Hepatology 2021;73 Suppl 1:4–13. [DOI] [PMC free article] [PubMed] [Google Scholar]
- 27.Likhitsup A, Razumilava N, Parikh ND. Treatment for Advanced Hepatocellular Carcinoma: Current Standard and the Future. Clin Liver Dis (Hoboken) 2019;13:13–19. [DOI] [PMC free article] [PubMed] [Google Scholar]
- 28.NAACCR Race and Ethnicity Work Group (ed): NAACR Guideline for Enhancing Hipanic/Latino Identification: Revised NAACCR Hispanic/Latino Identification Algorithm [NHIA v2.2.2]. Springfield, IL, North American Association for Central Cancer Registries, 2010. [Google Scholar]
- 29.Boscoe FP, Schymura MJ, Zhang X, Kramer RA. Heuristic algorithms for assigning Hispanic ethnicity. PLoS One 2013;8:e55689. [DOI] [PMC free article] [PubMed] [Google Scholar]
Associated Data
This section collects any data citations, data availability statements, or supplementary materials included in this article.