

Abstract
Hyaluronic acid is a polysaccharide endowed with distinctive biological and physiological competencies. Given its queer properties, hyaluronic acid has exclusive praxis in the cosmetics and medical industries. The surmounting demand for hyaluronic acid is the propulsion behind the necessity for finding the amenable ways for its production. Fermentation progression of Streptococcus zooepidemicus is reckoned as the superlative prompt and ambient approach for hyaluronic acid fabrication. For the unabated advancements in the industrial production of hyaluronan, industrial byproducts utilization is a fateful stile. The recent perusal is to optimize the fermentation production conditions of hyaluronic acid using cane molasses (a byproduct of sugar production) as a carbon source. The impact of different ranges of temperatures (33–41 °C), pH (6–8), and agitation rates (100–250 rpm) on the production process was calibrated using RSM using CCD as a statistical modality. In a 3.7 L bioreactor, 3.31 g/L hyaluronic acid was achieved at 9.74 percent molasses, 36.2 °C, pH 6.46, and a 207 rpm agitation rate using a batch fermentation technique. With a pH of 7, HPLC was conducted at 25 °C using a C18 column at a rate of 0.8 ml/min, and the wavelength was determined using a UV detector. The average retention time was 2.202 min. The FT-IR spectrum's output was also observed, and it matched the standard hyaluronic acid well.
Keywords: Streptococcus zooepidemicus, Molasses, Hyaluronic acid, Fermentation
Introduction
A non-sulfated glycosaminoglycan named hyaluronic acid, which is frequently referred to as hyaluronan has gained much attention in the present worldwide market due to its cosmetics and medical applications (Radaeva et al. 1997; Lapcık et al. 1998; Chong et al. 2005). Market estimates place HA's global sales at 9.1 billion US dollars in 2019, and the CAGR from 2016 to 2027 is expected to be 8.1% (Size 2020). It has recently been reported that it is possible to produce HA from microorganisms, which opens up the possibility of a more straightforward, economically better way to produce HA, without a limit on raw materials, and in an environmentally friendly way (Yao et al. 2021). Moreover, an additional advantage of using the fermentation method is that purification is easy and free of hazardous solvents (Rangaswamy and Jain 2008; Choi et al. 2014).
Because the cost of producing HA is so high, developing a strategic fermentation condition is essential by taking reference to its biosynthetic pathway (Fig. 1). For a proper fermentation setup, a microbial strain and suitable culture conditions for its growth and product formation are required. HA production via batch fermentation is mainly done by Streptococci species, where HA, a polysaccharide, flicks to the fermented broth (Mausolf et al. 1990). A shift from batch-based HA production (Chen et al. 2009; Marcellin et al. 2009) to fed-batch has been observed; fermentation time was shortened with improved yield (Liu et al. 2008). For HA production, continuous mode fermentation minimizes waste by extending the growth cycle and reducing MW polydispersity (Huang et al. 2008; Wang et al. 2016). The best fermentation conditions (e.g., pH, temperature, agitation speed, etc.) and medium components (e.g., carbon, nitrogen, etc.) must be discovered and adjusted when constructing a production medium. Batch culture is preferable if the specific growth rate does not have any effect on metabolite production. In most of the research, the batch fermentation technique is applied for HA production (Armstrong and Johns 1997; Huang et al. 2006; Johns et al. 1994; Van de Rijn and Kessler 1980). The downstream processing methods use detergents to liberate the capsular HA, ethanol to precipitate the HA, and chromatography to separate HAs of different molecular weights (Cheng et al. 2016).
Fig. 1.

Biosynthetic pathway for hyaluronic acid
The current study aims to develop economic fermentation conditions for the increased production of HA by testing various substrates, for instance, sucrose, maltose, glucose, tapioca powder, corn powder, and molasses. An agro-industrial waste molasses contains an efficient amount of carbon source to be used as a low-cost energy source for fermentation. The effect of concentration of substrates, pH, temperature, agitation, and will also be studied. Statistical improvisation of the production procedure of HA was performed utilizing RSM that is vested on the CCD.
Materials and methods
Cultivation and fermentation conditions for microorganisms
Microbial type culture collection and Gene Bank (IMTECH), Chandigarh, India, was used to postulate the bacterial strain Streptococcus zooepidemicus MTCC 3523. The microbial culture was restored on the growth medium and corroborated in agar slants. S. zooepidemicus was cultivated aerobically in a 250 ml conical flask containing growth media. In an incubator shaker with 100 rpm, the temperature was maintained at 37 °C, and the bacterial culture with an initial pH of 6.8 was incubated for 24 h. Growth medium dwelled of (per liter), glucose 20 g, yeast extract 10 g, Dipotassium hydrogen phosphate 2 g, magnesium sulfate 1 g, sodium chloride 2 g. The growth medium was autoclaved at 121 °C for 15 min. After the revival of the culture, Todd Hewitt broth was minded with the assemblage of (per liter) pancreatic digest of protein 10 g, tryptone 20 g, glucose 2 g, sodium bicarbonate 2 g, sodium chloride 2 g, Dipotassium phosphate 0.4 g. Initial pH was maintained at 6.8 and temperature 37 °C with the incubation hours of 12 h. It was used as a seed culture in all fermentation investigations, whether they were done in a shake flask or a bioreactor.
The fermentation medium contained all of the ingredients necessary for excellent microbe growth and HA output. Glucose 50 g, yeast extract 5 g, tryptone 15 g, potassium dihydrogen phosphate 2 g, magnesium sulphate 0.5 g, Dipotassium hydrogen phosphate 0.5 g, ammonium sulphate 0.5 g, starting pH 6.8, temperature 37 °C (Don and Shoparwe 2010; Armstrong and Johns 1997). The fermentation medium was autoclaved for 15 min at 121 °C.
Batch fermentation took place in a 2.5-L bioengineering bioreactor with a 3.7-L capacity. A 5% (v/v) inoculum was supplemented to the autoclaved media, and the bioreactor was run at 37 °C with pH maintained at 6.8 with the help of 5 N NaOH. The agitation speed was achieved using an impellor with a speed of 100 rpm. Periodically, a 5 ml sample was supervened from the bioreactor aseptically and examined for the sugar, biomass, and hyaluronic acid concentrations.
Analytical procedures
Biomass and total sugar quantification
For determining the cellular biomass concentration, we applied the dry cell methodology (Liu et al. 2008). The sample was taken every 2 h and centrifuged at 8000 rpm before being dried in a hot air oven at 90 °C, as long as it reached a consistent weight. Total sugar estimation was apprized by phenol sulfuric methodology (Masuko et al. 2005). A UV Spectrophotometer (Shimadzu, Japan) was used to measure the absorbance of the samples at 540 nm.
Hyaluronic acid concentration
By adding an equivalent amount of 0.1 percent (v/v) SDS (sodium dodecyl sulphate) to the cultured broth sample, incubated for 10 min at 37 °C, centrifuged for 10 min at 8000 rpm, and the supernatant was retained. To precipitate HA, four volumes of 100% ethanol were used to separate the supernatant; it was then incubated at 4 °C for an hour. and then centrifuged for 10 min at 8000 rpm to yield HA pellets. It was then washed with ethanol twice or thrice and kept in saline for solubilization at 4 °C overnight. The cetyl trimethyl ammonium bromide (CTAB) method was applied to measure the concentration of hyaluronic acid (Chen and Wang 2009). 200 µL of HA pellets were mixed with an equal amount of 0.1 molL−1 acetic acid (pH 6) and 400 µL of 2.5% (w/v) cetyl trimethyl ammonium bromide in 0.5 M sodium hydroxide (CTAB). The absorbance was measured at 595 nm after 20 min of room temperature incubation. A standard curve was created using a 0.18 g per liter hyaluronic acid stock solution that was manufactured using standard bacterial hyaluronic acid.
The burgeoning of hyaluronic acid production
During fermentation processes, optimization of the production medium and process conditions determines the growth of the microbe and the quantity and quality of the product (Stanbury et al. 2013). The upsurging of the HA production process was performed using the statistical tool. To get the increased yield of the HA, parameters that were directly affecting the fermentation process were identified and optimized. The first factor which directly influences the process is the substrate used in the media. Different carbon substrates such as fructose, xylose, lactose, dextrose, maltose, molasses, corn powder, and tapioca powder were examined for production, and the one with the greatest yield was selected for the further optimization process. The other factors, for instance, inoculum percentage, temperature, and agitation speed were also optimized. To determine the interrelationship between the preferred criterion and enhance the HA production, the Response surface methodology based on the CCD was applied as a statistical technique (Saran et al. 2007; Himabindu et al. 2006). To establish the synergy between the determinants and responses, the data was investigated utilizing the Minitab 16 application and analysis of variance (ANOVA).
Numerical and statistical analysis
The kinetics of the bacterial cell growth (X) of S. zooepidemicus was represented utilizing the logistic equation below (Vázquez et al. 2010):
| 1 |
Here, X symbolizes the biomass output (g/L), vx symbolizes the maximum growth rate (g/L/h), Xm symbolizes the maximum biomass (g/L), and λx illustrates the growth lag phase (h).
In addition, to model HA production data, a logistic equation was applied (Vázquez et al. 2010):
| 2 |
Here, H symbolizes the HA fabrication rate (g/L/h), vH symbolizes the maximum HA production rate (g/L/h), Hm symbolizes the maximum HA concentration (g/L), λH symbolizes the HA production delay (h).
Using the equation below, the yield of HA manufacturing on biomass was calculated (Don and Shoparwe 2010).
| 3 |
The HA fabrication yield per biomass (g HA/g biomass) is represented as YH/x. To minimize the residual sum of squares, the Levenberg–Marquardt nonlinear least square approach was used to assess the parameters. Each experiment was replicated thrice, with the average results provided. The relevance of the parameters acquired by modifying the experimental values to the proposed mathematical models (Student’s t test with α = 0.05) and the consistency of these equations (Fisher’s F test with α = 0.05) were assessed using this program.
Optimization of fabrication of hyaluronic acid with RSM
The current study focuses on the fabrication of HA by S. zooepidemicus, intending to employ statistical techniques to optimize the production circumstances. Carbon supply, temperature, pH, and agitation rate were identified as the most critical factors influencing production. RSM established on the CCD was an effective statistical method for determining the synergy between the four preferred criteria and accelerating hyaluronic acid production. To establish the synergy between the determinants and responses, the data was examined utilizing the Minitab 16 application and analysis of variance (ANOVA).
HPLC and FTIR analysis
Hyaluronic acid produced by the process of fermentation was sampled and afore evaluated by working on high-performance liquid chromatography (Shimadzu, Japan). The collected specimen was thinned in 0.1 N HCl, refined through 0.2 µm filters, and examined using the C18 column (Harmita et al. 2020). The mobile phase used was water and methanol at a ratio of 96:4, and the solution was degassed for 30 min. The flow rate was confirmed at 1 mL per minute at a temperature of 25 °C, the output was unearthed at 280 nm wavelength using a UV visible detector, and the sample volume injected was 10 µl. The standard hyaluronic acid solution was prepared to dissolve 200 mg of HPLC grade authentic hyaluronic acid (HIMEDIA) in 100 mL of 0.1 N HCl and diluted to 10 µg per mL concentration (Harmita et al. 2020).
By applying the potassium bromide pellet technique, the FTIR analysis was performed by subjecting the dry powder of the sample to Infrared spectroscopy (Shimadzu, Japan). The sample was measured with KBr pellets (4 mg of sample and 196 mg of spectroscopic grade KBr). We obtained spectra from 4000 cm–1 to 400 cm–1. We received 64 scans per minute, 4 cm–1 resolution, and 64 scans per second (Carneiro et al. 2016).
Results and discussion
Microbial growth
Revival of the culture was done from the freeze-dried state on Growth Medium. Growth was observed in the aerobic batch fermentation process. A classical sigmoidal growth curve is observed in Fig. 2C, with a short lag phase (approximately 4 h) followed by an exponential, stationary, and death phase. As explained by Huang et al. that the growth and synthesis of hyaluronic acid are accounted to be measly in the lag phase as the bacterial cell takes time to adapt to a new broth culture environment (Huang et al. 2007). A high metabolic activity characterizes the exponential phase, as DNA, RNA, cell wall components, and other substances necessary for growth are generated for division. The stage is critical to HA's capsular synthesis (Zhang et al. 2016).
Fig. 2.

A S. zooepidemicus, B microscopic view of S. zooepidemicus, C graph representing growth of S. zooepidemicus, HA production and substrate uptake in growth medium
Hyaluronic acid production using one factor at a time method
The S. zooepidemicus MTCC 3523 was used to produce hyaluronic acid by a batch fermentation process performed in a 3.7 L bioengineering bioreactor. Carbon, the most prominent component of the medium, has a crucial role in the development and production of the metabolite was optimized using different carbon sources in the production process while keeping the other factors constant. Similarly, other inoculum percentages, pH, temperature, and agitation were also optimized, and a combination of them with the physiological state best for the product formation was achieved.
Impact of carbon provenance on hyaluronan yield
In a fermentation process, the carbon source is the principal constituent for developing the cellular material and hyaluronic acid production. Carbon sources used for the glycolytic pathway have a significant role in biomass production and in synthesizing the precursors of hyaluronan. Fabrication of hyaluronic acid is done by the bacteria in response to stress conditions produced during the fermentation process and is used as a barrier against the acidity or alkalinity of the medium (Pires and Santana 2010). The efficacy of varied carbon provenances on HA production was observed, as demonstrated in Fig. 3. The production medium was enriched with fructose, lactose, sugarcane molasses, corn powder, tapioca powder, sucrose, maltose, and dextrose. Amongst all, molasses were found to be the most productive, with a yield of 3.16 g/L followed by fructose with a production of 2.32 g/L. The lowest production was observed in xylose with a 0.93 g/L yield. Sugarcane molasses are the byproducts of the agricultural industries so the production cost will be lowered.
Fig. 3.
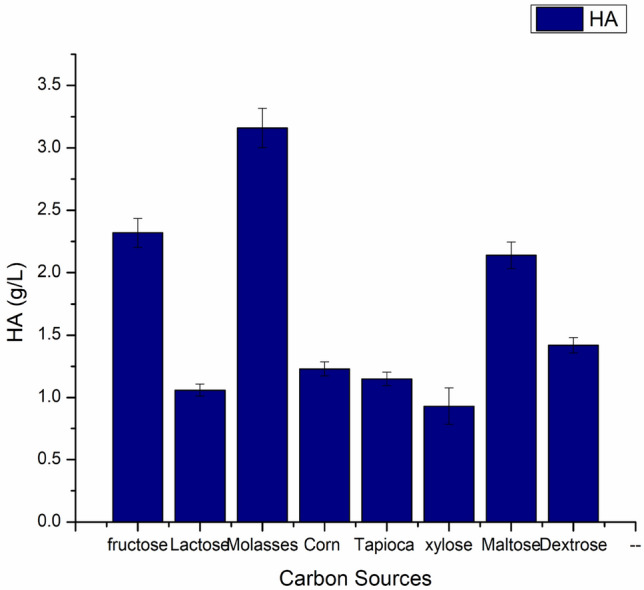
Efficacy of varied carbon provenances on HA production, while other factors were kept constant, pH 6.8, temperature 37 °C and agitation at 100 rpm
To minimize the residual sum of squares, the Levenberg–Marquardt nonlinear least square approach was used to assess the parameters. Each experiment was replicated thrice, with the average outcome provided.
The defined medium used to produce HA glucose concentration required was 50 g per liter. The carbon content of glucose is 40%, which means that in 1 gm of glucose, 0.4 g of carbon content is present, and similarly, for 50 g of glucose, 20 g of carbon content is present. The same amount of carbon content was used for the rest of the carbon sources utilized during the optimization process so that the HA produced could be assessed on a similar scale. Molasses and tapioca powder have a carbon content of around 24% (Samocha et al. 2007) and 40% (Mahariawan et al. 2020), respectively, and cornflour has a carbon content of approximately 46% (Zhu et al. 2015). Molasses is 75% carbs and 22% water, with no protein or fat. The total reducing sugar found in the molasses is approximately 17% (Awad El-Kareem 2003). Sucrose (29% carbohydrate), glucose (12%), and fructose (13%) are the sugars found in molasses (Curtin 1983).
Effect of molasses percentage
Molasses are the byproduct of the agriculture industry and are often used as a carbon source in the fermentation process. With distilled water, the recovered molasses were first diluted to 15% (w/v) of the total sugar concentration (Dubois et al. 1956). The supernatant was collected after 15 min of centrifugation at 10,000 rpm and 4 °C. The supernatant was then treated for 1 h at 70 °C with continual stirring with 12% (w/v) activated charcoal, centrifuged at 4 °C at 10,000 rpm, and filtered using a Whatman, n ° 1 filter (Treichel et al. 2009). Different molasses percentages were used in the medium, and hyaluronic acid production was recorded. The highest production was recorded at 10% molasses (v/v) with a yield of 3.19 g/L and the lowest at 15% with a 1.9 g/L yield, as shown in Fig. 4. The conditions previously specified in the CM medium were used to determine the optimum yields of HA per biomass in culture broth generated using agricultural byproduct molasses: regulated pH (6.8), agitation of 100 rpm, and temperature 37 °C. The carbon and nitrogen sources were 5, 7.5, 10, 12.5, and 15% v/v sugarcane molasses, respectively, while the other salts were the same as in the complex medium. These results were compared thoroughly and recorded that 10 percent molasses concentration gave the most satisfactory results of 3.19 ± 0.15, as shown in Table 1 in the production of HA and cell biomass 3.3 ± 0.16, as depicted in Figs. 5 and 6.
Fig. 4.

Effect of different molasses percentages on HA production and other factors were kept constant, pH 6.8, temperature 37 °C and agitation at 100 rpm
Table 1.
Results of non-linear adjustment of biomass (X) [Eq. (1)], and hyaluronic acid (HA) [Eq. (2)] time courses in the cultivation of S. zooepidemicus under different conditions
| Variables | Variations | ||||
|---|---|---|---|---|---|
| Agitation (rpm) | |||||
| Hyaluronic acid | 100 | 150 | 200 | 250 | 300 |
| HAm(g/l) | 1.69 ± 0.08 | 1.98 ± 0.09 | 2.65 ± 0.13 | 2.46 ± 0.12 | 2.24 ± 0.11 |
| V (g/lh) | 0.096 ± 0.004 | 0.1006 ± 0.005 | 0.164 ± 0.008 | 0.154 ± 0.007 | 0.138 ± 0.006 |
| λ (h) | 1.87 ± 0.09 | 0.32 ± 0.01 | 1.22 ± 0.06 | 1.24 ± 0.06 | 2.49 ± 0.12 |
| Yh/x (g g−1) | 0.62 ± 0.03 | 0.87 ± 0.04 | 1.02 ± 0.05 | 0.92 ± 0.04 | 0.97 ± 0.04 |
| p value | < 0.001 | < 0.001 | < 0.001 | < 0.001 | < 0.001 |
| r (obs-pred) | 0.983 | 0.978 | 0.984 | 0.981 | 0.987 |
| Biomass | |||||
| Xm(g/l) | 2.43 ± 0.12 | 2.63 ± 0.13 | 2.98 ± 0.14 | 2.78 ± 0.13 | 2.65 ± 0.13 |
| V (g/lh) | 0.144 ± 0.07 | 0.142 ± 0.007 | 0.154 ± 0.007 | 0.147 ± 0.007 | 0.137 ± 0.006 |
| λ (h) | 0.60 ± 0.003 | 1.22 ± 0.06 | 0.93 ± 0.04 | 0.102 ± 0.005 | 2.05 ± 0.1 |
| p value | < 0.001 | < 0.001 | < 0.001 | < 0.001 | < 0.001 |
| r (obs-pred) | 0.997 | 0.996 | 0.994 | 0.989 | 0.992 |
| Molasses | |||||
| Hyaluronic acid | 5% | 7.5% | 10% | 12.5% | 15% |
| HAm(g/l) | 2.48 ± 0.12 | 2.9 ± 0.14 | 3.19 ± 0.15 | 2.36 ± 0.11 | 1.9 ± 0.09 |
| V (g/lh) | 0.171 ± 0.008 | 0.222 ± 0.01 | 0.234 ± 0.01 | 0.192 ± 0.009 | 0.176 ± 0.008 |
| λ (h) | 2.28 ± 0.11 | 2.98 ± 0.14 | 2.99 ± 0.14 | 2.06 ± 0.1 | 1.55 ± 0.07 |
| Yh/x (g g−1) | 0.63 ± 0.03 | 0.74 ± 0.03 | 0.77 ± 0.03 | 0.73 ± 0.03 | 0.69 ± 0.03 |
| p value | < 0.001 | < 0.001 | < 0.001 | < 0.001 | < 0.001 |
| r (obs-pred) | 0.991 | 0.995 | 0.994 | 0.993 | 0.988 |
| Biomass | |||||
| Xm(g/l) | 2.91 ± 0.14 | 3.1 ± 0.15 | 3.3 ± 0.16 | 2.84 ± 0.14 | 2.84 ± 0.14 |
| V (g/lh) | 0.258 ± 0.01 | 0.242 ± 0.01 | 0.252 ± 0.01 | 0.229 ± 0.01 | 0.229 ± 0.01 |
| λ (h) | 0.42 ± 0.02 | 0.49 ± 0.02 | 0.29 ± 0.01 | 0.39 ± 0.01 | 0.38 ± 0.01 |
| p value | < 0.001 | < 0.001 | < 0.001 | < 0.001 | < 0.001 |
| r (obs-pred) | 0.997 | 0.997 | 0.998 | 0.998 | 0.982 |
| pH | |||||
| Hyaluronic acid | 6 | 6.5 | 7 | 7.5 | 8 |
| HAm (g/l) | 2.43 ± 0.12 | 2.79 ± 0.13 | 3.32 ± 0.16 | 2.23 ± 0.11 | 1.89 ± 0.09 |
| V (g/lh) | 0.155 ± 0.007 | 0.148 ± 0.007 | 0.167 ± 0.008 | 0.143 ± 0.11 | 0.113 ± 0.005 |
| λ (h) | 2.20 ± 0.11 | 1.50 ± 0.07 | 0.51 ± 0.02 | 1.13 ± 0.05 | 2.7 ± 0.13 |
| Yh/x (g g−1) | 0.60 ± 0.03 | 0.66 ± 0.03 | 0.84 ± 0.04 | 0.83 ± 0.04 | 0.68 ± 0.03 |
| p value | < 0.001 | < 0.001 | < 0.001 | < 0.001 | < 0.001 |
| r (obs-pred) | 0.989 | 0.985 | 0.977 | 0.986 | 0.991 |
| Biomass | |||||
| Xm (g/l) | 2.85 ± 0.14 | 2.99 ± 0.14 | 3.51 ± 0.17 | 2.78 ± 0.13 | 2.59 ± 0.12 |
| V (g/lh) | 0.252 ± 0.01 | 0.255 ± 0.01 | 0.210 ± 0.01 | 0.148 ± 0.007 | 0.134 ± 0.006 |
| λ (h) | 0.29 ± 0.01 | 0.27 ± 0.01 | 0.11 ± 0.005 | 0.060 ± 0.003 | 0.18 ± 0.009 |
| p value | < 0.001 | < 0.001 | < 0.001 | < 0.001 | < 0.001 |
| r (obs-pred) | 0.996 | 0.995 | 0.908 | 0.993 | 0.997 |
| Temperature (°C) | |||||
| Hyaluronic acid | 33 | 35 | 37 | 39 | 41 |
| HAm (g/l) | 2.64 ± 0.13 | 2.79 ± 0.13 | 3.29 ± 0.16 | 3.12 ± 0.15 | 2.78 ± 0.13 |
| V (g/lh) | 0.152 ± 0.007 | 0.144 ± 0.007 | 0.216 ± 0.01 | 0.203 ± 0.01 | 0.158 ± 0.007 |
| λ (h) | 2.52 ± 0.12 | 1.26 ± 0.06 | 3.01 ± 0.15 | 3.18 ± 0.15 | 2.67 ± 0.13 |
| Yh/x (g g−1) | 0.67 ± 0.03 | 0.79 ± 0.03 | 0.84 ± 0.04 | 0.78 ± 0.03 | 0.69 ± 0.03 |
| p value | < 0.001 | < 0.001 | < 0.001 | < 0.001 | < 0.001 |
| r (obs-pred) | 0.987 | 0.980 | 0.994 | 0.994 | 0.987 |
| Biomass | |||||
| Xm(g/l) | 2.93 ± 0.14 | 3.19 ± 0.15 | 3.35 ± 0.16 | 3.29 ± 0.16 | 2.94 ± 0.14 |
| V (g/lh) | 0.234 ± 0.01 | 0.223 ± 0.01 | 0.219 ± 0.01 | 0.20 ± 0.01 | 0.212 ± 0.01 |
| λ (h) | 0.96 ± 0.04 | 0.556 ± 0.02 | 0.12 ± 0.005 | 0.36 ± 0.01 | 0.43 ± 0.02 |
| p value | < 0.001 | < 0.001 | < 0.001 | < 0.001 | < 0.001 |
| r (obs-pred) | 0.996 | 0.997 | 0.995 | 0.997 | 0.996 |
Xm maximum biomass, HAm maximum hyaluronic acid production,V maximum hyaluronic acid production rate, λ (h) lag phase of hyaluronic acid production. The table also shows yields of hyaluronic acid on biomass (YH/X) calculated using Eq. (3). The determination coefficients (R2) and p values from Fisher’s F test for the mathematical are shown
Fig. 5.
Graph representing the theoretical and experimental values of cell biomass of S. zooepidemicus MTCC 3523 at different time intervals, to varying concentrations of molasses at pH 6.8, temperature 37 °C and agitation at 100 rpm
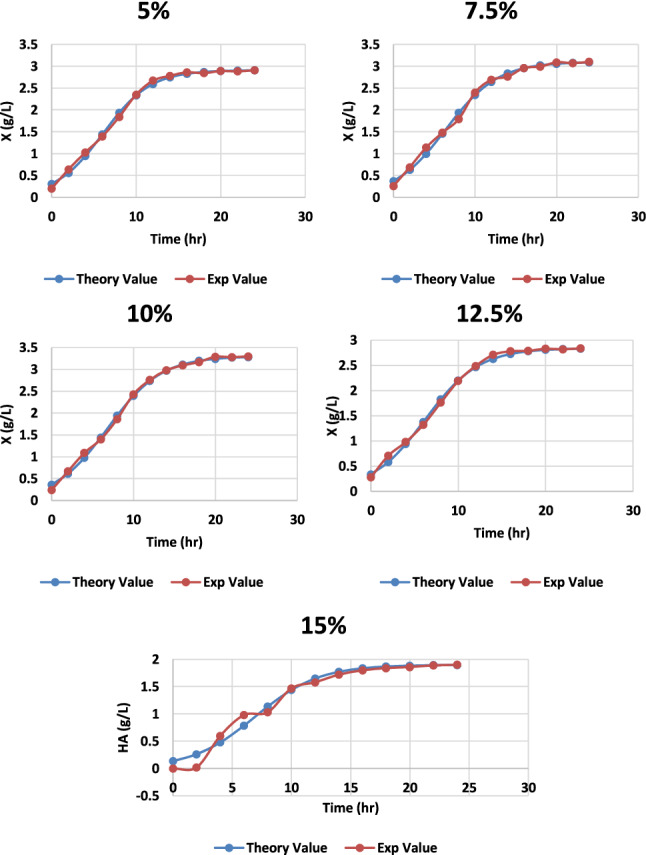
Fig. 6.
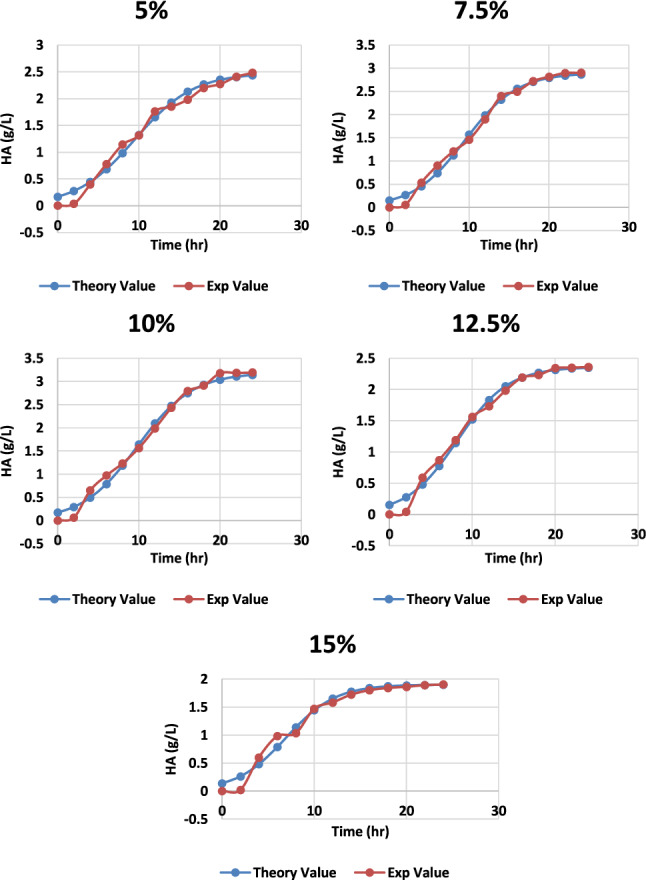
Graph representing the theoretical and experimental values of HA production from S. zooepidemicus at different time intervals, to varying concentrations of molasses at pH 6.8, temperature 37 °C and agitation at 100 rpm
Effect of temperature, pH, and agitation
When hyaluronic acid is produced by fermentation using S. zooepidemicus as a producer microorganism, a drop in pH was seen, primarily due to the formation of lactic acid, which resulted in lower microbial biomass and impeded hyaluronic acid production (Lu et al. 2016; Liu et al. 2011). Thus, optimization of pH helps in promoting the fabrication of hyaluronic acid. The pH levels covering 6.0 to 8.0 were examined to see how effective they increased hyaluronic acid synthesis. When the pH was increased, HA production also increased up to a certain level, and then a decrease was observed, with the pH becoming more alkaline. The best production was observed at pH 7 with the yield of 3.32 g/L, as shown in Fig. 7. The impact of controlled pH on HA production was investigated using cultures at 100 rpm with or without controlled pH (data not shown). The pH adjustment had a substantial impact on the maximal HA accumulation and yield. When correlated to non-regulated pH cultures with equal agitation rates, cultivation amid regulated pH resulted in a massive increase in maximal HA production. At 100 rpm and 37 °C temperature, the highest maximum HA output and cell biomass were recorded as 3.32 ± 0.16 and 3.51 ± 0.17 (Table 1) (Figs. 8, 9), respectively.
Fig. 7.
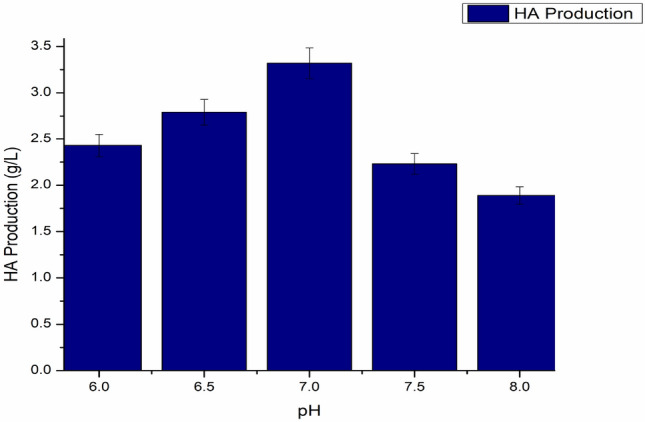
Effect of pH on HA production, temperature maintained at 37 °C, agitation 100 rpm
Fig. 8.

Graph representing the theoretical and experimental values of cell biomass of S. zooepidemicus at different time intervals, at different pH at 37 °C and agitation at 100 rpm
Fig. 9.
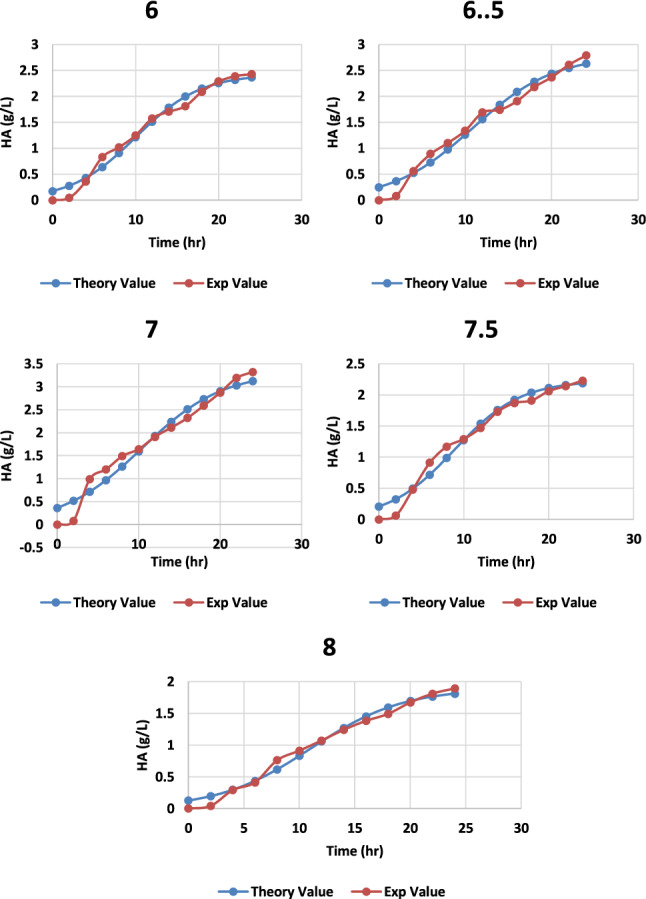
Graph representing the theoretical and experimental values of HA production from S. zooepidemicus MTCC 3523 at different time intervals, at different pH at temperature 37 °C and agitation at 100 rpm
Intracellular enzyme activity is primarily dependent on the temperature of the medium; a remarkable alteration in temperature can affect the growth of the microbe and also on the product synthesis (Vigetti et al. 2014). The effect of various temperatures was observed and found that at 37 °C the microbial growth and HA synthesis both are at its maximum with a HA fabrication of 3.29 g/L, as shown in Fig. 10. An increase in temperature caused minor damage to the cell biomass (Fig. 11) as it started dropping, and also HA production was affected (Fig. 12; Table1).
Fig. 10.
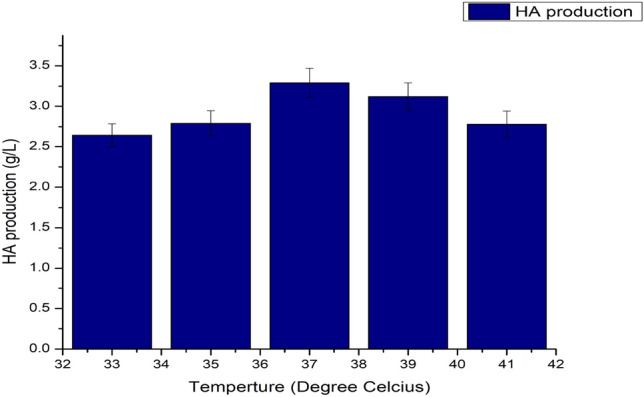
Impact of different temperature conditions on HA fabrication, pH maintained at 6.8 and agitation 100 rpm
Fig. 11.
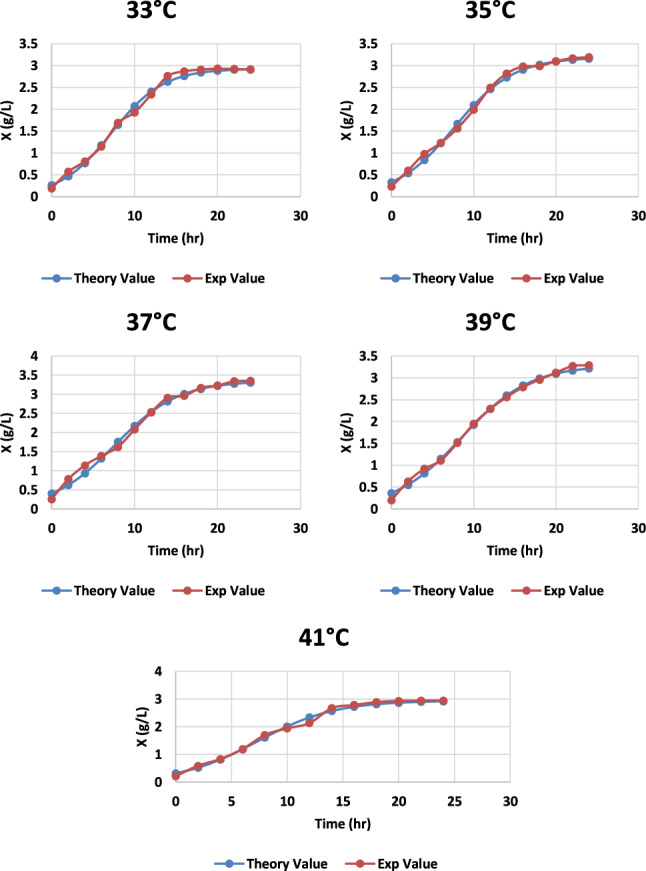
Graph representing the theoretical and experimental values of cell biomass of S. zooepidemicus at different time intervals, at a different temperature at pH 6.8, and agitation at 100 rpm
Fig. 12.
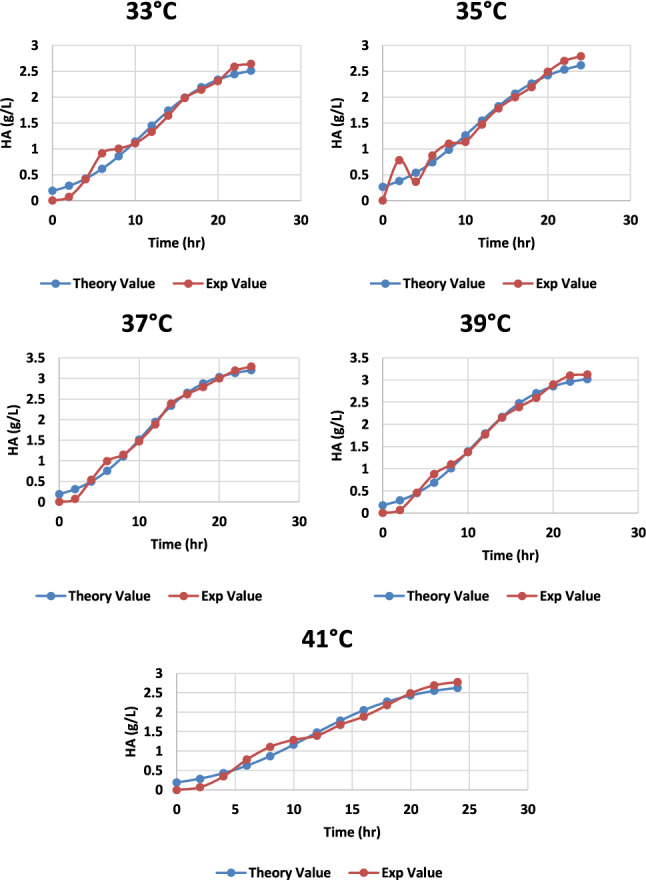
Graph representing the theoretical and experimental values of HA production from S. zooepidemicus at different time intervals, at a different temperature at pH 6.8, and agitation at 100 rpm
Because the synthesis of HA raises the viscosity of the broth, oxygen mass transfer and agitation rates have a significant impact on HA fabrication (Liu et al. 2011). Nevertheless, there seems to be no consensus on whether intense agitation boosts the generation of HA. In this context, it has been discovered in several investigations that increasing mixing speed reduces polysaccharide production rates (Kim et al. 1996), whereas others have observed the opposite (Johns et al. 1994). Although agitation is required for the transfer of nutrients and the elimination of lactate from the surrounding of the cell (Johns et al. 1994), increased agitation speeds might harm HA synthesis and the structure of the polymer (Johns et al. 1994).To examine the influence of agitation on the fabrication of HA, different agitation rates have been experimented, as shown in Fig. 13. The impact of the agitation on the yield of the product is a little complicated (Boeriu et al. 2013). The agitation speed is very closely interconnected to the heat and mass transfer in the fermentation broth, a high viscosity non-newtonian fluid. The viscosity here ranged between 0.59 and 0.67 Pa seconds. Agitation speed when increased from 150 to 200, the maximum hyaluronic acid production was achieved with the production of 2.65 g/L, anyhow the yield dropped a little when agitation speed was further enhanced to 250 rpm. The higher agitation speed may result in high shear stress that might cause damage to the microbial cell, cell biomass was affected (Fig. 14) and directed towards the hyaluronic acid degradation (Duan et al. 2008). Indeed, we found that raising the agitation rate from 100 to 300 rpm, and a significant decrease in HA production was observed after 200 rpm (Table1; Fig. 15).
Fig. 13.
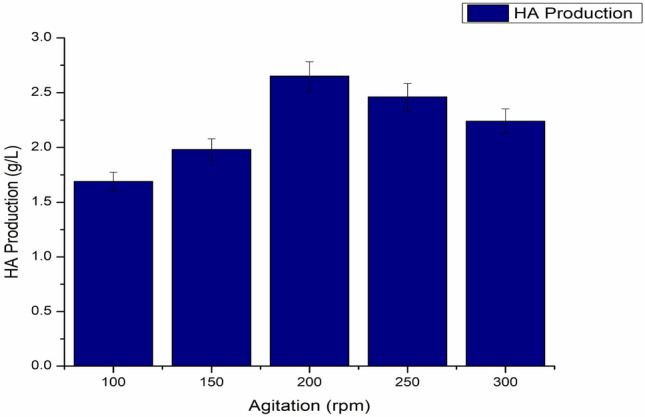
Impact of various agitation speed on HA fabrication, pH maintained at 6.8 and temperature 37 °C
Fig. 14.
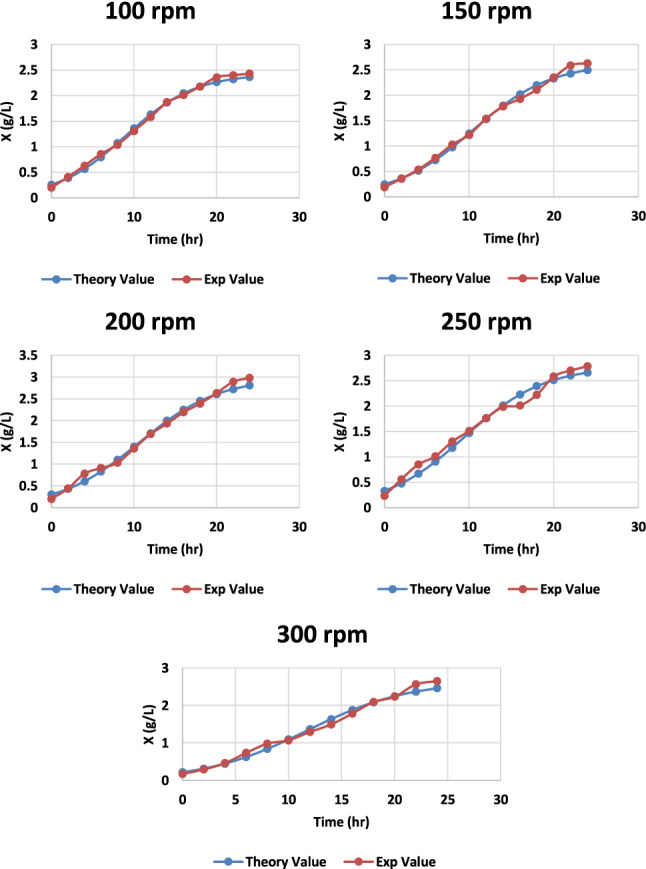
Graph representing the theoretical and experimental values of cell biomass of S. zooepidemicus at different time intervals, at different agitation rates at pH 6.8 and temperature 37 °C
Fig. 15.
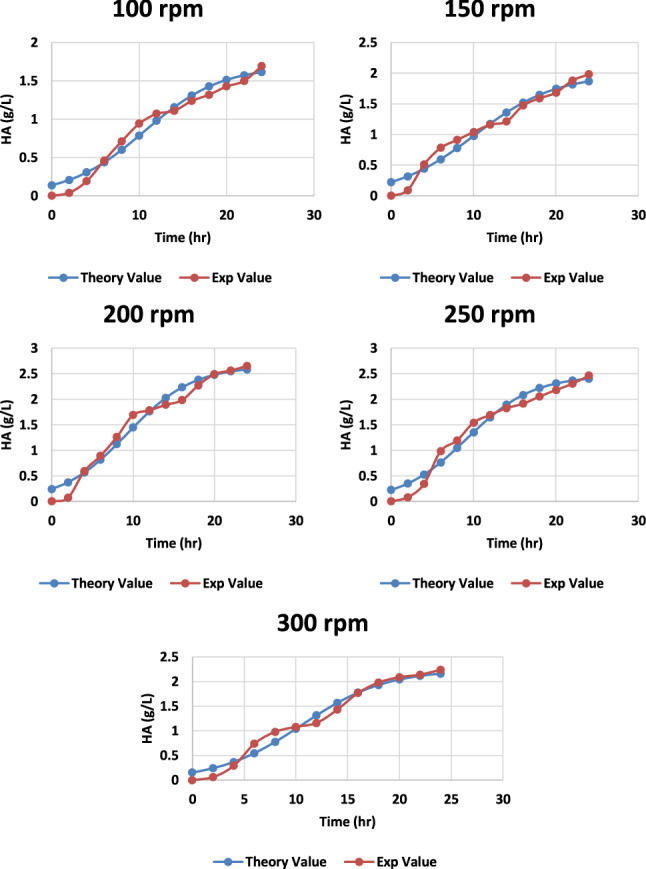
Graph representing the theoretical and experimental values of HA production from S. zooepidemicus at different time intervals, at different agitation rates at pH 6.8 and temperature 37 °C
Using logistic Eqs. (1) and (2), the experimental data (biomass: X and hyaluronic acid: H) were quantified and modeled. Higher R2 values indicate excellent agreement between theoretical and empirical data (Table 1). The Fisher’s F test p values demonstrated that the models adequately accounted for the experimental data. For all conditions analyzed (Student's t test, Table 2), the kinetic parameters described by Eqs. (1)–(3) were statistically significant.
Table 2.
ANOVA analysis of the response surface model
| Source | DFa | Adj SSb | Adj MSc | F | P |
|---|---|---|---|---|---|
| Regression | 14 | 7.277 | 0.519 | 19.87 | < 0.001 |
| Linear | 4 | 0.391 | 0.097 | 3.74 | 0.025 |
| Square | 4 | 5.165 | 1.291 | 49.37 | < 0.001 |
| Interaction | 6 | 1.720 | 0.286 | 10.96 | < 0.001 |
| Residual error | 16 | 0.418 | 0.026 | ||
| Lack of fit | 10 | 0.315 | 0.031 | 1.84 | 0.236 |
| Pure error | 6 | 0.103 | 0.017 | ||
| Total | 30 | 7.695 | |||
| R-Sq = 94.56% | R-Sq (adj) = 89.80% | ||||
aDegree of freedom
bSum of square
cMean of square
Optimization of HA concentration by RSM
In the current analysis, central composite design (CCD) of a two level four factors were bought in to the work for escalation of HA production. The borderlines of these tentative frameworks were picked up on the footing of lonesome criterion selection probation. The computative interpretation of HA production is given by
where A represents molasses, B represents temperature, C represents pH, and D represents agitation rate. According to regression analysis of empirical data, molasses exhibits positive synergic analysis with all determinants. ANOVA of the quadratic equation for HA fabrication was exemplified in Table 2. Because the model has a p value of 0.001, it is expected to be evincive. The model is evincive, as evidenced by the high values of the determination coefficient (R2 = 94.56%) and the adjusted determination coefficient (adjusted R2 = 89.80%). Figure 16 shows the RSM plots that show the effects of the pairwise amalgamation of the four components. The graphs in Fig. 16 give a clear picture of how any two factors interacted to influence the response.
Fig. 16.

Response Surface Plots for the correlative impacts of various factors on production of hyaluronic acid
ANOVA of response surface plots
To envision the fluctuation of the responses because of the synergy of the determinants, the equipped polynomial equation was articulated as 3-D surface plots. The effects of molasses, temperature, pH, and agitation rate on each other were studied with all of the synergistic studies, making it possible that molasses played a role in the manufacturing process. Table 2 depicts the RSM model’s ANOVA analysis.
The ANOVA analysis yielded a better-than-average score for HA production. The greatest projected generation of HA was 3.45 g/L at 9.74% molasses, 36.2 °C, pH 6.46, and a 207 rpm agitation rate. Experiments were run in triplicates to ensure that the results were accurate. Empirically, the maximum HA production was found to be 3.31 g/L, which was near to it. Lactic acid produced during the initial production process 2.32 g/L was reduced up to 40% after optimizing the HA production process.
The production of HA in a previously defined medium with glucose as a carbon source was replaced with the agricultural waste cane molasses. We tested different production conditions by varying the pH, temperature, and agitation rates, one at a time. We also tried different concentrations of molasses for the enhanced and better HA yield. If we compare the productivity with the molasses and the glucose, the overall productivity was improved with a final yield of 3.31 g/L. As reported, molasses contain different kinds of sugar. Sucrose is the primary sugar. A strong inhibition in the growth of S. zooepidemicus can be observed when we increased the concentration of molasses after a certain extent earlier reported (Liu et al. 2008). The inhibition of S. zooepidemicus growth in media containing molasses must be related to other components of this byproduct, such as lactic acid (Liu et al. 2008)and phenolic compounds (Takara et al. 2007), which have been known to be Streptococci inhibitors. Further molasses pre-treatment using an activated carbon resin to remove inhibiting chemicals and improve HA titer helped in the better HA production.
According to Jagannath and Ramachandra, replacing glucose with sucrose boosted HA productivity and molecular weight, and the rate of specific HA synthesis (Jagannath and Ramachandran 2010). Molasses, being the combination of different sugars, has been used in various studies earlier as a carbon source for HA production with different medium compositions (Amado et al. 2017) and suggested that the molasses are a better carbon source than glucose (Duffeck et al. 2020).
HPLC and FTIR analysis
HPLC verified the presence of hyaluronic acid in the fermented broth. The peak of hyaluronic acid was harmonized by comparing the sample's retention time to the HIMEDIA standard. There were few polar and nonpolar contaminants in the sample. HPLC examination of Standard hyaluronic acid and the sample revealed a similar chromatogram peak with a nearly identical retention period, as illustrated in Fig. 17. The chromatogram of the standard HA showed a peak retention time of 2.312 min, and the sample showed a retention time of 2.202 min. These results are pretty similar to the recent studies of HA detection by HPLC methods (Botha et al. 2018; Kašparová et al. 2018).
Fig. 17.
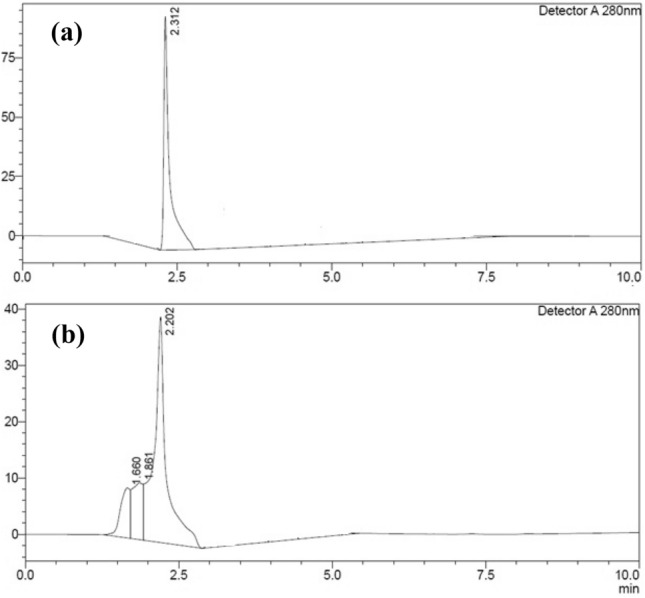
HPLC chromatogram of hyaluronic acid. A Standard and B fermented broth sample
The FTIR spectrum analysis showed the presence of functional groups in the hyaluronic acid. It is a practical approach for recognizing the organic compounds and functional groups by appraising the modulations amidst vibrational states of the bonds embodied in the molecules inwards. In the chromatogram, many peaks ranged from 623 to 3598 cm−1, and bandwidths differed based on their position. Various elevations ranged from 623 to 1129 cm−1, which might be because of C–O–C stretching (Pavia et al. 2010). The occupancy of the C–O group with C=O amalgamation is equivalent to the peak at1876.36 cm−1, and the peak at 1592.41 cm−1 denotes the amide group's impendence (Carneiro et al. 2016). C–H stretching is characterized by a peak at 2849.76 cm−1, while O–H stretching is 3598.24 cm−1. Figure 18 shows an FT-IR investigation that confirms the structure of hyaluronic acid, comprised of a repeating disaccharide unit of β D-glucuronic acid and β N-acetylglucosamine.
Fig. 18.

FT-IR chromatogram of A standard hyaluronic acid and B fermented broth sample
Conclusions
The progress of the improved fermentation manufacturing of HA using S. zooepidemicus MTCC 3523 is highlighted in this article. Using agro-industrial byproduct molasses and adapting the physical specifications of the fermentation conditions, a comprehensive investigation of the production process demonstrated that the fabrication of hyaluronic acid might be achieved and improved. The factorial design was utilized to alleviate the temperature, pH, carbon supply, and agitation rates, resulting in an improved fabrication of 3.31 g/L at molasses 9.74%, temperature 36.2 °C, pH 6.46 agitation rate 207 rpm.
Acknowledgements
The authors acknowledge the technical assistance offered by the Central Instrument Facility Center (CIFC) of IIT (BHU) Varanasi, India.
Abbreviations
- HA
Hyaluronic acid
- CM
Complex media
- HPLC
High-performance liquid chromatography
- CCD
Central composite design
- FT-IR
Fourier transform infrared
- RSM
Response surface methodology
Declarations
Conflict of interest
The authors have reported no conflicts of interest.
References
- Amado IR, Vázquez JA, Pastrana L, Teixeira JA. Microbial production of hyaluronic acid from agro-industrial byproducts: molasses and corn steep liquor. Biochem Eng J. 2017;117:181–187. [Google Scholar]
- Armstrong DC, Johns MR. Culture conditions affect the molecular weight properties of hyaluronic acid produced by Streptococcus zooepidemicus. Appl Environ Microbiol. 1997;63(7):2759–2764. doi: 10.1128/aem.63.7.2759-2764.1997. [DOI] [PMC free article] [PubMed] [Google Scholar]
- Awad El-Kareem E-FAA . Studies on the quality of sugar, molasses and treacle as products of sugarcane in the Sudan. UOFK: Lexington; 2003. [Google Scholar]
- Boeriu CG, Springer J, Kooy FK, van den Broek LA, Eggink G. Production methods for hyaluronan. Int J Carbohydr Chem. 2013 doi: 10.1155/2013/624967. [DOI] [Google Scholar]
- Botha C, Viktor Z, Moire C, Farcet C, Brothier F, Pfukwa H, Pasch H. Separation of hydrophobically modified hyaluronic acid according to the degree of substitution by gradient elution high performance liquid chromatography. Anal Bioanal Chem. 2018;410(18):4259–4273. doi: 10.1007/s00216-018-1123-6. [DOI] [PubMed] [Google Scholar]
- Carneiro J, Döll-Boscardin PM, Fiorin BC, Nadal JM, Farago PV, Paula JPd. Development and characterization of hyaluronic acid-lysine nanoparticles with potential as innovative dermal filling. Braz J Pharm Sci. 2016;52:645–651. [Google Scholar]
- Chen S-J, Chen J-L, Huang W-C, Chen H-L. Fermentation process development for hyaluronic acid production by Streptococcus zooepidemicus ATCC 39920. Korean J Chem Eng. 2009;26(2):428–432. [Google Scholar]
- Chen Y-H, Wang Q. Establishment of CTAB turbidimetric method to determine hyaluronic acid content in fermentation broth. Carbohyd Polym. 2009;78(1):178–181. [Google Scholar]
- Cheng F, Gong Q, Yu H, Stephanopoulos G. High-titer biosynthesis of hyaluronic acid by recombinant Corynebacterium glutamicum. Biotechnol J. 2016;11(4):574–584. doi: 10.1002/biot.201500404. [DOI] [PubMed] [Google Scholar]
- Choi S, Choi W, Kim S, Lee S-Y, Noh I, Kim C-W. Purification and biocompatibility of fermented hyaluronic acid for its applications to biomaterials. Biomater Res. 2014;18(1):1–10. doi: 10.1186/2055-7124-18-6. [DOI] [PMC free article] [PubMed] [Google Scholar]
- Chong BF, Blank LM, Mclaughlin R, Nielsen LK. Microbial hyaluronic acid production. Appl Microbiol Biotechnol. 2005;66(4):341–351. doi: 10.1007/s00253-004-1774-4. [DOI] [PubMed] [Google Scholar]
- Curtin LV (1983) Molasses-general considerations. Molasses Anim Nutr:1–10: Excerpt From Molasses in Animal Nutrition Copyright C, National Feed Ingredients Association West Des Moines, Iowa
- Don MM, Shoparwe NF. Kinetics of hyaluronic acid production by Streptococcus zooepidemicus considering the effect of glucose. Biochem Eng J. 2010;49(1):95–103. [Google Scholar]
- Duan X-J, Yang L, Zhang X, Tan W-S. Effect of oxygen and shear stress on molecular weight of hyaluronic acid produced by Streptococcus zooepidemicus. J Microbiol Biotechnol. 2008;18(4):718–724. [PubMed] [Google Scholar]
- Dubois M, Gilles KA, Hamilton JK, Pt R, Smith F. Colorimetric method for determination of sugars and related substances. Anal Chem. 1956;28(3):350–356. [Google Scholar]
- Duffeck HCBP, Pan NC, Saikawa GIA, da Rocha SPD, Baldo C, Celligoi MAPC. Biomedical potential of hyaluronic acid from Streptococcus zooepidemicus produced in sugarcane molasses. Braz J Dev. 2020;6(7):49963–49980. [Google Scholar]
- Harmita H, Hayun H, Geofani MH (2020) Quantification of hyaluronic acid and methylsulfonylmethane in dietary supplements. Int J Appl Pharm:143–148
- Himabindu M, Ravichandra P, Vishalakshi K, Jetty A. Optimization of critical medium components for the maximal production of gentamicin by Micromonospora echinospora ATCC 15838 using response surface methodology. Appl Biochem Biotechnol. 2006;134(2):143–154. doi: 10.1385/abab:134:2:143. [DOI] [PubMed] [Google Scholar]
- Huang W-C, Chen S-J, Chen T-L. The role of dissolved oxygen and function of agitation in hyaluronic acid fermentation. Biochem Eng J. 2006;32(3):239–243. [Google Scholar]
- Huang W-C, Chen S-J, Chen T-L. Modeling the microbial production of hyaluronic acid. J Chin Inst Chem Eng, 2007;38(3–4):355–359. [Google Scholar]
- Huang W-C, Chen S-J, Chen T-L. Production of hyaluronic acid by repeated batch fermentation. Biochem Eng J. 2008;40(3):460–464. [Google Scholar]
- Jagannath S, Ramachandran K. Influence of competing metabolic processes on the molecular weight of hyaluronic acid synthesized by Streptococcus zooepidemicus. Biochem Eng J. 2010;48(2):148–158. [Google Scholar]
- Johns MR, Goh L-T, Oeggerli A. Effect of pH, agitation and aeration on hyaluronic acid production by Streptococcus zooepidemicus. Biotech Lett. 1994;16(5):507–512. [Google Scholar]
- Kašparová J, Arnoldová K, Korecká L, Česlová L (2018) Determination of hyaluronic acid in pharmaceutical products by spectrophotometry and HPLC coupled to fluorescence or mass spectrometric detection. Scientific papers of the University of Pardubice Series A, Faculty of Chemical Technology 24/2018
- Kim J-H, Yoo S-J, Oh D-K, Kweon Y-G, Park D-W, Lee C-H, Gil G-H. Selection of a Streptococcus equi mutant and optimization of culture conditions for the production of high molecular weight hyaluronic acid. Enzym Microb Technol. 1996;19(6):440–445. [Google Scholar]
- Lapcık L, Jr, Lapcık L, De Smedt S, Demeester J, Chabrecek P. Hyaluronan: preparation, structure, properties, and applications. Chem Rev. 1998;98(8):2663–2684. doi: 10.1021/cr941199z. [DOI] [PubMed] [Google Scholar]
- Liu L, Du G, Chen J, Wang M, Sun J. Enhanced hyaluronic acid production by a two-stage culture strategy based on the modeling of batch and fed-batch cultivation of Streptococcus zooepidemicus. Biores Technol. 2008;99(17):8532–8536. doi: 10.1016/j.biortech.2008.02.035. [DOI] [PubMed] [Google Scholar]
- Liu L, Liu Y, Li J, Du G, Chen J. Microbial production of hyaluronic acid: current state, challenges, and perspectives. Microb Cell Fact. 2011;10(1):1–9. doi: 10.1186/1475-2859-10-99. [DOI] [PMC free article] [PubMed] [Google Scholar]
- Lu J, Zhu Y, Sun H, Liang S, Leng F, Li H. Highly efficient production of hyaluronic acid by Streptococcus zooepidemicus R 42 derived from heterologous expression of bacterial haemoglobin and mutant selection. Lett Appl Microbiol. 2016;62(4):316–322. doi: 10.1111/lam.12546. [DOI] [PubMed] [Google Scholar]
- Mahariawan I, Ariffin N, Kusuma W, Yuniarti A, Beltran M, Hariati A Effect of different carbon doses of tapioca (Manihot esculenta) flour on vegetative cells and spore production of Bacillus megaterium. In: IOP Conference series: earth and environmental science, 2020, vol 1. IOP Publishing, pp 012106
- Marcellin E, Chen W, Nielsen LK. Microbial hyaluronic acid biosynthesis. In: Rehm BHA, editor. Microbial production of biopolymers and polymer precursors: applications and perspectives. Norfolk, UK: Caister Academic Press; 2009. pp. 163–180. [Google Scholar]
- Masuko T, Minami A, Iwasaki N, Majima T, Nishimura S-I, Lee YC. Carbohydrate analysis by a phenol–sulfuric acid method in microplate format. Anal Biochem. 2005;339(1):69–72. doi: 10.1016/j.ab.2004.12.001. [DOI] [PubMed] [Google Scholar]
- Mausolf A, Jungmann J, Robenek H, Prehm P. Shedding of hyaluronate synthase from streptococci. Biochem J. 1990;267(1):191–196. doi: 10.1042/bj2670191. [DOI] [PMC free article] [PubMed] [Google Scholar]
- Pavia DL, Lampman GM, Kriz GS, Vyvyan JR. Introdução à espectroscopia. Boston: Cengage Learning; 2010. [Google Scholar]
- Pires AMB, Santana MHA. Metabolic effects of the initial glucose concentration on microbial production of hyaluronic acid. Appl Biochem Biotechnol. 2010;162(6):1751–1761. doi: 10.1007/s12010-010-8956-6. [DOI] [PubMed] [Google Scholar]
- Radaeva I, Kostina G, Zmievskii A. Hyaluronic acid: biological role, structure, synthesis, isolation, purification, and applications. Appl Biochem Microbiol. 1997;33(2):111–115. [PubMed] [Google Scholar]
- Rangaswamy V, Jain D. An efficient process for production and purification of hyaluronic acid from Streptococcus equi subsp. zooepidemicus. Biotechnol Lett. 2008;30(3):493–496. doi: 10.1007/s10529-007-9562-8. [DOI] [PubMed] [Google Scholar]
- Samocha TM, Patnaik S, Speed M, Ali A-M, Burger JM, Almeida RV, Ayub Z, Harisanto M, Horowitz A, Brock DL. Use of molasses as carbon source in limited discharge nursery and grow-out systems for Litopenaeus vannamei. Aquacult Eng. 2007;36(2):184–191. [Google Scholar]
- Saran S, Isar J, Saxena RK. Statistical optimization of conditions for protease production from Bacillus sp. and its scale-up in a bioreactor. Appl Biochem Biotechnol. 2007;141(2):229–239. doi: 10.1007/BF02729064. [DOI] [PubMed] [Google Scholar]
- Size CM. Global Industry Analysis Report, 2020–2027. Portland: Allied market research; 2020. [Google Scholar]
- Stanbury PF, Whitaker A, Hall SJ. Principles of fermentation technology. Amsterdam: Elsevier; 2013. [Google Scholar]
- Takara K, Ushijima K, Wada K, Iwasaki H, Yamashita M. Phenolic compounds from sugarcane molasses possessing antibacterial activity against cariogenic bacteria. J Oleo Sci. 2007;56(11):611–614. doi: 10.5650/jos.56.611. [DOI] [PubMed] [Google Scholar]
- Treichel H, Mazutti MA, Maugeri Filho F, Rodrigues MI. Technical viability of the production, partial purification and characterisation of inulinase using pretreated agroindustrial residues. Bioprocess Biosyst Eng. 2009;32(4):425–433. doi: 10.1007/s00449-008-0262-0. [DOI] [PubMed] [Google Scholar]
- Van de Rijn I, Kessler R. Growth characteristics of group A streptococci in a new chemically defined medium. Infect Immun. 1980;27(2):444–448. doi: 10.1128/iai.27.2.444-448.1980. [DOI] [PMC free article] [PubMed] [Google Scholar]
- Vázquez JA, Montemayor MI, Fraguas J, Murado MA. Hyaluronic acid production by Streptococcus zooepidemicus in marine byproducts media from mussel processing wastewaters and tuna peptone viscera. Microb Cell Fact. 2010;9(1):1–10. doi: 10.1186/1475-2859-9-46. [DOI] [PMC free article] [PubMed] [Google Scholar]
- Vigetti D, Viola M, Karousou E, De Luca G, Passi A. Metabolic control of hyaluronan synthases. Matrix Biol. 2014;35:8–13. doi: 10.1016/j.matbio.2013.10.002. [DOI] [PubMed] [Google Scholar]
- Wang S, Zhang J, Wang Y, Chen M. Hyaluronic acid-coated PEI-PLGA nanoparticles mediated co-delivery of doxorubicin and miR-542–3p for triple negative breast cancer therapy. Nanomed Nanotechnol Biol Med. 2016;12(2):411–420. doi: 10.1016/j.nano.2015.09.014. [DOI] [PubMed] [Google Scholar]
- Yao Z-Y, Qin J, Gong J-S, Ye Y-H, Qian J-Y, Li H, Xu Z-H, Shi J-S. Versatile strategies for bioproduction of hyaluronic acid driven by synthetic biology. Carbohyd Polym. 2021;264:118015. doi: 10.1016/j.carbpol.2021.118015. [DOI] [PubMed] [Google Scholar]
- Zhang X, Wang M, Li T, Fu L, Cao W, Liu H. Construction of efficient Streptococcus zooepidemicus strains for hyaluoronic acid production based on identification of key genes involved in sucrose metabolism. AMB Express. 2016;6(1):1–9. doi: 10.1186/s13568-016-0296-7. [DOI] [PMC free article] [PubMed] [Google Scholar]
- Zhu S, Zheng M, Li C, Gui M, Chen Q, Ni J. Special role of corn flour as an ideal carbon source for aerobic denitrification with minimized nitrous oxide emission. Biores Technol. 2015;186:44–51. doi: 10.1016/j.biortech.2015.03.046. [DOI] [PubMed] [Google Scholar]