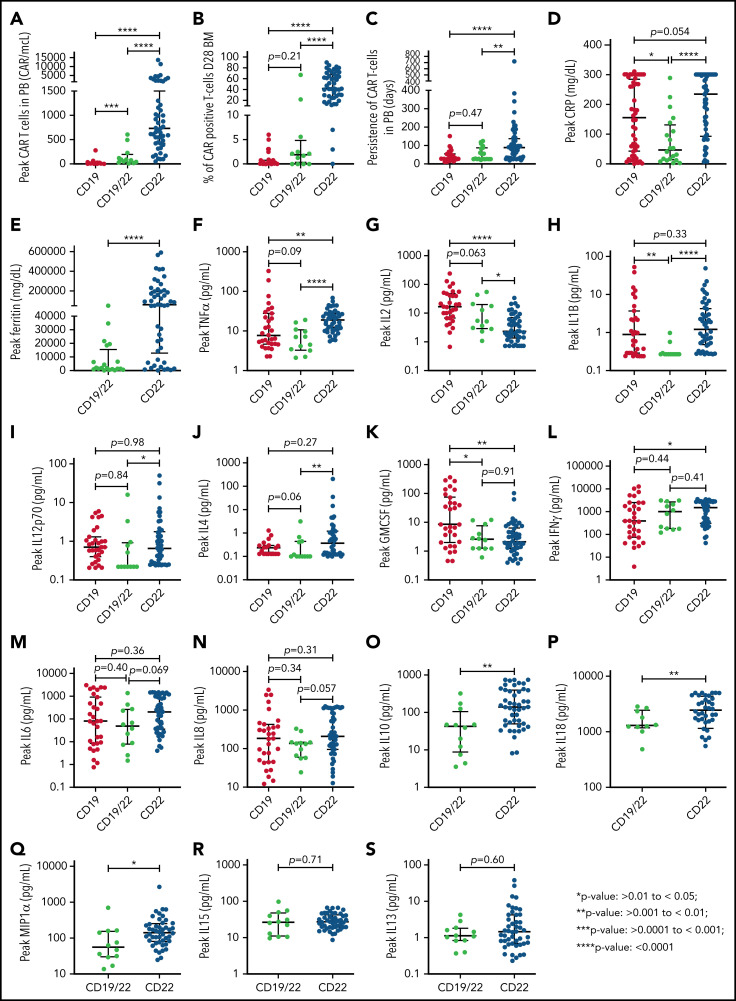
Figure 2.
Comparison of CAR T-cell expansion, persistence, inflammatory markers, and cytokine values across 3 Pediatric Oncology Branch clinical trials. (A-B) Peak CAR T-cell expansion in the PB displayed as absolute CAR T cells and peak percentage of CAR T cells in the bone marrow, respectively, evaluated in responders across the 3 trials. (C) Persistence of CAR T cells in the PB as measured by flow cytometry. (D-E) Comparison of peak CRP and ferritin values across trials. (F-N) Comparison of peak serum cytokine values of tumor necrosis factor α, IL2, IL1B, IL4, IL12p70, IFNγ, IL6, IL8, and GM-CSF across all 3 trials. (O-S) Comparison of peak serum cytokine values of IL10, IL18, macrophage inflammatory protein-1 (MIP1)α, IL15, and IL13 between CD19/22 and CD22 CAR patients. *P > .01 to < .05; **P > .001 to < .01; ***P > .0001 to < .001; ****P < .0001.

