

Abstract
Hematopoietic stem cell transplantation (HSCT) is commonly used to treat patients with various blood disorders, genetic and immunological diseases, and solid tumors. Several systemic complications following HSCT are critical limiting factors for achieving a successful outcome. These systemic complications are mainly due to the lack of initial engraftment after transplantation. However, the detailed underlying cellular dynamics of early engraftment have not been fully characterized yet. We performed in vivo longitudinal visualization of early engraftment characteristics of transplanted hematopoietic stem and progenitor cells (HSPCs) in the mouse calvarial bone marrow (BM). To achieve this, we utilized an in vivo laser‐scanning confocal microscopy imaging system with a cranial BM imaging window and stereotaxic device. We observed two distinct cellular behaviors of HSPCs in vivo, cluster formation and cluster dissociation, early after transplantation. Furthermore, we successfully identified three cellular phases of engraftment with distinct cellular distances which are coordinated with cell proliferation and cell migration dynamics during initial engraftment.
Keywords: bone marrow engraftment, hematopoietic stem and progenitor cells, hematopoietic stem cell transplantation, intravital imaging
Abbreviations
- BLI
bioluminescence imaging
- BM
bone marrow
- CT
computed tomography
- G‐CSF
granulocyte colony‐stimulating factor
- GvHD
graft versus host disease
- HSCT
hematopoietic stem cell transplantation
- HSPCs
hematopoietic stem and progenitor cells
- MRI
magnetic resonance imaging
- PBSCT
peripheral blood stem cell transplantation
- PET
positron‐emission tomography
1. INTRODUCTION
Hematopoietic stem cell transplantation (HSCT) is commonly utilized for treating various malignant and non‐malignant hematopoietic disorders including leukemia, multiple myeloma, lymphoma, and anemia. 1 , 2 However, many patients develop post‐transplant complications such as graft versus host disease (GvHD), graft failure & rejection, multiple organ failures and infections. 3 , 4 Although the detailed mechanisms of these complications are not well understood, several studies have suggested that incomplete initial engraftment or loss of graft after transplantation may lead to graft failure due to limited immune reconstitution accompanying immunological and infectious complications. 5 , 6 , 7 , 8 Successful clinical HSCT outcomes rely on rapid and sustained engraftment followed by immune repopulation with minimal initial complications. 9 , 10 , 11 , 12 , 13 Enhancing the efficacy of early engraftment has been proposed as a promising strategy for effectively alleviating post‐transplant complications. 2 For instance, graft manipulations to improve the efficiency of stem cell seeding into the bone marrow (BM) microenvironment have been developed by modifying molecular expression, chemotactic factors, and metabolic functions of graft stem cells. 11 In addition, enhancing engraftment in a rapid and efficient manner by co‐transplantation of committed hematopoietic progenitor cells has been tried by granulocyte‐colony‐stimulating factor (G‐CSF) mobilized peripheral blood stem cell transplantation (PBSCT). 2 , 14 However, both strategies only marginally reduced the potent risk of GvHD and graft rejection, and more effective solutions to achieve efficient engraftment and manage post‐transplant complications are in dire need. 11 , 12 , 14 Understanding the underlying cellular mechanisms of transplanted hematopoietic stem and progenitor cells (HSPCs) in the early engraftment phase is a beginning point for alleviating serial complications and accelerating hematopoietic recovery. 12 , 15 , 16 In the clinical situation, there is a standard diagnosis to analyze engraftment and immune reconstitution by monitoring peripheral mature blood cell (white blood cell, red blood cell, and platelet) count after HSCT, however, which still lacks in vivo dynamic cellular information on donor stem cell homing, engraftment, and repopulation through active proliferation and differentiation. 8 , 17 In basic and translational research, there have been several in vivo studies to investigate dynamic cellular/molecular characteristics of transferred stem cells using intravital imaging system including fluorescence microscopy, 18 , 19 , 20 , 21 bioluminescence imaging (BLI), 22 , 23 , 24 , 25 , 26 , 27 magnetic resonance imaging (MRI), 27 , 28 , 29 , 30 , 31 computed tomography (CT), 27 , 31 , 32 , 33 , 34 and positron‐emission tomography (PET). 27 , 35 , 36 , 37 However, in vivo cellular dynamics in the initial engraftment of transplanted BM cells at early post‐transplant phase have not been well characterized and remain elusive.
In this study, we established a long‐term intravital imaging strategy to visualize transplanted HSPCs in host cranial BM. By utilizing a laser‐scanning intravital confocal microscopy 38 , 39 , 40 , 41 combined with cranial BM window and stereotaxic mounts, a repetitive daily wide‐area monitoring for 10 days and a longitudinal time‐lapse imaging over 20 h of transferred HSPCs during the initial engraftment were achieved in vivo. Using the optimized BM imaging strategy, we successfully performed spatiotemporal cellular visualization and statistical analysis of multi‐phase cellular events of transplanted HSPCs during initial engraftment with distinct proliferation rate, migration velocity, and gathering efficiency for cluster formation, and serial cluster formation‐dissociation dynamics which are concordant with cellular density of transplanted HSPCs.
2. MATERIALS AND METHODS
2.1. Animal model
All experiments were carried out according to the ARRIVE (Animal Research: Reporting In Vivo Experiments) guidelines and with the protocol approved by the Animal Care and Use Committee of KAIST (protocol no. KA2013‐10). All surgeries were performed under anesthesia and all efforts were made to minimize suffering. Mice were individually housed in ventilated as well as temperature (22.5°C) and humidity (52.5%) controlled cages under 12 h:12 h light:dark cycle and provided with standard diet and water ad libitum. A β‐actin‐DsRed transgenic mouse line, 42 , 43 which expresses the DsRed fluorescence protein in cytoplasm and nucleus of every cells (Stock number; 006051, Jackson Laboratory, generously provided by Dr. Koh at KAIST), was used as a donor mouse. After in vivo experiment, mice were monitored daily for their health, including body condition and body weight for at least 7 days to validate complete recovery after the surgical process. After health monitoring, mouse euthanization was implemented in a euthanasia chamber filled with CO2 gas.
2.2. HSPCs isolation
For isolating HSPCs from bone marrow, magnetic‐activated cell sorting (MACS), and fluorescence‐activated cell‐sorting (FACS) analysis were performed as follow. Bone marrow cells were harvested from donor femur and tibia by crushing bones with mortar and pestle in PBS containing 2% FCS and filtering through a 40 μm mesh filter. After red blood cells were lysed, bone marrow cells were incubated with a cocktail of biotin‐conjugated lineage‐specific antibodies against CD45, Gr1, CD11b, Ter119, CD4, CD8, CD3 (553,029, 553,060, 553,086, 553,125, 553,309, 553,672, and 553,728, respectively, BD Biosciences), and anti‐Biotin microbeads for MACS (130–090‐485, Miltenyi Biotec). The separation of lineage‐negative cells was performed with an autoMACS pro separator (Miltenyi Biotec). Lineage‐depleted cells stained with APC‐conjugated c‐Kit (17–1171‐81, eBioscience) and PECy7‐conjugated Sca‐1 (108,116, Biolegend) antibodies were sorted using FACS Aria II (BD Biosciences) with over 95% purity. The DsRed fluorescence expression in the purified HSPCs was over 99% by FACS DiVa software (BD Biosciences).
2.3. Hematopoietic stem cell transplantation mouse model
To fluorescently visualize the donor bone marrow cells, the β‐actin‐DsRed transgenic mouse (20–35 g body weight; 12–25 weeks old, C57BL/6), and the wildtype C57BL/6 mouse (20–35 g; 12–25 weeks, C57BL/6) were used as donors and recipients, respectively, of hematopoietic stem cell transplantation. At 7–12 h before HSPC infusion, recipients were sub‐lethally irradiated with 6–9.5 Gy using a gamma irradiator (Gamma cell 3000, Nordion Inc.). 3–4 × 10⁴ purified HSPCs were systemically transferred to each recipient mouse via tail‐vein injection. From representative three HSCT recipient mice for performing in vivo imaging experiments, bone marrow reconstitution was successfully assessed at 4, 8, and 12 weeks post‐transplantation (Figure S1).
2.4. Imaging system
A video‐rate intravital confocal microscope (prototype of IVM‐C, IVIM Technology) 41 , 44 , 45 was used to visualize longitudinal wide‐area in vivo cellular dynamics of HSPCs in mouse calvaria. A laser‐scanning confocal microscopy system was modified with enhanced optical and digital resolution compared to previous intravital microscope systems. 39 , 40 , 46 The detailed information on the schematic design of in vivo confocal imaging system was described previously. 40 While maintaining the schematic design of the previous system, we improved the laser beam filling ratio at the objective back aperture and the digital frame size for better imaging field and resolution. Using various achromatic lens pairs with different focal lengths, the laser beam size at the objective back‐aperture was adjusted to 1.4 times as large as that of the previous system. By modifying the frame acquirement setting of the custom‐written imaging software, we successfully achieved high‐resolution images of 1024 × 1024 pixels/frame with a real‐time frame rate of 960 Hz (15 frames/sec). Digital resolution of the acquired image was enhanced 1.5 times over that of the previous system. For imaging experiment, we used the commercial objective lens PlanApoλ, 10X, NA 0.45, Nikon for the imaging field of view of 1570 μm × 1570 μm and LUCPlanFLN, 40X, NA 0.6, Olympus for 353 μm × 353 μm imaging field of view.
2.5. Long‐term imaging mount setup
During a long‐term time‐lapse in vivo imaging experiment, mouse calvaria was stably fixed to the translational stage (3DMS, Sutter Instrument) using a bone marrow mount setup (Figure S2A). After a scalp incision, the surrounding skull except imaging area was covered with dental cement. 20 , 47 , 48 , 49 Before dental cement hardened, bone marrow window (Figure S2B (1)) was firmly attached to the intact cranium and was secured in the window holder fixed to the heating plate with screw (Figure S2B (2), (4)). A mouth adapter shown in Figure S2B (3) was used to support the mouse skull by fixing mouse incisive teeth and to maintain mouse in inhalational anesthesia induced by anesthetic gases flowing through the side holes of a mouth adapter (each side of holes for input and output gas, respectively). Prior to imaging, cranial bone marrow imaging area was wiped with swab moistened in saline and covered with a coverslip using a U‐shaped bracket fixed to a kinematic mount (KMS, Thorlabs) shown in Figure S2A. After imaging, moisture on the skull and calvarial bone was removed and sealed by bio‐compatible silicone adhesive (Kwik‐Cast™, WPI) and then covered by aluminum foil for blocking light on imaging area.
2.6. In vivo cranial bone marrow imaging
During the entire experiment, the mouse was maintained in anesthetic state with intraperitoneal injection of ketamine (70 mg/kg) and xylazine (10 mg/kg) for short‐term imaging and with inhalational anesthetic gases for long‐term imaging. Isoflurane vaporizer (100 Series Vaporizer, Surgivet) was set to 2.5% isoflurane for initial induction and to 1%–2% for maintenance, both with 1 L/min of oxygen supply. For bone marrow imaging, calvarial bone of transplant mouse model was clearly exposed after a scalp incision and firmly fixed to the 3D translational stage with bone marrow imaging mount setup depicted in Figure S2. During imaging, the mouse was placed on a heating pad for body temperature maintenance at 36°C and cranial bone marrow imaging area was kept moistened with warm saline continuously supplied through an automatic syringe pump system (Fusion 100 Touch, KDS) to prevent tissue drying (Figure S2A). For nutrient and hydration supplement during long‐term experiments over 20 hours, electrolyte solution containing 3.33% dextrose and 0.3% NaCl (SD1‐2, JW Pharmaceutical) was systemically administered via tail‐vein at 0.2 μl/min for 20 g mice through an auto‐syringe pump system. To visualize bone marrow vascular networks in vivo, an anti‐CD31 monoclonal antibody (553370, BD Biosciences) conjugated with Alexa Fluor 647 (A‐20186, Invitrogen) was intravenously injected at doses of 0.6 mg/kg via lateral tail vein at 3 hours before imaging. 40 , 46 , 50 , 51 After imaging, the mouse was placed on a heating pad and monitored until fully awake. To prevent excessive post‐surgical inflammation, mice were administered with dexamethasone sodium phosphate (1.5 μg/g, Sigma‐Aldrich) once by intramuscular injection and with carprofen (0.15 mg, Rimadyl, Pfizer) by daily intraperitoneal injection, and were provided with drinking water containing sulfamethoxazole (1 mg/mL, Sigma‐Aldrich) and trimethoprim (0.2 mg/mL, Sigma‐Aldrich) during experimental period. 52
2.7. Bone marrow reconstitution assay
After in vivo imaging experiment, HSCT mouse models were assessed for hematopoietic reconstitution derived from transferred donor HSPCs at 4, 8, and 12 weeks post‐transplantation by FACS analysis. 53 Peripheral blood cells collected in EDTA coated tubes from mouse mandibular vein were stained after RBC lysis at 4°C for 30–40 minutes with following antibodies: CD19‐FITC (1D3, 11–0193‐81, eBioscience) for B lymphocytes, CD3e‐PE‐Cy7 (145‐2C11, 25–0031‐81, eBioscience) for T lymphocytes, Gr1‐APC (RB6‐8C5, 17–5931‐81, eBioscience) for granulocytes, and CD45‐PerCP (30‐F11, 45–0451‐80, eBioscience) for pan‐leukocytes. Stained cells were analyzed by flow cytometry to determine reconstitution efficiency of donor cells as shown in Figure S1. Data were analyzed with FACS DiVa software (BD Biosciences).
2.8. Image processing and Quantitative imaging analysis
Maximum intensity projection of z‐stack image sequences achieved by 30–40 μm of z‐interval was performed by Image J software (https://imagej.nih.gov). All image sequences acquired in a longitudinal manner were compensated for XY‐shifted motion artifact by using a custom code of MATLAB (Mathworks). Cellular area of transplanted HSPCs and BM vasculature were quantitatively analyzed with the Surface Contour function of IMARIS 8.2 software (Bitplane). Analysis of dynamics of transplanted HSPCs was performed with spot detection and tracking function of IMARIS. Cellular tracking analysis of transplanted HSPCs was performed with z‐stack maximum intensity projection 2D images. Spot creation and tracking analysis were implemented by both manual tracking and automatic tracking algorithm. Statistics including track length, track speed, track displacement, and the number of cell and track branches were achieved from IMARIS after spot tracking analysis. Closest distance between cell spots was automatically calculated from Spots to Spots Closest Distance Xtension function. The proliferation rate was determined by the following calculation: the number of spot track branches/the number of time frame ×100 (%). Appearing and disappearing migration events were analyzed by counting the number of appearance and disappearance of detected spot tracks, respectively.
2.9. Statistical analysis
All data were presented as mean ± standard deviation (S.D.). Statistical differences between means were determined by unpaired two‐tailed Welch's t‐test. Statistical significance was set at p < 0.05, and statistical analysis was performed with Prism 6.0 (GraphPad). Linear regression was analyzed using linear fitting tool of Origin 2019 (OriginLab).
3. RESULT
3.1. Longitudinal wide‐area in vivo monitoring of transplanted HSPCs with two distinct cellular cluster behaviors during the pre‐engraftment phase of HSCT
In this study, we established an HSCT mouse model by transferring HSPCs, which are Lin−c‐Kit+Sca‐1+ (LKS) expressing cell population highly enriched with long‐term hematopoietic stem cells (LT‐HSCs), short‐term HSCs (ST‐HSCs), and multi‐potent progenitor cells (MPPs) for immune reconstitution capability, 54 from β‐actin‐DsRed transgenic mice into C57BL/6 recipient mice. This HSCT model successfully produced mature blood cells at 4, 8, and 12 weeks after transplantation (Figure S1). Using a video‐rate laser‐scanning intravital microscopy system with cranial BM window and stereotaxic mount, we optimized an in vivo imaging strategy for longitudinal cellular visualization of transplanted cells in the host cranial BM (Figure S2).
We achieved daily wide‐area mosaic imaging of calvarial BM of HSCT recipient mice until post‐transplant day 10 to analyze the daily cellular dynamics of transplanted HSPCs during early engraftment (Figure 1A). In vivo longitudinal cellular engraftment behaviors of transplanted HSPCs were monitored along with the vascular landmarks and were categorized based on their cluster behavior types marked with dotted squares in Figure 1B. We identified two types of cellular dynamics of (1) cluster formation and (2) cluster dissociation of transplanted HSPCs during early engraftment (Figure 1C). Quantitative imaging analysis of cluster behavioral classification was performed from three HSCT mice monitored in vivo from day 1 to day 10 after transplantation. As a result, two types of cluster behavior, cluster formation, and cluster dissociation occurred at 76.5% and 23.5%, respectively, on average at day 10 (Figure 1D), suggesting that the cluster formation dynamics are the key events of transplanted HSPCs during initial engraftment phase.
FIGURE 1.
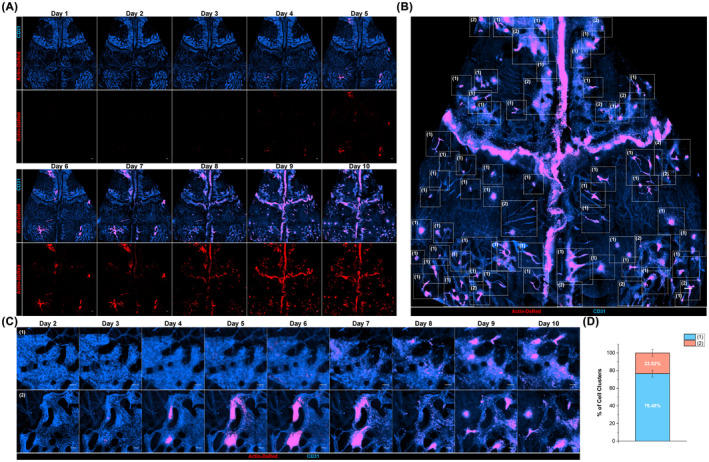
Daily longitudinal wide‐area in vivo imaging analysis of cellular engraftment of transplanted hematopoietic stem and progenitor cells. (A) Daily wide‐area imaging of transplanted hematopoietic stem and progenitor cells (HSPCs) in host calvarial Bone marrow (BM) from 1 day to 10 days after hematopoietic stem cell transplantation (HSCT) using a video‐rate fluorescence intravital confocal microscopy system. The maximum intensity projection using z‐stack image sequences with 30–40 μm of z‐interval and tiling process of each projection images were performed to achieve the high‐quality wide‐area cellular images of host cranial BM. (B) A representative wide‐area image of the same mouse of (A) on HSCT day 9. Dotted squares indicate the spots of (1) cluster formation and (2) cluster dissociation. (C) Representative images of two types of cell cluster dynamics during early engraftment: (1) cluster formation and (2) cluster dissociation. (D) Percentage of two types of cell clustering events. Graphs are presented with mean ± SD. Analysis was performed from n = 3 mice, all images per mouse are acquired from 1 day to 10 days after HSCT. Scale bars are 200 μm (A), (B), and are 100 μm in (C)
3.2. Distinct cluster dynamics of transplanted HSPCs were coordinated with vascular changes of host BM
In the magnified view, most of the cell cluster dissociation events (asterisk) were followed by serial de novo cluster formation (arrowhead) events occurring around the dissociation spots, which was concordant with the change of BM vascular areas (Figure 2A). We performed the quantitative analysis of the cellular dynamics of cluster formation and dissociation of transplanted HSPCs and host BM vasculatures. The cellular areas of transplanted HSPCs at the cluster formation‐dissociation spot (area delineated by the dotted line in Figure 2A) substantially increased during cluster formation, which lasted from day 4 to post‐transplant day 7, and decreased very rapidly following cluster dissociation after day 8 (Figure 2B). Vascular areas did not change significantly until day 6 or 7 during cluster formation but slowly decreased as cluster dissociation event initiated after day 7. The signal intensity of endothelial cells stained with anti‐CD31‐Alexa 647 faded and vascular diameter gradually decreased as the cluster dissociation started from day 8 to day 10. Meanwhile, multiple de novo cluster formations occurred at the beginning of cluster dissociation event on day 7 or 8, which showed that the total cellular area of HSPCs was relatively maintained with coordinated vascular change on days 8 to 10 (Figure 2C). Quantitative analysis of various cluster formation‐dissociation spots revealed similar cellular area dynamics of transplanted HSPCs, and that the vascular area was inclined to decrease in concordance with cluster dissociation starting on days 8–10 (Figure 2D, Figure S3). These observations clearly suggested that longitudinal dynamics of host BM vascular structure were coordinated with the cluster dynamics of transplanted HSPCs in vivo.
FIGURE 2.

Cluster dissociation and formation dynamics of HSPCs associated with vascular remodeling during initial engraftment. (A) Representative collective cellular behavior of cluster formation followed by cluster dissociation (asterisk) and serial de novo cluster formations (arrowhead) around the dissociation spot, which was coordinated with BM vascular changes. Surface contour images of transplanted HSPCs (red) and BM vasculature (cyan) were created by Contour Surface function of IMARIS for quantitative analysis of the cellular area. The dotted area indicates the cluster dissociation spot which was quantified in (B). (B) Normalized total cell area of transplanted HSPCs and BM vessel in cluster dissociation spot outlined in (A). Data were normalized to that of transplant day 1. (C) Normalized total cellular area of representative image sequences in (A), which include cluster formation‐dissociation spot and multiple de novo cluster formation spots. (D) Normalized total cellular area acquired from n = 4 imaging spots with cluster formation‐dissociation dynamics. Graphs are presented with mean ± SD. Analyzed imaging spots had area sizes similar to that of processed image sequences in (B). Scale bars are 100 μm in (A)
3.3. Cellular density‐dependent multi‐phase cellular dynamics of HSPCs during cluster formation
To visualize the detailed collective dynamic cellular behaviors of transplanted HSPCs during the cluster formation phase, we optimized an in vivo multi‐position long‐term time‐lapse imaging strategy in Figure S2. We performed long‐term multi‐position time‐lapse imaging to monitor transplanted HSPCs at the spots with different HSPCs distribution in terms of cell‐to‐cell distance between HSPCs (distantly, intermediately, and closely located cell spots) during the cluster formation process at post‐transplantation days 2–4 when the cluster formation was expected to occur. Cell‐tracking analysis of these three cell groups was performed to identify in vivo cellular behavioral characteristics of transplanted HSPCs during cluster formation (Figure 3A–C). Representative images of cell tracking analysis showed distinct cellular track lines of three representative cell locational spots (Figure 3A, Videos [Link], [Link]). Longitudinal cellular tracks of HSPCs of three cellular phases were marked as cell spots (circle), tracks (line), and branches (cell division) (Figure 3C). XY displacement cellular analysis of cell tracking movies revealed that distantly located cell spots had the highest displacement activity, whereas closely located cell spots had the lowest (Figure 3B). A scatter plot of 3‐frame (30‐minute) average cell speed versus closest cellular distance from total of 22 multi‐spot time‐lapse movies of transplanted HSPCs revealed that the average cell migration speed and the closest cell distance were positively correlated (Figure 3D). The three cellular phases of distantly, intermediately, and closely located cell spots were clearly discriminated upon the closest cell‐to‐cell distance. It showed significant differences in their average migration speeds revealing that the cellular migration speeds increase according to a decrease in cell density (Figure 3E).
FIGURE 3.

In vivo imaging analysis of three phases of cellular engraftment of transplanted HSPCs.(A) Representative images of cell tracking of distantly (1), intermediately (2), and closely (3) located cell spots (red sphere, cell; yellow line, cell track). Time‐lapse image sequences were achieved with a time‐interval of 10 minutes and were processed to maximum intensity projection for a 2D time‐lapse movie for the cell trafficking analysis. (B) Rose plot graphs of XY Displacement of three representative cell groups in (A). (C) Cell tracks of the three cell groups as in (A) along the indicated time frame. Cell tracks were obtained by spot analysis function of IMARIS software. Track branches indicate proliferation events. (D) Scatter plot of average cell migration speed versus cell to cell closest distance during 30 minutes (three frame average). Total of 22 imaging spots from four mice was analyzed. Time‐lapse movies were captured with 10 minutes of time interval, a total time frame of 170–1210 minutes. Cell tracking analysis was performed with spot analysis and spot tracking function of IMARIS software. Linear regression graph is analyzed from a total of 500 scatter spots of three groups (y = 9.07*10‐5x + 0.002, R2 = 0.215). (E) Average cell migration speed, with three frame average, during 30 minutes was analyzed from 6 (closely located cell groups), 12 (intermediately located cell groups), and 4 (distantly located cell groups) imaging spots, respectively. Data are presented as mean value ± SD (standard deviation). p‐value is acquired from unpaired two‐sample t‐test with Welch's correction (****, p < 0.0001). (F) Scatter plot of average cell division rate versus cell to cell closest distance. Each spot is acquired from one movie of cell tracks. Data is from a total of 22 imaging spots from four mice (n = 4, distantly located condition; n = 12, intermediately located condition; n = 6, closely located condition). Regression line graph is achieved from all 22 scatter spots (y = −1.067x + 39.113, R2 = 0.393). (G) Average cell division rate of the three indicated cell groups. Data are presented as mean ± SD. p‐value is analyzed from unpaired two‐sample t‐test with Welch's correction (ns, p = 0.0577; *, p < 0.05; **, p < 0.01). Scale bars are 30 μm in (A)
On the other hand, a scatter plot of the average cell division rate and the closest cell‐to‐cell distance presented a negative linear relationship (Figure 3F,G), suggesting closely located cell spots possibly revealed the high division rate. Of note, in the scatter plot of close cell spot, there was a significant difference in average division rate (Figure 3G, Figure S4). Three cell groups with higher cell number shown in the upper row in Figure S4A showed a high division rate of over 50% (division/frame), while the other groups with low cell number shown on the lower row showed a much lower division rate of about 10% (division/frame) (Figure S4B,C). It was observed that the larger the cell cluster with a number of cells showed the higher the division rate. Collectively, statistical analysis of total of 22 cell tracking data of transplanted HSPCs demonstrated a significant decrease in migration speed and increase in cell division rate with increasing cell density (Table 1).
TABLE 1.
Statistical analysis of average cell to cell closest distance, cell migration speed, and cell division rate of three cell groups
| Distantly located condition (n = 4) | Intermediate condition (n = 12) | Closely located condition (n = 6) | |
|---|---|---|---|
| Average closest cell – Cell distance (μm) | 39.38 (7.77) | 21.47 (5.31) | 10.12 (1.68) |
| Average migration speed (μm/10 min) | 4.90 (2.30) | 3.81 (1.01) | 1.53 (0.53) |
| Division rate (%) (Division count/Time frame × 100) | 2.64 (1.60) | 10.40 (6.84) | 36.25 (25.85) |
Note: The number is the mean value of cell distance, cell migration speed, and cell division rate with standard deviation (SD, in bracket) obtained from 4 (distantly), 12 (intermediately), and 6 (closely) imaging spots of four mice.
3.4. Cell‐to‐cell distance‐dependent phase transition of HSPCs with dynamic changes in proliferation rate and migration
Three transitional phases, including (1) transition from distant to intermediate condition, (2) progression of intermediate condition, and (3) transition from intermediate to close condition in terms of cell‐to‐cell distance between HSPCs, were captured over 20 hours of long‐term time‐lapse monitoring (Figure 4A, Videos [Link], [Link]). Quantitative analysis of cellular distance, number, proliferation rate, and appearing/disappearing migration event of transplanted HSPCs at each stage was performed (Figure 4B–D). It clearly showed that the cell distance of all three phases decreased while cell number increased over this period of time (Figure 4B). Longitudinal cellular monitoring of proliferation and appearing/disappearing migration events was assessed in a cumulative manner (Figure 4C,D). Appearing/disappearing migration events refer to the recruitment of new cells to the imaging field or cell migration out of the imaging field. The slope of the proliferation event gradually increased as HSPCs were placed closer from distant to close conditions (Figure 4C). In the transition from intermediate to close condition, there were two slopes of proliferation event, the initial one was similar to that of the intermediate transition stage and the latter one showed a large value, indicating a transition from intermediate to close condition. In migration analysis, while both appearing and disappearing event increased over time, appearing event in both cellular phases increased more than disappearing event (Figure 4C,D). These findings together clearly indicated that the proliferation and appearing migration events collectively involved in the engraftment process.
FIGURE 4.

Cell–cell distance‐dependent phase transition in the proliferation and migration of HSPCs. (A) Long‐term time‐lapse imaging of transplanted HSPCs over 20 h showing a transition from distant condition to intermediate condition (1), progressing intermediate condition (2), and transition from intermediate condition to close condition (3). (B) Closest cell to cell distance and cell number changes of distant to intermediate condition (1), progressing intermediate condition (2), and intermediate to close condition (3) along with the indicated time frames. (C) Linear graphs of the cumulative events of proliferation and migration (appearance) of the three transition stages as in (B). All linear regression of cumulative proliferation event show R2 > 0.8. The slope of linear regression presents the proliferation rate. (D) Line graphs plotting cumulative event of disappearing migration of the three transition conditions as in (B). Scale bars are 30 μm in (A)
4. DISCUSSION
In this research, we established a long‐term intravital BM imaging strategy and successfully achieved spatiotemporal cellular visualization and statistical analysis of the characteristic behaviors of transplanted HSPCs during initial engraftment in host cranial BM. For in vivo longitudinal monitoring of HSPC behaviors, we performed several repeated calvarial BM imaging experiments in the same mouse model over 10 days. We validated that the effect of surgical procedures on in vivo dynamics of BM engraftment and vascular remodeling was insignificant in multiple intravital imaging experiments of sham control models.
Underlying mechanisms in the cellular kinetics of HSPC cluster formation‐dissociation observed on post‐transplant days 7–9 (Figure 2) are currently unknown and need further investigation. Although it is limited to a one‐time observation, a long‐term in vivo visualization of HSPC cluster formation‐dissociation dynamics in the same area for 25 days after HSPC transplantation was performed (Figure S5). It showed that the cluster formation‐dissociation repetitively occurred twice (asterisks) or three times (arrowhead) at the same microscopic area of BM for at least 25 days after HSPC transplantation. Additionally, in vivo imaging of recipient BM at 12 weeks post‐transplantation revealed that the transplanted HSPCs were uniformly distributed and filled up the whole cranial BM (Figure S6). This observation suggests that the cluster formation and dissociation of the transplanted BM cells may rather ubiquitously occur in the recipient BM until the transplanted BM cells fully occupy the BM of recipient, though additional repeated in vivo imaging would be needed to confirm it.
Our knowledge of heterogenetic characteristics of stem cell is incomplete and various hypothesis are still being raised in the recent era. However, recent studies suggest that the size of stem cell mass is determined by the balance between proliferation and apoptosis of stem and progenitor cells. 55 , 56 In a normal hematopoietic state, proliferation, and apoptosis are tightly controlled for hematopoietic homeostasis with various mediating factors regulating stem cell cycle including telomerase activity, proteins, ROS (reactive oxygen species), 55 , 57 and have a positive relationship, in which apoptotic cells affected surrounding cells to proliferate through cellular signaling pathways such as Wnt signaling. 56 Therefore, we speculate that after active cluster formation through sufficient cycles of proliferation, the cellular state accordingly entered into the apoptotic phase to regulate the cluster cell mass, resulting in subsequent cluster dissociation on site. At the same time, serial de novo cluster formations might be induced by cellular signal transduction pathways from apoptotic cells as shown in cluster dissociation (asterisk) and formation (arrowhead) in Figure 2A. Moreover, the coordinated BM vascular dynamics with cluster dynamics of transferred HSPCs suggested the vascular niche for cellular engraftment, which has been reported by several studies. 58 , 59 , 60 , 61 , 62
We believe the collective spatiotemporal cellular behaviors of HSPCs with distinct cellular density coordinated with proliferation and migration dynamics in vivo suggest a possibility of cell‐to‐cell signaling in cluster formation and dissociation dynamics during early engraftment phase. It has been speculated that HSPCs wander around the BM niche searching for optimal BM microenvironment for engraftment in the distantly located condition, gather to appropriate BM areas in a collective manner, and initiate cluster formation through multiple cycles of active proliferation and migration in closely‐located condition. The observation that HSPCs tended to be less motile and highly proliferative in closely located condition clearly suggests that HSPCs could sense cell proximity via cell to cell signaling to regulate cellular action for cluster formation‐dissociation during engraftment. Furthermore, our finding that three different phases of cellular engraftment were simultaneously presented in multi‐position imaging areas suggests that different BM areas have a distinct niche for engraftment, which has been suggested in a previous study. 47 Additionally, our imaging results suggest that each BM area at the same post‐transplant day has a distinct status in regards to niche for engraftment and each BM area may undergo the three distinguishable cellular phases over time, that is, distant‐intermediate‐close condition. When it reaches a saturated condition with increasing number of cells by active proliferation and migration (day 7 in Figure 2A), it may enter into the apoptotic phase and exhibit cluster dissociation in vivo. However, it has not been analyzed in vivo whether the BM area of de novo cluster formation around the dissociation spot will undergo similar development over time, which requires further imaging analysis of in vivo cluster monitoring over 10 days after the HSCT. Further studies are required to identify the detailed underlying cellular and molecular mechanisms of the engraftment process. Nevertheless, we believe that these newly identified collective engraftment dynamics can be further investigated to identify unknown cellular mechanisms involved in homing and engraftment, which can lead to new clues to alleviate pathological complications and to improve engraft efficiency and immune recovery after transplantation.
AUTHOR CONTRIBUTIONS
S. Ahn and P. Kim designed the study; S. Ahn and P. Kim implemented the experimental setup; S. Ahn and B.I. Koh performed the experiments; S. Ahn, J. Lee, and S. Hong performed data analysis; S. Ahn, I. Kim, and P. Kim wrote the manuscript. All authors contributed data interpretation and reviewed the manuscript.
FUNDING INFORMATION
National Research Foundation of Korea (NRF), Grant/Award Number: 2020R1A2C3005694.
CONFLICT OF INTEREST
P.K. is a founder and the major stock holder of IVIM Technology, and S.A. is the employee of IVIM Technology. The other authors declare no competing or financial interests.
Supporting information
Figure S1
Figure S2
Figure S3
Figure S4
Figure S5
Figure S6
Video 1
Video 2
Video 3
Video 4
Video 5
Video 6
Appendix S1
Appendix S2
Appendix S3
ACKNOWLEDGMENTS
This work was supported by the Basic Research Program through the National Research Foundation of Korea (NRF) funded by the Ministry of Science and ICT (2020R1A2C3005694). We thank Suyeon Lee and Juhee Back for technical assistance, Dr. Gou Young Koh (KAIST) for generously providing β‐actin‐DsRed transgenic mice and Dr. Koichi Nishiyama and Hitoshi Takizawa (Kumamoto University) for academic discussions. This manuscript has been edited by Life Science Editors.
Ahn S, Koh BI, Lee J, Hong S, Kim I, Kim P. In vivo observation of multi‐phase spatiotemporal cellular dynamics of transplanted HSPCs during early engraftment. FASEB BioAdvances. 2022;4:547‐559. doi: 10.1096/fba.2021-00164
DATA AVAILABILITY STATEMENT
The data that support the findings of this study are available in the supplementary material of this article.
REFERENCES
- 1. Negrin RS. Introduction to the review series on "Advances in hematopoietic cell transplantation". Blood. 2014;124(3):307. [DOI] [PubMed] [Google Scholar]
- 2. Goncalves TL, Benvegnu DM, Bonfanti G. Specific factors influence the success of autologous and allogeneic hematopoietic stem cell transplantation. Oxid Med Cell Longev. 2009;2(2):82‐87. [DOI] [PMC free article] [PubMed] [Google Scholar]
- 3. Hierlmeier S, Eyrich M, Wolfl M, Schlegel PG, Wiegering V. Early and late complications following hematopoietic stem cell transplantation in pediatric patients ‐ A retrospective analysis over 11 years. PLoS One. 2018;13(10):e0204914. [DOI] [PMC free article] [PubMed] [Google Scholar]
- 4. Pandey T, Maximin S, Bhargava P. Imaging of complications from hematopoietic stem cell transplant. Indian J Radiol Imaging. 2014;24(4):327‐338. [DOI] [PMC free article] [PubMed] [Google Scholar]
- 5. Guillaume T, Rubinstein DB, Symann M. Immune reconstitution and immunotherapy after autologous hematopoietic stem cell transplantation. Blood. 1998;92(5):1471‐1490. [PubMed] [Google Scholar]
- 6. Seggewiss R, Einsele H. Immune reconstitution after allogeneic transplantation and expanding options for immunomodulation: an update. Blood. 2010;115(19):3861‐3868. [DOI] [PubMed] [Google Scholar]
- 7. Brown VI. Hematopoietic stem cell transplantation for the pediatric hematologist/oncologist. Springer Berlin Heidelberg; 2017. [Google Scholar]
- 8. Bosch M, Khan FM, Storek J. Immune reconstitution after hematopoietic cell transplantation. Curr Opin Hematol. 2012;19(4):324‐335. [DOI] [PubMed] [Google Scholar]
- 9. Loukogeorgakis SP, Fachin CG, Dias A, et al. Donor cell engineering with GSK3 inhibitor‐loaded nanoparticles enhances engraftment after in utero transplantation. Blood. 2019;134(22):1983‐1995. [DOI] [PubMed] [Google Scholar]
- 10. Ruggeri A, Labopin M, Sormani MP, et al. Engraftment kinetics and graft failure after single umbilical cord blood transplantation using a myeloablative conditioning regimen. Haematologica. 2014;99(9):1509‐1515. [DOI] [PMC free article] [PubMed] [Google Scholar]
- 11. Ratajczak MZ, Suszynska M. Emerging strategies to enhance homing and engraftment of hematopoietic stem cells. Stem Cell Rev Rep. 2016;12(1):121‐128. [DOI] [PMC free article] [PubMed] [Google Scholar]
- 12. Ng AP, Alexander WS. Haematopoietic stem cells: past, present and future. Cell Death Discov. 2017;3:17002. [DOI] [PMC free article] [PubMed] [Google Scholar]
- 13. Schmitz N, Lenz G, Stelljes M. Allogeneic hematopoietic stem cell transplantation for T‐cell lymphomas. Blood. 2018;132(3):245‐253. [DOI] [PubMed] [Google Scholar]
- 14. Ljungman P, Bregni M, Brune M, et al. Allogeneic and autologous transplantation for haematological diseases, solid tumours and immune disorders: current practice in Europe 2009. Bone Marrow Transplant. 2010;45(2):219‐234. [DOI] [PubMed] [Google Scholar]
- 15. Lam BS, Cunningham C, Adams GB. Mechanism of Calcium Sensing Receptor Mediated Hematopoietic Stem Cell Lodgment In the Adult Bone Marrow Niche. Blood. 2010;116(21):178‐179. [Google Scholar]
- 16. Caocci G, Greco M, La Nasa G. Bone Marrow Homing and Engraftment Defects of Human Hematopoietic Stem and Progenitor Cells. Mediterr J Hematol Infect Dis. 2017;9(1):e2017032. [DOI] [PMC free article] [PubMed] [Google Scholar]
- 17. van den Brink MR, Velardi E, Perales MA. Immune reconstitution following stem cell transplantation. Hematology Am Soc Hematol Educ Program. 2015;2015:215‐219. [DOI] [PubMed] [Google Scholar]
- 18. Askenasy N, Farkas DL. In vivo imaging studies of the effect of recipient conditioning, donor cell phenotype and antigen disparity on homing of haematopoietic cells to the bone marrow. Br J Haematol. 2003;120(3):505‐515. [DOI] [PubMed] [Google Scholar]
- 19. Lo Celso C, Lin CP, Scadden DT. In vivo imaging of transplanted hematopoietic stem and progenitor cells in mouse calvarium bone marrow. Nat Protoc. 2011;6(1):1‐14. [DOI] [PMC free article] [PubMed] [Google Scholar]
- 20. Bixel MG, Kusumbe AP, Ramasamy SK, et al. Flow Dynamics and HSPC Homing in Bone Marrow Microvessels. Cell Rep. 2017;18(7):1804‐1816. [DOI] [PMC free article] [PubMed] [Google Scholar]
- 21. Malide D, Metais JY, Dunbar CE. Dynamic clonal analysis of murine hematopoietic stem and progenitor cells marked by 5 fluorescent proteins using confocal and multiphoton microscopy. Blood. 2012;120(26):e105‐e116. [DOI] [PMC free article] [PubMed] [Google Scholar]
- 22. Lin Y, Molter J, Lee Z, Gerson SL. Bioluminescence imaging of hematopoietic stem cell repopulation in murine models. Methods Mol Biol. 2008;430:295‐306. [DOI] [PubMed] [Google Scholar]
- 23. Wang XL, Rosol M, Ge SD, et al. Dynamic tracking of human hematopoietic stem cell engraftment using in vivo bioluminescence imaging. Blood. 2003;102(10):3478‐3482. [DOI] [PubMed] [Google Scholar]
- 24. Cao YA, Wagers AJ, Beilhack A, et al. Shifting foci of hematopoiesis during reconstitution from single stem cells. Proc Natl Acad Sci U S A. 2004;101(1):221‐226. [DOI] [PMC free article] [PubMed] [Google Scholar]
- 25. Mezzanotte L, Iljas JD, Que I, et al. Optimized longitudinal monitoring of stem cell grafts in mouse brain using a novel bioluminescent/near infrared fluorescent fusion reporter. Cell Transplant. 2017;26(12):1878‐1889. [DOI] [PMC free article] [PubMed] [Google Scholar]
- 26. Lin Y, Cheung P, Roth JC, Wilson DL, Gerson SL. Imaging stem cell‐derived persistent foci after in vivo selection of lentiviral MGMT‐P140K transduced murine bone marrow cells. Mol Ther. 2011;19(7):1342‐1352. [DOI] [PMC free article] [PubMed] [Google Scholar]
- 27. Gu E, Chen WY, Gu J, Burridge P, Wu JC. Molecular imaging of stem cells: tracking survival, biodistribution, tumorigenicity, and immunogenicity. Theranostics. 2012;2(4):335‐345. [DOI] [PMC free article] [PubMed] [Google Scholar]
- 28. Kraitchman DL, Bulte JWM. Imaging of stem cells using MRI. Basic Res Cardiol. 2008;103(2):105‐113. [DOI] [PMC free article] [PubMed] [Google Scholar]
- 29. Zheng Y, Huang J, Zhu T, et al. Stem cell tracking technologies for neurological regenerative medicine purposes. Stem Cells Int. 2017;2017:2934149. [DOI] [PMC free article] [PubMed] [Google Scholar]
- 30. Cen P, Chen J, Hu C, Fan L, Wang J, Li L. Noninvasive in‐vivo tracing and imaging of transplanted stem cells for liver regeneration. Stem Cell Res Ther. 2016;7(1):143. [DOI] [PMC free article] [PubMed] [Google Scholar]
- 31. Wang JX, Jokerst JV. Stem cell imaging: tools to improve cell delivery and viability. Stem Cells Int. 2016;2016:1‐16. [DOI] [PMC free article] [PubMed] [Google Scholar]
- 32. Gildehaus FJ, Haasters F, Drosse I, et al. Impact of indium‐111 oxine labelling on viability of human mesenchymal stem cells in vitro, and 3D cell‐tracking using SPECT/CT in vivo. Mol Imaging Biol. 2011;13(6):1204‐1214. [DOI] [PubMed] [Google Scholar]
- 33. Kraitchman DL, Tatsumi M, Gilson WD, et al. Dynamic imaging of allogeneic mesenchymal stem cells trafficking to myocardial infarction. Circulation. 2005;112(10):1451‐1461. [DOI] [PMC free article] [PubMed] [Google Scholar]
- 34. Blackwood KJ, Lewden B, Wells RG, et al. In vivo SPECT quantification of transplanted cell survival after engraftment using in‐111‐tropolone in infarcted canine myocardium. J Nucl Med. 2009;50(6):927‐935. [DOI] [PubMed] [Google Scholar]
- 35. Wolfs E, Struys T, Notelaers T, et al. 18F‐FDG labeling of mesenchymal stem cells and multipotent adult progenitor cells for PET imaging: effects on ultrastructure and differentiation capacity. J Nucl Med. 2013;54(3):447‐454. [DOI] [PubMed] [Google Scholar]
- 36. Wu JC, Cao F, Dutta S, et al. Proteomic analysis of reporter genes for molecular imaging of transplanted embryonic stem cells. Proteomics. 2006;6(23):6234‐6249. [DOI] [PMC free article] [PubMed] [Google Scholar]
- 37. Rueger MA, Backes H, Walberer M, et al. Noninvasive imaging of endogenous neural stem cell mobilization in vivo using positron emission tomography. J Neurosci. 2010;30(18):6454‐6460. [DOI] [PMC free article] [PubMed] [Google Scholar]
- 38. Kim P, Puoris'haag M, Cote D, Lin CP, Yun SH. In vivo confocal and multiphoton microendoscopy. J Biomed Opt. 2008;13(1):010501. [DOI] [PMC free article] [PubMed] [Google Scholar]
- 39. Kim P, Chung E, Yamashita H, et al. In vivo wide‐area cellular imaging by side‐view endomicroscopy. Nat Methods. 2010;7(4):303‐305. [DOI] [PMC free article] [PubMed] [Google Scholar]
- 40. Ahn S, Choe K, Lee S, et al. Intravital longitudinal wide‐area imaging of dynamic bone marrow engraftment and multilineage differentiation through nuclear‐cytoplasmic labeling. PLoS One. 2017;12(11):e0187660. [DOI] [PMC free article] [PubMed] [Google Scholar]
- 41. Choi H, Kim Y, Mirzaaghasi A, et al. Exosome‐based delivery of super‐repressor IkappaBalpha relieves sepsis‐associated organ damage and mortality. Sci Adv. 2020;6(15):eaaz6980. [DOI] [PMC free article] [PubMed] [Google Scholar]
- 42. Vintersten K, Monetti C, Gertsenstein M, et al. Mouse in red: red fluorescent protein expression in mouse ES cells, embryos, and adult animals. Genesis. 2004;40(4):241‐246. [DOI] [PubMed] [Google Scholar]
- 43. Hoffman RM. Imaging in mice with fluorescent proteins: from macro to subcellular. Sensors (Basel). 2008;8(2):1157‐1173. [DOI] [PMC free article] [PubMed] [Google Scholar]
- 44. Kwak HW, Park HJ, Ko HL, et al. Cricket paralysis virus internal ribosome entry site‐derived RNA promotes conventional vaccine efficacy by enhancing a balanced Th1/Th2 response. Vaccine. 2019;37(36):5191‐5202. [DOI] [PMC free article] [PubMed] [Google Scholar]
- 45. Ha JY, Choi SY, Lee JH, Hong SH, Lee HJ. Delivery of periodontopathogenic extracellular vesicles to brain monocytes and microglial IL‐6 promotion by RNA cargo. Front Mol Biosci. 2020;7:596366. [DOI] [PMC free article] [PubMed] [Google Scholar]
- 46. Choe K, Jang JY, Park I, et al. Intravital imaging of intestinal lacteals unveils lipid drainage through contractility. J Clin Invest. 2015;125(11):4042‐4052. [DOI] [PMC free article] [PubMed] [Google Scholar]
- 47. Le VH, Lee S, Lee S, et al. In vivo longitudinal visualization of bone marrow engraftment process in mouse calvaria using two‐photon microscopy. Sci Rep. 2017;7:44097. [DOI] [PMC free article] [PubMed] [Google Scholar]
- 48. Scott MK, Akinduro O, Lo Celso C. In vivo 4‐dimensional tracking of hematopoietic stem and progenitor cells in adult mouse calvarial bone marrow. J Vis Exp. 2014;(91):e51683. doi: 10.3791/51683 [DOI] [PMC free article] [PubMed] [Google Scholar]
- 49. Mizuno H, Nakazawa S, Iwasato T. In vivo two‐photon imaging of cortical neurons in neonatal mice. J Vis Exp. 2018;(140):58340. [DOI] [PMC free article] [PubMed] [Google Scholar]
- 50. Park I, Choe K, Seo H, et al. Intravital imaging of a pulmonary endothelial surface layer in a murine sepsis model. Biomed Opt Express. 2018;9(5):2383‐2393. [DOI] [PMC free article] [PubMed] [Google Scholar]
- 51. Park I, Kim M, Choe K, et al. Neutrophils disturb pulmonary microcirculation in sepsis‐induced acute lung injury. Eur Respir J. 2019;53(3):1800786. [DOI] [PMC free article] [PubMed] [Google Scholar]
- 52. Holtmaat A, Bonhoeffer T, Chow DK, et al. Long‐term, high‐resolution imaging in the mouse neocortex through a chronic cranial window. Nat Protoc. 2009;4(8):1128‐1144. [DOI] [PMC free article] [PubMed] [Google Scholar]
- 53. Kwarteng EO, Heinonen KM. Competitive Transplants to Evaluate Hematopoietic Stem Cell Fitness. J Vis Exp. 2016;(114):54345. [DOI] [PMC free article] [PubMed] [Google Scholar]
- 54. Challen GA, Boles N, Lin KK, Goodell MA. Mouse hematopoietic stem cell identification and analysis. Cytometry A. 2009;75(1):14‐24. [DOI] [PMC free article] [PubMed] [Google Scholar]
- 55. Alenzi FQ, Alenazi BQ, Ahmad SY, Salem ML, Al‐Jabri AA, Wyse RK. The haemopoietic stem cell: between apoptosis and self renewal. Yale J Biol Med. 2009;82(1):7‐18. [PMC free article] [PubMed] [Google Scholar]
- 56. Brock CK, Wallin ST, Ruiz OE, et al. Stem cell proliferation is induced by apoptotic bodies from dying cells during epithelial tissue maintenance. Nat Commun. 2019;10(1):1044. [DOI] [PMC free article] [PubMed] [Google Scholar]
- 57. Yang J, Aguila JR, Alipio Z, Lai R, Fink LM, Ma Y. Enhanced self‐renewal of hematopoietic stem/progenitor cells mediated by the stem cell gene Sall4. J Hematol Oncol. 2011;4:38. doi: 10.1186/1756-8722-4-38 [DOI] [PMC free article] [PubMed] [Google Scholar]
- 58. Crane GM, Jeffery E, Morrison SJ. Adult haematopoietic stem cell niches. Nat Rev Immunol. 2017;17(9):573‐590. [DOI] [PubMed] [Google Scholar]
- 59. Itkin T, Gur‐Cohen S, Spencer JA, et al. Distinct bone marrow blood vessels differentially regulate haematopoiesis. Nature. 2016;532(7599):323‐328. [DOI] [PMC free article] [PubMed] [Google Scholar]
- 60. Koechlein CS, Harris JR, Lee TK, et al. High‐resolution imaging and computational analysis of haematopoietic cell dynamics in vivo. Nat Commun. 2016;7:12169. [DOI] [PMC free article] [PubMed] [Google Scholar]
- 61. Morrison SJ, Scadden DT. The bone marrow niche for haematopoietic stem cells. Nature. 2014;505(7483):327‐334. [DOI] [PMC free article] [PubMed] [Google Scholar]
- 62. Rafii S, Butler JM, Ding BS. Angiocrine functions of organ‐specific endothelial cells. Nature. 2016;529(7586):316‐325. [DOI] [PMC free article] [PubMed] [Google Scholar]
Associated Data
This section collects any data citations, data availability statements, or supplementary materials included in this article.
Supplementary Materials
Figure S1
Figure S2
Figure S3
Figure S4
Figure S5
Figure S6
Video 1
Video 2
Video 3
Video 4
Video 5
Video 6
Appendix S1
Appendix S2
Appendix S3
Data Availability Statement
The data that support the findings of this study are available in the supplementary material of this article.