

Abstract
Diffuse large B‐cell lymphoma (DLBCL) is the most common type of non‐Hodgkin lymphoma and is a potentially curable disease. However, it is heterogenous, and the prognosis is poor if the tumor cells harbor fusions involving MYC and BCL2 or MYC and BCL6 (double‐hit [DH] lymphoma), or fusions involving all three genes (triple‐hit [TH] lymphoma). Fluorescence in situ hybridization is currently the gold standard for confirming the presence of DH/TH genotypes. However, the test is laborious and not readily available in some laboratories. Germinal center B (GCB) signatures and dual expression of MYC and BCL2 are commonly used as initial screening markers (traditional model) in clinical practice. Our study proposes immunohistochemical markers for more conveniently and accessibly screening DH/TH genotypes in DLBCL. We retrospectively reviewed the clinical and pathological parameters of patients with DLBCL. We assessed the proliferative index, apoptotic index, and tumor microenvironment (TME), with regard to T cells and CD11c(+) dendritic cells, in formalin‐fixed paraffin‐embedded tissue. We then generated a decision tree as a screening algorithm to predict DH/TH genotypes and employed decision curve analysis to demonstrate the superiority of this new model in prediction. We also assessed the prognostic significance of related parameters. Our study revealed that GCB subtypes, a Ki67 proliferative index higher than 70%, and BCL2 expression were significantly associated with DH/TH genotypes. Decreased CD11c(+) dendritic cells in the TME indicated additional risk. Our proposed screening algorithm outperformed a traditional model in screening for the DH/TH genotypes. In addition, decreased CD11c(+) dendritic cells in the DLBCL TME were an independent unfavorable prognosticator. In conclusion, we provide a convenient, well‐performing model that predicts DH/TH genotypes in DLBCL. The prognostic significance of CD11c(+) dendritic cells in the TME might influence the classification and development of immunotherapy for DLBCL in the future.
Keywords: high‐grade B‐cell lymphoma with MYC and BCL2 and/or BCL6 rearrangements, double‐hit lymphoma, triple‐hit lymphoma, diffuse large B‐cell lymphoma, tumor microenvironment, dendritic cell, decision curve analysis
Introduction
Diffuse large B‐cell lymphoma (DLBCL) is a highly heterogeneous type of aggressive B‐cell lymphoma and is the most common type of non‐Hodgkin lymphoma worldwide [1]. Approximately 60% of patients are cured using the current standard regimen of rituximab plus cyclophosphamide, doxorubicin, vincristine, and prednisone [2]. However, approximately 10% of these patients harbor rearrangements of MYC and BCL2, MYC and BCL6 (double‐hit [DH] lymphoma), or all three genes (triple‐hit [TH] lymphoma) [3, 4] with a median survival of 1 year [5, 6]. Although a standard of care has not been established, guidelines from the National Comprehensive Cancer Network suggest that more aggressive treatment regimens may improve outcomes [7, 8, 9]. These cases are classified as a distinct entity called ‘high‐grade B‐cell lymphoma with MYC and BCL2 and/or BCL6 rearrangements’ (HGBL‐DH/TH) according to the World Health Organization (WHO) classification system [1].
As a means of distinguishing HGBL‐DH/TH from other types of DLBCL, the detection of MYC, BCL2, and BCL6 rearrangements using fluorescence in situ hybridization (FISH) is currently the gold standard [1, 10]. However, the FISH test is expensive, laborious, and inaccessible to some pathological laboratories [4]. Therefore, a more convenient and accessible screening strategy for HGBL‐DH/TH with DLBCL morphology is an unmet clinical need [4, 10].
Recently, two independent studies have established the molecular differences in gene expression profiling between HGBL‐DH/TH and other types of DLBCL [11, 12]. HGBL‐DH/TH tended to express higher levels of MYC and its targets (proliferative phenotypes), decreased expression of genes associated with apoptosis, and genes related to T cells and dendritic cells in the tumor microenvironment (TME) [11, 12]. Although gene expression profiling, even a simplified approach, may aid in the differentiation of HGBL‐DH/TH from other types of DLBCL, this method is still not practical for routine pathological examination [11, 12].
The influence of TME on DLBCL was also demonstrated by a recent study on immune‐related gene expression profiles. The study participants were patients with high‐risk DLBCL, and patients with HGBL‐DH/TH were excluded. The study demonstrated that a lower proportion of myofibroblasts, CD4+ T cells, and dendritic cells correlated with poorer outcomes [13]. Whether these TME features could predict HGBL‐DH/TH is unclear.
In the present study, we explored the utility of immunohistochemical (IHC) staining on pathological samples for the examination of cellular proliferation, apoptosis, T cells, and dendritic cells to distinguish HGBL‐DH/TH from other types of DLBCL. By decision tree analysis and decision curve analysis (DCA), we established that the presence of germinal center B (GCB) subtypes, a higher proliferative index, BCL2 expression, and a decreased number of dendritic cells in the TME indicated improved performance in the screening of HGBL‐DH/TH compared with the traditional GCB subtypes and the dual expression of MYC and BCL2 (double‐expressor lymphoma, DEL) method. Moreover, a decrease in dendritic cells in the TME was an independent unfavorable prognostic factor for overall survival.
Materials and methods
Cohort and specimen collection
This was a retrospective study conducted at the National Taiwan University Hospital (NTUH) and National Taiwan University Cancer Center (details provided in supplementary material, Table S1). The cohort included consecutive NTUH patients with newly diagnosed (de novo and secondary) lymphoma with data on DLBCL morphology and immunophenotypes but not data on FISH findings, and the data covered the period from May 2012 to December 2016 (cohort 1). To enrich the small set of data on HGBL‐DH/TH to improve model training, we included an additional 12 patients with FISH‐confirmed HGBL‐DH/TH and 21 with DLBCL, not otherwise specified (NOS) (which meant no DH/TH genotypes) for the period of January 2017 to May 2021 (cohort 2).
Formalin‐fixed paraffin‐embedded (FFPE) tissue blocks and glass slides were obtained for each of the patients. All slides were reviewed by a hematopathologist (C‐TY) according to the WHO diagnostic criteria. The exclusion criteria were (1) patients under 18 years old, (2) glass slides and/or FFPE blocks unavailable for review, (3) cases not fulfilling the diagnostic criteria of either DLBCL or HGBL‐DH/TH according to the WHO classification system, and (4) tumor cells of insufficient quality or quantity for analysis. All the studies were designed and performed under the guidance of the institutions' research ethics committees.
Clinical information
Clinical data at diagnosis were retrieved from electronic medical records; these data included sex, age, date of diagnosis, laboratory data at disease onset, findings from imaging studies for staging, international prognostic index (IPI) score, induction regimens, date of last follow‐up, and survival status at the last follow‐up.
IHC study and chromogenic in situ hybridization
The IHC staining markers included CD20, CD79a, PAX5, CD3, CD5, cyclin D1, SOX11, CD10, BCL6, MUM1, MYC, BCL2, and CD11c (see supplementary material, Table S2 for details of the antibodies used in this study). An Epstein–Barr virus‐encoded small RNA probe (DNP probe, Ventana, Tucson, AZ, USA) and an ISH iView Kit (Ventana) were used for Epstein–Barr virus detection. IHC and chromogenic in situ hybridization were performed using an automated immunostainer (BENCHMARK XT, Ventana).
At least one B‐cell marker (CD20, CD79a, or PAX5) with diffuse (almost 100%) expression and without T‐cell marker (CD3) expression was used to determine the B‐cell lineage. If at least two of the CD5, cyclin D1, and SOX11 biomarkers were positive (staining on >10% of the total tumor cells), pleomorphic mantle cell lymphoma was diagnosed and the patient was excluded from the cohort [14]. Hans algorithms were used to determine the cell‐of‐origin (COO) [1]; the thresholds for CD10, BCL6, and MUM1 were 30%, and the thresholds for MYC and BCL2 were 40 and 50%, respectively [1].
Quantitative analysis of proliferation, apoptosis, T cells, and dendritic cells using immunohistochemistry
All the parameters were analyzed either through visual inspection by pathologists (C‐TY and/or KC), who were blinded to the original diagnoses, or by digital pathology (supplementary material, Table S3).
For digital pathology, the slides were scanned using a 3D Histech P250 High‐Capacity Slide Scanner (3DHISTECH Ltd, Budapest, Hungary). A 4‐mm2 representative region of interest (ROI) within the tumors was selected by a pathologist (C‐TY). These ROIs were quantitatively analyzed using either QuPath software [15] or StrataQuest software (TissueGnostics, Vienna, Austria).
Proliferation was assessed by Ki67 proliferative index, defined by the ratio of the Ki67‐positive cell count to the nucleated cell count (theoretical range: 0–100%). Apoptosis was evaluated using activated caspase‐3 immunostaining. We defined the apoptotic index as the ratio of activated caspase‐3‐positive areas to the nucleated areas (theoretical range: 0–100%). We chose to use the area ratio rather than count because a single cell could produce apoptotic bodies of a heterogeneous size and number; thus, the total apoptotic body area would better represent cellular apoptotic activity. The proliferation–apoptosis ratio, which represents the balance between proliferation and apoptosis, was also calculated. The T‐cell percentage was evaluated as the ratio of the CD3‐positive cell count to the nucleated cell count (theoretical range: 0–100%). All slides were visually inspected and scored by one pathologist. In addition, 10 randomly selected slides were scored by another pathologist and/or through digital pathology. The results were compared for interobserver reliability.
The dendritic cells were quantified by CD11c IHC, which is a lineage‐specific marker for classical dendritic cells [16]. The CD11c ratio was determined by the CD11c‐stained area to the colored area (equation included in the extended method description in Supplementary materials and methods, theoretical range: 0–1). The ratios were calculated using software because the pathologists were relatively unfamiliar with the CD11c staining pattern. After training, a pathologist (C‐TY) classified the CD11c slides without any knowledge of the digital pathology results. The pathologist's interpretation was compared with the software‐produced result to assess accuracy.
FISH for MYC , BCL2 , and BCL6 rearrangements
We evaluated the MYC, BCL2, and BCL6 rearrangements using FISH and break‐apart probes (Vysis MYC, BCL2, BCL6 Break‐Apart FISH Probe Kit, Abbott Molecular, Des Plaines, IL, USA). Tissue sections with a thickness of 3 μm were cut from the FFPE blocks, pretreated with a buffer for 65 min, and digested by protease IV for 75 min. Probes were hybridized on a ThermoBrite system (Abbott) overnight, and 4′,6‐diamidino‐2‐phenylindole (DAPI) was used for counterstaining.
Rearrangement was defined by the presence of adequate cells with split signals, which was defined as a green signal that was two signal diameters away from a red signal or vice versa. Cells with independent green signals with no red signal nearby, or vice versa, were also considered positive for split signals [17]. We used non‐neoplastic tonsil from 20 control individuals to determine the cut‐off values, which were defined to be three standard deviations from the mean. In our laboratory, the values were 6, 7, and 7 for the MYC, BCL2, and BCL6 probes, respectively, from the 100 cells counted.
Statistics
All statistical analyses were performed using R software (version 4.0.2, R Core Team, 2020). The Wilcoxon signed‐rank test (or Student's t‐test), Kruskal–Wallis test, Fisher's exact test (or chi‐square test), and linear‐by‐linear test were used to compare the clinical and pathological parameters (α = 0.05) according to the type of variable. Lugano stage and IPI group were treated as ordinal variables.
The available‐case method was used for missing data based on a univariate analysis of the clinical and pathological parameters. For random forest, decision tree, and DCAs, we adopted the method of multivariate imputation by chained equations (R package mice, v3.13.0) [18] to impute missing data.
A receiver operating characteristic (ROC) curve was drawn and the area under the curve (AUC; α = 0.05) was determined to identify potential predictivity (R package ROCit, v2.1.1) [19]. The Youden index was used to determine the cutoff for the Ki67 proliferative index, apoptotic index, T‐cell percentage, and CD11c ratio. The interobserver reliability of the pathological quantification was assessed using the Pearson correlation coefficient or Cramer V coefficient according to the type of variable.
To establish the model, we initially used the random forest method to select the potential variables for predicting HGBL‐DH/TH and to minimize overfitting (R randomForest package, v4.6‐14) [20]. Subsequently, a screening strategy was determined using a decision tree analysis (R rpart package, v4.1‐16) [21]. A DCA was used to determine the improvement yielded by our proposed model relative to that of a traditional model [22]. In brief, DCA is an analysis tool to facilitate a decision of adopting a diagnostic test based on a patient's considerations on the benefit and risk of a specific diagnostic procedure. The R source code was derived from the Memorial Sloan Kettering Cancer Center (NY, USA) [23]. A detailed explanation of DCA is given in the extended methods in Supplementary materials and methods.
A log‐rank test was used to conduct a Kaplan–Meier survival analysis with the aid of the survival (v3.3‐1) [24] and survminer packages (v0.4.9; α = 0.05) [25] in R. A multivariate Cox regression was used to evaluate the prognostic significance of the clinical and pathological parameters. Transplantation status was treated as a time‐dependent variable. The methods are detailed in Supplementary materials and methods.
Results
Clinical features
Two cohorts participated in the study. Cohort 1 included 169 consecutive patients from a total of 539 (31.4%) patients who were newly diagnosed with lymphoma with DLBCL morphology and immunophenotypes (supplementary material, Figure S1). Cohort 2 included an additional 12 patients with HGBL‐DH/TH and 21 with DLBCL, NOS. Together, the cohorts comprised a total of 202 patients with DLBCL, including 19 patients with HBGL‐DH/TH and 183 patients with DLBCL, NOS. The cases of HGBL‐DH/TH comprised eight cases of MYC/BCL2‐DH, six cases of MYC/BCL6‐DH, and five cases of TH.
The clinical parameters of the participants are listed in Table 1 (stratified by HGBL‐DH/TH and DLBCL, NOS) and supplementary material, Table S4 (stratified by cohort 1 and cohort 2). The prevalence of HGBL‐DH/TH in the consecutive cohort (cohort 1) was 4.1% (7/169; supplementary material, Table S4) and represents the true prevalence of HGBL‐DH/TH in patients with DLBCL. Compared with DLBCL NOS, HGBL‐DH/TH was associated with a significantly higher level of lactate dehydrogenase (73.7 versus 40.3%), higher rates of Lugano stages 3 and 4 (100 versus 52.7%), more than one site of extranodal involvement (57.9 versus 25.3%), and, consequently, a higher rate of being in a high‐risk or moderate‐to‐high‐risk IPI group (84.2 versus 38.8%). These results indicate that HGBL‐DH/TH exhibited aggressive clinical behavior (Table 1). Patients with HGBL‐DH/TH also received aggressive induction regimen more frequently (31.6 versus 4.9%) (Table 1).
Table 1.
Comparison of clinical parameters among the different types of lymphoma in the whole cohort (including cohort 1 and cohort 2)
| Parameter | Total (N = 202) † | HGBL‐DH/TH (N = 19) † | DLBCL, NOS (N = 183) † | P value |
|---|---|---|---|---|
| Male sex, no. (%) | 112 (55.4%) | 12 (63.2%) | 100 (54.6%) | 0.63 |
| Age, years | ||||
| Median (IQR) | 62.5 (20.7) | 62.2 (21.5) | 62.7 (20.5) | 0.63 |
| Range | 25.1–97.6 | 44.3–87.0 | 25.1–97.6 | |
| B symptoms, no. (%) | 79 (39.1%) | 10 (52.6%) | 69 (37.7%) | 0.22 |
| Elevated serum LDH ‡ , no. (%) | 85/195 (43.6%) | 14 (73.7%) | 71/176 (40.3%) | 0.007** |
| Stage (Lugano), no. (%) | ||||
| I | 36/199 (18.1%) | 0 (0%) | 36/180 (20.0%) | 0.0003*** |
| II | 49/199 (24.6%) | 0 (0%) | 49/180 (27.2%) | |
| III | 31/199 (15.6%) | 5 (26.3%) | 26/180 (14.4%) | |
| IV | 83/199 (41.7%) | 14 (73.7%) | 69/180 (38.3%) | |
| Extranodal sites >1, no. (%) | 56/197 (28.4%) | 11 (57.9%) | 45/178 (25.3%) | 0.006** |
| ECOG‐PS >1, no. (%) | 53/201 (26.4%) | 6 (31.6%) | 47/182 (25.8%) | 0.59 |
| IPI group, no. (%) | ||||
| Low risk | 72/194 (37.1%) | 1 (5.3%) | 71/175 (40.6%) | 0.0003*** |
| Low‐intermediate risk | 38/194 (19.6%) | 2 (10.5%) | 36/175 (20.6%) | |
| High‐intermediate risk | 47/194 (24.2%) | 9 (47.4%) | 38/175 (21.7%) | |
| High risk | 37/194 (19.1%) | 7 (36.8%) | 30/175 (17.1%) | |
| Induction regimen § , no. (%) | 0.001** | |||
| Palliative | 16 (7.9%) | 0 (0%) | 16 (8.7%) | |
| Standard | 171 (84.7%) | 13 (68.4%) | 158 (86.3%) | |
| Aggressive | 15 (7.4%) | 6 (31.6%) | 9 (4.9%) | |
| Stem cell transplantation, no. (%) | 25 (12.4%) | 4 (21.1%) | 21 (11.5%) | 0.26 |
Significance level: *p < 0.05; **p < 0.01; ***p < 0.001.
ECOG‐PS, Eastern Cooperative Oncology Group Performance Status; IQR, interquartile range; LDH, lactate dehydrogenase.
The sample sizes are listed in each cell if there were missing data.
Elevated serum LDH meant serum LDH above the upper normal limit of laboratory reference.
The induction treatment regimen in our cohorts was stratified into ‘palliative’, ‘standard’, and ‘aggressive.’ The ‘palliative’ category included patients who received palliative treatment only or no treatment at all. The ‘standard’ category included R‐CHOP (rituximab plus cyclophosphamide, doxorubicin, vincristine, and prednisone), RB (rituximab and bendamustine), and other similar regimens. The ‘aggressive’ category included DA‐EPOCH‐R (dose‐adjusted etoposide, prednisone, vincristine, cyclophosphamide, and doxorubicin plus rituximab), R‐hyperCVAD (rituximab plus hyperfractionated cyclophosphamide, vincristine, doxorubicin, and dexamethasone), R‐CODOX‐M/R‐IVAC (rituximab plus cyclophosphamide, vincristine, doxorubicin, and high‐dose methotrexate alternating with rituximab plus ifosfamide, etoposide, and high‐dose cytarabine), and R‐ESHAP (rituximab plus etoposide, methylprednisolone, cytarabine, and cisplatin).
Pathological biomarkers
The pathological parameters of the patients are listed in Table 2 and Figure 1. Data relating to pathological parameters were missing (unavailable, especially in consultation cases) for 1.2% of the patients (3.2% for HGBL‐DH/TH; 0.98% for DLBCL, NOS). Most instances of HGBL‐DH/TH featured the GCB subtype of COO, which expressed MYC more frequently and had a higher Ki67 proliferative index. The remaining pathological parameters exhibited no statistical significance in the univariate analysis (Table 2). The continuous variables determined by the two pathologists had a high concordance (supplementary material, Figure S2A–C). In addition, we found no statistically significant difference of CD3(+) T cells or CD11c(+) dendritic cells among tumor tissue from different organs (supplementary material, Figure S3).
Table 2.
Comparison of pathological parameters among different types of lymphoma
| Parameter | Total | HGBL‐DH/TH (N = 19) | DLBCL, NOS (N = 183) | P value † |
|---|---|---|---|---|
| COO = GCB, no. (%) | 96 (47.5%) | 18 (94.7%) | 78 (42.6%) | <0.0001*** |
| EBER | 6/201 (3%) | 0 (0%) | 6/182 (3.3%) | 1 |
| MYC IHC(+), no. (%) | 74 (36.6%) | 11 (57.9%) | 63 (34.4%) | 0.049* |
| BCL2 IHC(+), no. (%) | 143/201 (71.1%) | 17 (89.5%) | 126/182 (69.2%) | 0.068 |
| Double expressor ‡ , no. (%) | 54 (26.7%) | 9 (47.4%) | 45 (24.6%) | 0.052 |
| Ki67 proliferative index, % | ||||
| Median (IQR) | 70 (40) | 80 (30) | 70 (38.75) | 0.01* |
| Range | 3–100 | 25–100 | 3–100 | |
| Apoptotic index, % | ||||
| Median (IQR) | 3 (3.5) | 3 (4.5) | 3 (3.25) | 0.70 |
| Range | 1–25 | 1–15 | 1–25 | |
| Proliferation–apoptosis ratio | ||||
| Median (IQR) | 16.25 (16.67) | 20 (30) | 16 (15.42) | 0.2 |
| Range | 1.33–100 | 6.67–100 | 1.33–100 | |
| CD3, % | ||||
| Median (IQR) | 10 (15) | 15 (15) | 10 (15) | 0.71 |
| Range | 1–70 | 1–25 | 1–70 | |
| CD11c ratio | ||||
| Median (IQR) | 0.275 (0.4) | 0.17 (0.265) | 0.28 (0.4) | 0.21 |
| Range | 0–1 | 0–0.81 | 0–1 |
Significance level: *p < 0.05; **p < 0.01; ***p < 0.001.
EBER, epstein‐Barr‐virus‐encoded small RNA; IQR, interquartile range.
P values in this column represented the univariate analysis of the difference between HGBL‐DH/TH and DLBCL, NOS.
Double expressor: concurrent MYC(+) and BCL2(+) by IHC.
Figure 1.
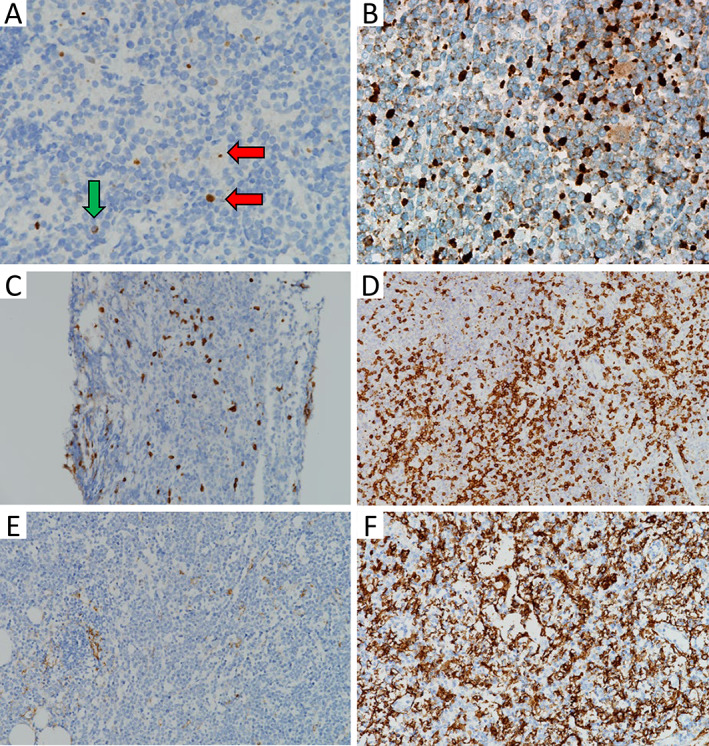
Representative images of potential IHC biomarkers. (A) A case of HGBL‐DH with MYC and BCL2 rearrangements. Nuclear staining irrespective of size was calculated (red horizontal arrow), whereas cytoplasmic staining was not counted (green vertical arrow). The apoptotic index was approximately 1% (×400, activated caspase 3). (B) A case of DLBCL, NOS with MYC rearrangement. The apoptotic index was approximately 10% (×400, activated caspase 3). (C) A case of HGBL‐DH with MYC and BCL6 rearrangements. T‐cell percentage was approximately 5% (×200, CD3). (D) A case of DLBCL, NOS. T‐cell percentage was approximately 30% (×200, CD3). (E) A case of HGBL‐TH. CD11c ratio was 0.01 (×200, CD11c). (F) A case of DLBCL, NOS. CD11c ratio was 0.82 (×200, CD11c).
Establishment of a screening model by random forest and decision tree analysis
We used the ROC curve to determine the optimal threshold for the continuous variables, including the Ki67 proliferative index, apoptotic index, CD3 percentage, and CD11c ratio (supplementary material, Figure S4). The optimal thresholds (Youden index) were 70%, 2%, 25%, and 0.28, respectively. The AUCs were 0.68, 0.52, 0.55, and 0.59, respectively. Only the Ki67 proliferative index reached a significant AUC above the diagonal line of 0.5 (95% confidence interval [CI]: 0.54–0.82). The use of the proliferation–apoptosis ratio did not yield a clearer distinction (AUC = 0.62) than the use of the Ki67 proliferative index alone. Therefore, we chose separate parameters rather than a combination for further analysis. The CD11c ratios determined by the pathologists accorded well with their software‐determined counterparts (supplementary material, Figures S2 D and S5).
We used the random forest method to select the variables for a predictive model and to prevent overfitting in the decision tree analysis. COO, Ki67 index, BCL2 expression, CD3, and CD11c ratio were the key variables for predicting HGBL‐DH/TH (supplementary material, Figure S6). Subsequently, we employed a decision tree analysis to establish an algorithm to predict HGBL‐DH/THs (Figure 2A). In brief, a patient with a DLBCL with a GCB COO, a Ki67 proliferative index >70%, or high BCL2 expression exhibited a risk of HGBL‐DH/TH that was higher than the prevalence of 4.1% in the general population (Figure 2A). Low CD11c staining constituted an additional risk for HGBL‐DH/TH (Figure 2A). CD3 was discarded by the pre‐pruning process in the decision tree analysis (details of pre‐pruning are described in the extended methods in Supplementary materials and methods).
Figure 2.
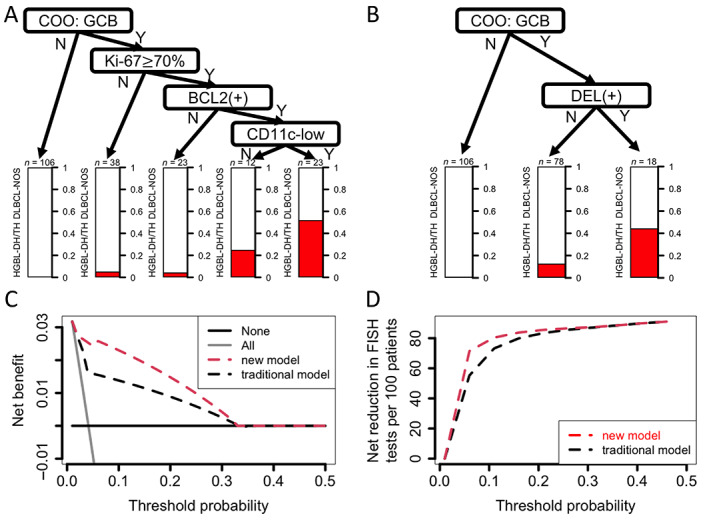
Predictive models for HGBL‐DH/TH and their benefit. (A) Decision tree analysis provided a simple algorithm for practical purposes. Overall, GCB subtypes of COO, high Ki67 proliferative index equal to or more than 70%, and BCL2 expression had non‐negligible risk of HGBL‐DH/TH. Additional CD11c‐low phenotypes implied higher risk. The risk is provided in the bar plot below the ‘leaf’. (B) Traditional decision model by COO and DEL. (C) DCA of the real‐world cohort (cohort 1) showed more net benefit using the new model (in panel A) compared with the traditional model (in panel B). The analysis evaluated the net benefit (y‐axis), which was the difference between true‐positive rate and false‐positive rate (the latter is weighted by a factor for tradeoff). The equation is included in the extended methods in Supplementary materials and methods. The x‐axis is threshold probability, which represents the risk cutoff above which doing the FISH test would be considered. The threshold would differ among each shared decision‐making by patients and clinicians. The higher threshold means greater clinical concern about the FISH test (e.g. the expense). The lower threshold means more clinical concern about missing HGBL‐DH/TH. The light gray line ‘All’ indicates doing a FISH test for all DLBCLs. The slope changes according to disease prevalence. The dark gray line ‘None’ indicates testing no cases for all DLBCL (and hence no net benefit). Overall, the new model provided net benefit over the traditional model with a clinically relevant threshold probability less than 0.33. (D) Net reduction plot in DCA. The new model provided FISH test reduction if the risk threshold was less than 0.33. The highest reduction was approximately 20 per 100 patients for a threshold probability of 0.05.
Validation of the screening model by DCA
To compare the predictive power of the new model (Figure 2A) and the traditional model (Figure 2B) in a real‐world setting, we introduced a DCA and applied it to the consecutive cohort (cohort 1). This served as a better method for evaluating a screening model than ROC curve analysis because the latter fails to account for disease prevalence. In Figure 2C, the threshold probability represents a diagnostic certainty above which the patients would choose a further diagnostic test (i.e. FISH in this context). Therefore, the lower the threshold probability, the more likely the patients would choose to receive the diagnostic test because the side effects or risk of the procedure are considered to be low. On the other hand, the y‐axis represents net benefit, which means the true‐positive rate (i.e. HGBL‐DH/TH) minus false‐positive rate (FISH testing turns out to be DLBCL, NOS) times a weighting factor (i.e. threshold probability/1 − threshold probability) (see the extended methods in Supplementary materials and methods). This weighting factor serves as a compensation for the consequences of false positivity. For example, if a patient has low threshold probability, the weighting factor is small, implying a minimal burden of false positivity and hence a greater net benefit [22]. Our results showed that more HGBL‐DH/TH could be captured (Figure 2C) and more FISH tests can be waived (Figure 2D) by the new model if threshold probability is less than 0.33. For example, suppose that a patient is willing to receive a FISH test if the risk of HGBL‐DH/TH reported by the screening model is more than 15% (i.e. risk threshold is 0.15). The new model is more likely to capture HGBL‐DH/TH (new versus traditional: 71.4 versus 42.9%) than the traditional model, at the expense of a small increased number of FISH tests (13 versus 5.3%; Table 3). For another example with threshold probability of 0.05, our new model can reduce FISH tests (32.5 versus 43.8%) with capture of the same percentage of HGBL‐DH/TH (85.7%) as the traditional model (supplementary material, Table S5).
Table 3.
Cost–benefit analysis, provided a risk above 15% warrants FISH tests, of the real‐world consecutive cohort 1 †
| Predictive model | New ‡ | Traditional § |
|---|---|---|
| Positive predictive value | 22.7% | 33.3% |
| Negative predictive value | 98.6% | 97.5% |
|
No. of FISH required (screening percentage, % ¶ ) |
22 (13.0%) | 9 (5.3%) |
|
No. of HGBL‐DH/TH captured (sensitivity, % †† ) |
5 (71.4%) | 3 (42.9%) |
Cohort 1 contains 169 patients with DLBCL morphology, including 7 HGBL‐DH/TH.
New model means the algorithm provided in Figure 2A. The risk of HGBL‐DH/TH more than 15% is considered to be positive and will receive FISH test.
Traditional model means GCB subtypes combined with MYC and BCL2 double expression are considered to be positive and will receive FISH test.
The percentage is the number of FISH required out of total case number.
The percentage is the number of HGBL‐DH/TH captured out of total HGBL‐DH/TH case number.
CD11c is an independent prognostic factor
Kaplan–Meier survival analysis demonstrated that patients with HGBL‐DH/TH had a statistically significant worse overall survival rate (Figure 3A). Using univariate analysis, we found that low CD11c staining intensity in the TME was an unfavorable factor for survival (Figure 3B,C). The result held true after adjusting for other clinical and pathological parameters (hazard ratio: 1.91; 95% CI: 1.08–3.40; p = 0.027 < 0.05; Table 4). CD11c intensity, formulated as a continuous variable in regression analysis, remained prognostically significant (for each 0.1 decrease in the CD11c ratio: hazard ratio: 1.19; 95% CI: 1.04–1.35).
Figure 3.
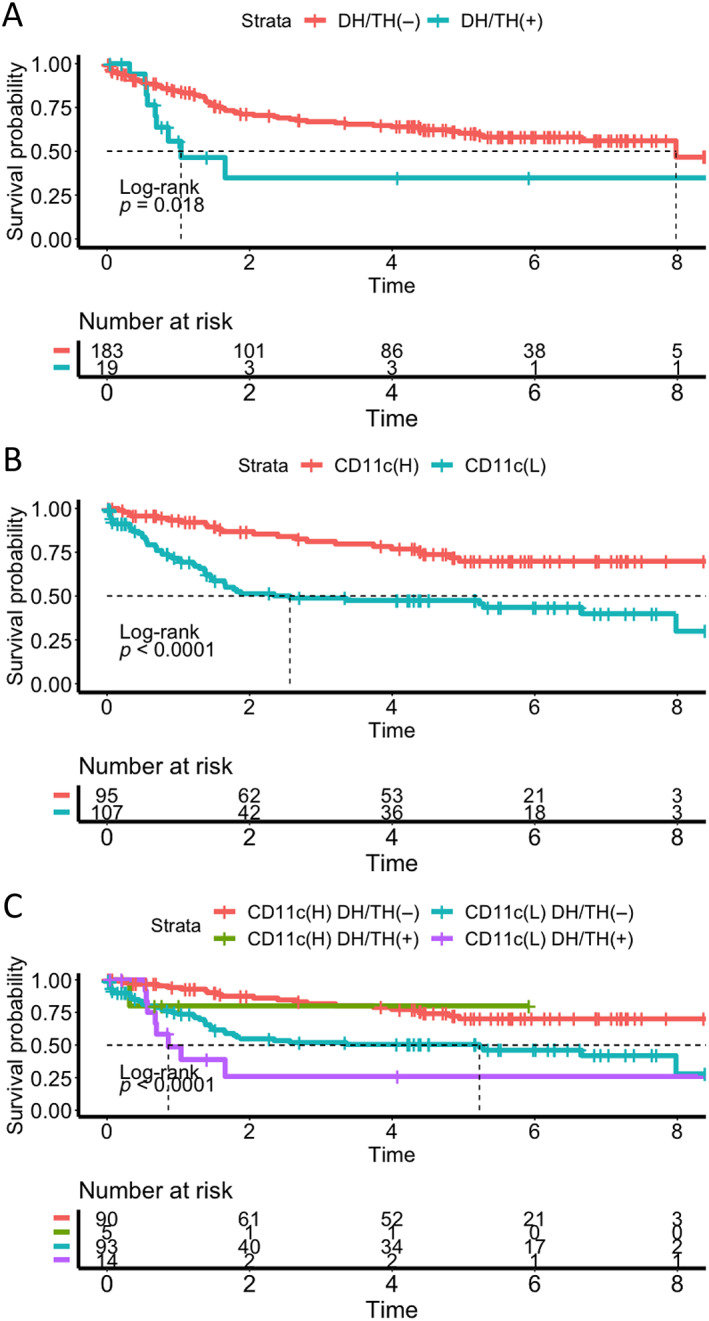
Survival analysis of DLBCL. (A) Kaplan–Meier plot showing significantly worse overall survival in the DH/TH(+) group. (B) Kaplan–Meier plot showing significantly worse overall survival in the CD11c(L) group. Long‐term survival was reached in 70% of patients in the CD11c(H) group. (C) When DLBCL was stratified by CD11c and DH/TH genotypes, the survival was worst in the CD11c(L) groups with DH/TH genotypes. CD11c(H), high CD11c group; CD11c(L), low CD11c group; DH/TH(−), no DH/TH genotype; DH/TH(+), with DH/TH genotype.
Table 4.
Multivariate Cox regression of overall survival in DLBCL
| Hazard ratio (95% CI) | P value | |
|---|---|---|
| IPI risk group † | 3.24 (1.87–5.60) | 0.00003*** |
| Transplantation status ‡ | 1.80 (0.84–3.85) | 0.13 |
| Induction regimen § | ||
| Palliative versus standard | 6.15 | 0.0016** |
| Aggressive versus standard | 0.98 | 0.96 |
| EBV | 1.15 (0.32–4.20) | 0.83 |
| COO of GCB | 0.80 (0.45–1.41) | 0.44 |
| MYC | 1.08 (0.61–1.90) | 0.80 |
| BCL2 | 0.88 (0.48–1.62) | 0.68 |
| Ki67 less than 70% | 1.32 (0.75–2.33) | 0.33 |
| Apoptotic index less than 2% | 0.56 (0.30–1.04) | 0.068 |
| T‐cell percentage less than 25% | 2.65 (1.04–6.74) | 0.041* |
| CD11c ratio less than 0.28 | 1.91 (1.08–3.40) | 0.027* |
| DH/TH genotype | 1.53 (0.65–3.63) | 0.33 |
Significance level: *p < 0.05; **p < 0.01; ***p < 0.001.
IPI risk group was treated as an ordinal variable. The hazard ratio shown was the linear term.
Transplantation status was treated as a time‐dependent variable.
Induction regimen was treated as a categorical variable, stratified into ‘palliative’, ‘standard’, and ‘aggressive.’ The ‘palliative’ category included patients who received palliative treatment only or no treatment at all. The ‘standard’ category included R‐CHOP (rituximab plus cyclophosphamide, doxorubicin, vincristine, and prednisone), RB (rituximab and bendamustine), and other similar regimens. The ‘aggressive’ category included DA‐EPOCH‐R (dose‐adjusted etoposide, prednisone, vincristine, cyclophosphamide, and doxorubicin plus rituximab), R‐hyperCVAD (rituximab plus hyperfractionated cyclophosphamide, vincristine, doxorubicin, and dexamethasone), R‐CODOX‐M/R‐IVAC (rituximab plus cyclophosphamide, vincristine, doxorubicin, and high‐dose methotrexate alternating with rituximab plus ifosfamide, etoposide, and high‐dose cytarabine), and R‐ESHAP (rituximab plus etoposide, methylprednisolone, cytarabine, and cisplatin).
Discussion
In this study, we have demonstrated that the presence of DLBCL with GCB subtypes, a Ki67 proliferative index above 70%, and the presence of BCL2 expression can be used to screen for HGBL‐DH/TH; this serves as an inexpensive and convenient method for doing so. Furthermore, a lower number of CD11c(+) dendritic cells indicated further risk of HGBL‐DH/TH. Notably, the number of CD11c(+) dendritic cells was more closely associated with prognosis than the genotype of DH/TH irrespective of the IPI risk group. Our findings provide a potentially meaningful platform for the identification of HGBL‐DH/TH.
Traditionally, DLBCL with GCB and DEL has been regarded as a screening tool for HGBL‐DH/TH in a FISH‐limiting setting [10]. However, two facts are not accounted for in this approach. First, the reported prevalence of the disease is wide ranging (1–11%) [10, 26, 27], which is probably caused by selection bias in retrospective studies or clinical trials. The second is the variation in the subjective threshold probability (the risk cutoff above which doing the FISH test would be considered) after shared decision‐making by clinicians and patients. In the present study, we used DCA, which was demonstrated to be a better statistical method for evaluating a screening model than ROC curve analysis. DCA has been widely used for analyzing an optimal clinical decision in recent years [22, 28, 29, 30]. Our results demonstrate that our proposed model has a better net benefit than the traditional model across a wide range of threshold probabilities. Although the positive predictive value derived from the proposed model is lower than that of the traditional model at certain threshold probabilities, such as 0.15 (Table 3), the negative predictive value, which reflects the missing of HGBL‐DH/TH, is superior and appears to be more clinically relevant. To the best of our knowledge, this is the first study introducing DCA to an HGBL‐DH/TH screening program.
Our proposed model was designed following a proof of concept in the lymphomagenesis of HGBL‐DH/TH. MYC is a proto‐oncogene not only providing highly proliferative phenotypes, but also producing a more pro‐apoptotic effect [31]. The latter is offset by the anti‐apoptotic effect of overexpressed BCL2 or, potentially, BCL6 [32, 33]. Our study demonstrates that, when an IHC method is used, the Ki67 proliferative index and BCL2 IHC are more powerful for the prediction of HGBL‐DH/TH than MYC IHC and the apoptotic index. A recent study demonstrated a discordance between MYC expression by IHC and MYC rearrangement [34], supporting the limitation of MYC IHC in a HGBL‐DH/TH screening model. Ki67 has been demonstrated to be an unreliable marker for screening HGBL‐DH/TH, with a cutoff of 90% [5]. However, the cutoff was determined for predicting survival rather than DH/TH genotypes [5]. In our study, random forest selection and decision tree analysis provided evidence of the utility of Ki67 with lower cutoff at 70% as a screening model.
Notably, the patients with HGBL‐DH/TH not captured by our new model were primarily MYC/BCL6‐DH (three MYC/BCL6‐DH and one MYC/BCL2‐DH; supplementary material, Table S6). The reasons for this are unclear, but MYC/BCL6‐DH may differ from TH and MYC/BCL2‐DH [1]. For example, the former has more heterogenous morphology and an activated B‐cell signature [1]. The prognostic significance of MYC/BCL6‐DH is also doubtful [35]. In addition, lymphoma with a ‘pseudo‐DH’ of BCL6 fused directly on MYC (rather than an individual rearrangement with immunoglobulin‐related genes or other genes) has no prognostic significance and is indistinguishable from true HGBL‐DH/TH using a conventional interphase FISH test [36]. Our findings support the uniqueness of MYC/BCL6‐DH.
In tissue, CD11c(+) cells are mostly classical dendritic cells, one of the most common types of dendritic cell [37]. Dendritic cells are crucial for native T‐cell differentiation, which is the main factor in antitumor immunity, especially in antigen presentation [37]. Our study demonstrates that a low number of CD11c(+) dendritic cells in the TME predicts survival better than the DH/TH genotype. Several lines of evidence suggest an important prognostic significance of CD11c(+) dendritic cells for lymphoma. First, higher levels of CD11c in serum correlate with lower Lugano stages and better overall survival [38]. Second, small cohorts have demonstrated the survival benefit of high CD11c expression in tumor tissue [39, 40]. Third, the abundance of dendritic cells is also an important prognostic factor in non‐DH/TH high‐IPI risk DLBCL [13]. Notably, gene expression profiling has demonstrated that TME‐related genes, including those related to dendritic cells, are markedly downregulated in HGBL [11, 12]. Of these, CD11c is one of the most differentially expressed genes in molecular HGBL and the other GCB DLBCLs (supplementary material, Figure S7) [11]. This evidence supports our finding that simple CD11c IHC on pathology slides has prognostic value for DLBCL and aids the identification of HGBL‐DH/TH.
This study has several limitations. First, selection bias may be present because this is a retrospective study in which only 30% of the consecutive cases were eligible for multiple reasons (supplementary material, Figure S1), especially exclusion of half of the eligible cases due to specimen inadequacy. However, there were still 6.4% (13/202) of core biopsy specimens and 5.4% (11/202) of endoscopic biopsy specimens included for model training. Second, the number of HGBL‐DH/TH cases remains low, making our statistics less reliable. Third, we only explored the T cells and dendritic cells in the DLBCL TME. A broader overview of TME components may provide a more powerful predictive platform for HGBL‐DH/TH. Fourth, we did not validate our results with an independent cohort. Finally, the biological value of dendritic cells in DLBCL TMEs should be explored further.
In summary, we have provided a simple and powerful algorithm for predicting DH/TH genotypes in DLBCL using the predictors of the presence of GCB COO, a Ki67 proliferative index above 70%, and BCL2 expression. A decreased number of CD11c(+) dendritic cells poses additional risk for DH/TH genotypes and is an independent unfavorable prognostic factor.
Author contributions statement
C‐TY and W‐CC conceived and designed the study. C‐TY, S‐SC, P‐YC, KC, HW, J‐HT and J‐YL performed the experiments. C‐TY, S‐SC and W‐CC analyzed the data. C‐TY wrote the paper. S‐SC and W‐CC revised the paper.
Supporting information
Supplementary materials and methods
Figure S1. Inclusion and exclusion flow chart for the consecutive retrospective cohort (cohort 1) in NTUH
Figure S2. Correlation plot for internal validity for the continuous variable estimated by pathologists' visual inspection
Figure S3. Box plot of the amount of T cells and dendritic cells among tumor tissue from different organs
Figure S4. ROC curve for the continuous variable
Figure S5. Representative images for cases with CD11c ratio near the cutoff of 0.28
Figure S6. Variable importance plot of the random forest model
Figure S7. Volcano plot of gene expression profile in molecular high‐grade B‐cell lymphoma (MHG) versus germinal center subtypes of DLBCL (GCB)
Table S1. The origins and composition of the cohorts
Table S2. Antibody list for in vitro diagnostic immunohistochemical study
Table S3. Slide evaluation
Table S4. Baseline demographic data of the cohorts
Table S5. Cost–benefit analysis, provided a risk above 5% warrants FISH testing, of the real‐world consecutive cohort 1
Table S6. Genotypes of HGBL‐DH/TH missed by the predictive model in the overall cohort (cohort 1 and cohort 2), provided a risk above 15% warrants FISH testing
Acknowledgements
We are grateful for the technical support provided by the Core Labs, Department of Medical Research, National Taiwan University Hospital. We also appreciate the assistance in experimental design and analysis provided by Ms Fang‐Yu Tsao and Dr Yu‐Wen Cheng.
This work was supported by the National Taiwan University Hospital (grant numbers: 110‐N4982 and 110‐O11), National Taiwan University Cancer Center (grant number: NTUCCS‐111‐11), and the Ministry of Science and Technology (grant numbers: MOST 108‐2314‐B‐002‐218‐MY2, MOST 109‐2314‐B‐002‐221, and MOST 110‐2314‐B‐002‐021).
No conflicts of interest were declared.
References
- 1. Swerdlow SH, Campo E, Harris NL, et al. WHO Classification of Tumours of Haematopoietic and Lymphoid Tissues. IARC: Lyon, 2017. [Google Scholar]
- 2. Sehn LH, Donaldson J, Chhanabhai M, et al. Introduction of combined CHOP plus rituximab therapy dramatically improved outcome of diffuse large B‐cell lymphoma in British Columbia. J Clin Oncol 2005; 23: 5027–5033. [DOI] [PubMed] [Google Scholar]
- 3. Scott DW, King RL, Staiger AM, et al. High‐grade B‐cell lymphoma with MYC and BCL2 and/or BCL6 rearrangements with diffuse large B‐cell lymphoma morphology. Blood 2018; 131: 2060–2064. [DOI] [PMC free article] [PubMed] [Google Scholar]
- 4. Stephens DM, Smith SM. Diffuse large B‐cell lymphoma—who should we FISH? Ann Lymphoma 2018; 2: 8. [Google Scholar]
- 5. Johnson NA, Slack GW, Savage KJ, et al. Concurrent expression of MYC and BCL2 in diffuse large B‐cell lymphoma treated with rituximab plus cyclophosphamide, doxorubicin, vincristine, and prednisone. J Clin Oncol 2012; 30: 3452–3459. [DOI] [PMC free article] [PubMed] [Google Scholar]
- 6. Oki Y, Noorani M, Lin P, et al. Double hit lymphoma: the MD Anderson Cancer Center clinical experience. Br J Haematol 2014; 166: 891–901. [DOI] [PubMed] [Google Scholar]
- 7. National Comprehensive Cancer Network . B‐Cell Lymphomas (Version 4.2021). 2021. [Accessed 12 September 2021]. Available from: https://www.nccn.org/professionals/physician_gls/pdf/b-cell.pdf
- 8. Landsburg DJ, Falkiewicz MK, Maly J, et al. Outcomes of patients with double‐hit lymphoma who achieve first complete remission. J Clin Oncol 2017; 35: 2260–2267. [DOI] [PMC free article] [PubMed] [Google Scholar]
- 9. Laude MC, Lebras L, Sesques P, et al. First‐line treatment of double‐hit and triple‐hit lymphomas: survival and tolerance data from a retrospective multicenter French study. Am J Hematol 2021; 96: 302–311. [DOI] [PubMed] [Google Scholar]
- 10. Sesques P, Johnson NA. Approach to the diagnosis and treatment of high‐grade B‐cell lymphomas with MYC and BCL2 and/or BCL6 rearrangements. Blood 2017; 129: 280–288. [DOI] [PubMed] [Google Scholar]
- 11. Sha C, Barrans S, Cucco F, et al. Molecular high‐grade B‐cell lymphoma: defining a poor‐risk group that requires different approaches to therapy. J Clin Oncol 2019; 37: 202–212. [DOI] [PMC free article] [PubMed] [Google Scholar]
- 12. Ennishi D, Jiang A, Boyle M, et al. Double‐hit gene expression signature defines a distinct subgroup of germinal center B‐cell‐like diffuse large B‐cell lymphoma. J Clin Oncol 2019; 37: 190–201. [DOI] [PMC free article] [PubMed] [Google Scholar]
- 13. Ciavarella S, Vegliante MC, Fabbri M, et al. Dissection of DLBCL microenvironment provides a gene expression‐based predictor of survival applicable to formalin‐fixed paraffin‐embedded tissue. Ann Oncol 2018; 29: 2363–2370. [DOI] [PMC free article] [PubMed] [Google Scholar]
- 14. Chuang WY, Chang ST, Yuan CT, et al. Identification of CD5/cyclin D1 double‐negative pleomorphic mantle cell lymphoma: a clinicopathologic, genetic, and gene expression study. Am J Surg Pathol 2020; 44: 232–240. [DOI] [PubMed] [Google Scholar]
- 15. Bankhead P, Loughrey MB, Fernández JA, et al. QuPath: open source software for digital pathology image analysis. Sci Rep 2017; 7: 16878. [DOI] [PMC free article] [PubMed] [Google Scholar]
- 16. Wculek SK, Cueto FJ, Mujal AM, et al. Dendritic cells in cancer immunology and immunotherapy. Nat Rev Immunol 2020; 20: 7–24. [DOI] [PubMed] [Google Scholar]
- 17. Valera A, Epistolio S, Colomo L, et al. Definition of MYC genetic heteroclonality in diffuse large B‐cell lymphoma with 8q24 rearrangement and its impact on protein expression. Mod Pathol 2016; 29: 844–853. [DOI] [PubMed] [Google Scholar]
- 18. Van Buuren S, Groothuis‐Oudshoorn K. mice: multivariate imputation by chained equations in R. J Stat Soft 2011; 45: 1–67. [Google Scholar]
- 19. Khan MRA, Brandenburger T. ROCit: Performance Assessment of Binary Classifier with Visualization. R Package Version 2.1.1. 2020. [Accessed 22 May 2022]. Available from: https://CRAN.R-project.org/package=ROCit
- 20. Liaw A, Wiener M. Classification and regression by randomForest. R News 2002; 2: 18–22. [Google Scholar]
- 21. Therneau T, Atkinson B. rpart: Recursive Partitioning and Regression Trees. R Package Version 4.1.16. 2022. Accessed 22 May 2022]. Available from: https://CRAN.R-project.org/package=rpart
- 22. Vickers AJ, Elkin EB. Decision curve analysis: a novel method for evaluating prediction models. Med Decis Making 2006; 26: 565–574. [DOI] [PMC free article] [PubMed] [Google Scholar]
- 23. Memorial Sloan Kettering Cancer Center . Biostatistics: Decision Curve Analysis. [Accessed 21 September 2021]. Available from: https://www.mskcc.org/departments/epidemiology‐biostatistics/biostatistics/decision‐curve‐analysis
- 24. Therneau T. A Package for Survival Analysis in R. R Package Version 3.3‐1. 2022. [Accessed 22 May 2022]. Available from: https://CRAN.R-project.org/package=survival
- 25. Kassambara A, Kosinski M, Biecek P. survminer: Drawing Survival Curves Using 'ggplot2'. R Package Version 0.4.9. 2021. [Accessed 22 May 2022]. Available from: https://CRAN.R-project.org/package=survminer
- 26. Pedersen MØ, Gang AO, Poulsen TS, et al. Double‐hit BCL2/MYC translocations in a consecutive cohort of patients with large B‐cell lymphoma – a single centre's experience. Eur J Haematol 2012; 89: 63–71. [DOI] [PubMed] [Google Scholar]
- 27. Chang ST, Chen SW, Ho CH, et al. Immunophenotypic and genetic characteristics of diffuse large B‐cell lymphoma in Taiwan. J Formos Med Assoc 2016; 115: 961–967. [DOI] [PubMed] [Google Scholar]
- 28. Fitzgerald M, Saville BR, Lewis RJ. Decision curve analysis. JAMA 2015; 313: 409–410. [DOI] [PubMed] [Google Scholar]
- 29. Vickers AJ, Van Calster B, Steyerberg EW. Net benefit approaches to the evaluation of prediction models, molecular markers, and diagnostic tests. BMJ 2016; 352: i6. [DOI] [PMC free article] [PubMed] [Google Scholar]
- 30. Vickers AJ, van Calster B, Steyerberg EW. A simple, step‐by‐step guide to interpreting decision curve analysis. Diagn Progn Res 2019; 3: 18. [DOI] [PMC free article] [PubMed] [Google Scholar]
- 31. Harrington CT, Sotillo E, Dang CV, et al. Tilting MYC toward cancer cell death. Trends Cancer 2021; 7: 982–994. [DOI] [PMC free article] [PubMed] [Google Scholar]
- 32. Phan RT, Dalla‐Favera R. The BCL6 proto‐oncogene suppresses p53 expression in germinal‐centre B cells. Nature 2004; 432: 635–639. [DOI] [PubMed] [Google Scholar]
- 33. Hemann MT, Bric A, Teruya‐Feldstein J, et al. Evasion of the p53 tumour surveillance network by tumour‐derived MYC mutants. Nature 2005; 436: 807–811. [DOI] [PMC free article] [PubMed] [Google Scholar]
- 34. Collinge B, Ben‐Neriah S, Chong L, et al. The impact of MYC and BCL2 structural variants in tumors of DLBCL morphology and mechanisms of false‐negative MYC IHC. Blood 2021; 137: 2196–2208. [DOI] [PubMed] [Google Scholar]
- 35. Clipson A, Barrans S, Zeng N, et al. The prognosis of MYC translocation positive diffuse large B‐cell lymphoma depends on the second hit. J Pathol Clin Res 2015; 1: 125–133. [DOI] [PMC free article] [PubMed] [Google Scholar]
- 36. Johnson SM, Umakanthan JM, Yuan J, et al. Lymphomas with pseudo‐double‐hit BCL6‐MYC translocations due to t(3;8)(q27;q24) are associated with a germinal center immunophenotype, extranodal involvement, and frequent BCL2 translocations. Hum Pathol 2018; 80: 192–200. [DOI] [PubMed] [Google Scholar]
- 37. Patente TA, Pinho MP, Oliveira AA, et al. Human dendritic cells: their heterogeneity and clinical application potential in cancer immunotherapy. Front Immunol 2018; 9: 3176. [DOI] [PMC free article] [PubMed] [Google Scholar]
- 38. Elhelbawy NG, Nassar AAH, Eltorgoman AEA, et al. Immunological microenvironment gene expression in patients with diffuse large B cell non Hodgkin lymphoma. Biochem Biophys Rep 2020; 21: 100731. [DOI] [PMC free article] [PubMed] [Google Scholar]
- 39. Lee S, Kim DH, Oh SY, et al. Clinicopathologic significance of tumor microenvironment CD11c, and FOXP3 expression in diffuse large B‐cell lymphoma patients receiving rituximab, cyclophosphamide, anthracycline, vincristine, and prednisone (R‐CHOP) combination chemotherapy. Korean J Intern Med 2017; 32: 335–344. [DOI] [PMC free article] [PubMed] [Google Scholar]
- 40. Li YB, Wang Z, Zuo HB, et al. Correlation between FOXP3, CD11c protein expression and prognosis of patients with diffuse large B‐cell lymphoma. Zhongguo Shi Yan Xue Ye Xue Za Zhi 2021; 29: 104–108. [DOI] [PubMed] [Google Scholar]
Associated Data
This section collects any data citations, data availability statements, or supplementary materials included in this article.
Supplementary Materials
Supplementary materials and methods
Figure S1. Inclusion and exclusion flow chart for the consecutive retrospective cohort (cohort 1) in NTUH
Figure S2. Correlation plot for internal validity for the continuous variable estimated by pathologists' visual inspection
Figure S3. Box plot of the amount of T cells and dendritic cells among tumor tissue from different organs
Figure S4. ROC curve for the continuous variable
Figure S5. Representative images for cases with CD11c ratio near the cutoff of 0.28
Figure S6. Variable importance plot of the random forest model
Figure S7. Volcano plot of gene expression profile in molecular high‐grade B‐cell lymphoma (MHG) versus germinal center subtypes of DLBCL (GCB)
Table S1. The origins and composition of the cohorts
Table S2. Antibody list for in vitro diagnostic immunohistochemical study
Table S3. Slide evaluation
Table S4. Baseline demographic data of the cohorts
Table S5. Cost–benefit analysis, provided a risk above 5% warrants FISH testing, of the real‐world consecutive cohort 1
Table S6. Genotypes of HGBL‐DH/TH missed by the predictive model in the overall cohort (cohort 1 and cohort 2), provided a risk above 15% warrants FISH testing