Abstract
Objectives:
Viral suppression (VS) is the hallmark of successful antiretroviral therapy (ART) programmes. We sought to compare clinic retention, virological outcomes, drug resistance and mortality between peri-urban and rural settings in South Africa after first-line ART.
Methods:
Beginning in July 2014, 1000 (500 peri-urban and 500 rural) ART-naïve patients with HIV were enrolled and managed according to local standard of care. Clinic retention, virological suppression, virological failure (VF), genotypic drug resistance and mortality were assessed. The definition of VS was a viral load ≤1000 copies/ml. Time to event analyses were stratified by site, median age and gender. Kaplan–Meier curves were calculated and graphed with log-rank modelling to compare curves.
Results:
Based on 2741 patient-years of follow-up, retention and mortality did not differ between sites. Among all 1000 participants, 47%, 84% and 91% had achieved VS by 6, 12 and 24 months, respectively, which was observed earlier in the peri-urban site. At both sites, men aged < 32 years had the highest proportion of VF (15.5%), while women aged > 32 years had the lowest, at 7.1% (p = 0.018). Among 55 genotypes, 42 (76.4%) had at one or more resistance mutations, which did not differ by site. K103N (59%) and M184V (52%) were the most common mutations, followed by V106M and K65R (31% each). Overall, death was infrequent (< 4%).
Conclusions:
No significant differences in treatment outcomes between peri-urban and rural clinics were observed. In both settings, young men were especially susceptible to clinic attrition and VF. More effective adherence support for this important demographic group is needed to achieve UNAIDS targets.
Keywords: clinic retention, disposition, drug resistance, virological failure, virological suppression
INTRODUCTION
The Joint United Nations Programme on HIV/AIDS (UNAIDS) ‘90–90–90 Goals’, established in 2014, were ambitious universal benchmarks intended to drive progress toward the elimination of the HIV/AIDS epidemic [1]. The third goal requires that 90% of all people receiving antiretroviral therapy (ART) be virally suppressed (VS) by 2020. South Africa, which has the largest ART programme in the world, adopted these goals and further, in 2016, announced a significant policy shift to offer free treatment to all South Africans with HIV irrespective of CD4 count [2].
Viral suppression is the hallmark of a successful ART programme and is associated with immune recovery, a reduction in opportunistic infections and drug resistance mutations, improved survival and lower HIV transmission rates [3,4]. The percentage of patients with VS is the World Health Organization’s (WHO) early warning indicator for HIV drug resistance; however, between 2004 and 2009 only 2% of clinics across 50 countries monitored this indicator [5]. Another key indicator, retention in care, is vitally important but has not been closely monitored. Retaining patients in care is critical to the success of the HIV programme. Although approximately 54% of the KwaZulu-Natal (KZN) population live in rural areas, few studies reported VS or retention from individuals residing in these areas [6].
As ART programmes continue to expand, it has become increasingly important to identify treatment gaps at clinical sites in remote areas. In light of this, we sought to compare clinic retention, virological response, drug resistance and mortality from three clinics in the uMkhanyakude district, a deeply rural area in KZN, with values from a peri-urban clinic in Durban, South Africa.
MATERIALS AND METHODS
Study setting and participants
Ethics approval from the Biomedical Research Ethics Committee of the University of KwaZulu-Natal, the Emory University and MassGeneral Brigham institutional review boards was obtained prior to the start of the study. After signed informed consent, people living with HIV (PLWH) who were at least 18 years of age and qualified for ART, were enrolled into the KZN HIV AIDS Drug Resistance Surveillance Study (ADReSS). All participants were required to be ART naive (based on self report) prior to enrolment and treatment initiation begining July 2014. Each site enrolled 500 consecutive participants who were followed up for at least 1 year after enrolment and managed according to the prevailing standard of care. All participants were initiated on first-line ART, with > 99% receiving a fixed-dose combination tablet of efavirenz/emtricitabine/tenofovir. Viral load (VL) monitoring was performed 6 and 12 months after ART initiation, followed by annual testing if suppressed. Participants with two consecutive measurements of VL > 1000 copies/ml at least 2 months apart after intensive adherence counselling were changed to second-line ART.
The peri-urban site (RKK) is a regional department of health facility in Durban, a large metropolitan city in KZN, South Africa. In the rural site (BTD) participants were recruited from the ART clinic-cluster comprising Bethesda ART clinic, Jozini clinic and Mkuze clinic managed by Bethesda Hospital, located in the northernmost and poorest district of KZN, bordering Eswatini to the northeast and Mozambique to the east. Care at RKK was closely supervised by doctors, whereas care at BTD was primarily nurse-driven. Further details about these sites were described previously [7].
Data collection and study end-points
Baseline socio-demographics (gender, age, race, ethnicity, language, education and sensory impairments), ART regimen and longitudinal laboratory measures were collected for all participants. Based on the 2020 South African National Consolidated guidelines, VL ≤ 1000 copies/ml was considered to be VS. In the ADReSS study, virological failure (VF) was defined as the first VL > 1000 copies/ml after ART initiation. Participants with VF had genotypic resistance testing performed at the next clinic visit. Time to loss of virological response (TLOVR) was defined as VF following documented VS. Clinic attendance and disposition were determined by a search of the clinic electronic patient management system (TIER.net) and a review of participant clinic files for visit dates, transfer notes and death reports. Additionally, the study team searched the National Health Laboratory System (NHLS) online system, Trakcare, for results of laboratory tests done at other facilities and the National Department of Home Affairs database to determine the vital status of participants lost to follow-up (LTFU). Being LTFU was defined as no further contact or VL data at any time after enrolment except for those who died. Participants were defined as ‘in study clinics’ (ISC) if all VLs obtained were from the study clinics. If participants changed service providers (CSP), they were still considered in care but by an outside service provider. Data were recorded, reconciled and archived using Research Electronic Data Capture (REDCap) [8,9], the electronic data capture tool hosted at Emory University.
Statistical analysis
Standard statistical methods were used to summarize and compare variables between peri-urban and rural populations. Continuous variables were summarized with sample means and compared using a two-sample t-test; categorical variables were summarized via sample frequencies and compared using Pearson’s χ2 test of independence. Time-to-event outcomes (including disposition, treatment failure, VS and TLOVR) were explored by Kaplan–Meier (KM) curves stratified by site, median age and gender. The KM curves were compared using K-sample log-rank test statistics. Additionally, multi-state outcomes across the HIV care continuum were graphically represented using Sankey diagrams created by the networkD3 R package.
Statitical analyses were performed using the R programming language (v.4.00) with the RStudio (v.1.3.1) integrated development environment using R packages including ‘tidyverse’, ‘survival’ for survival analysis, and ‘survminer’ for survival analysis plots.
RESULTS
Baseline characteristics
There were no significant differences in the mean age or mean CD4 count between participants enrolled at the two study sites (Table 1). Most of the other baseline characteristics differed significantly between sites. The majority of participants identified as black (100% BTD, 92.6% RKK). RKK had 6.2% Indian and 1.2% coloured (a locally used word for people of mixed-race origin). Among black participants, 97.6% identified themselves as Zulu at BTD compared with 64.7% at RKK. Significantly more participants reported understanding English at RKK (97.4%) than at BTD (75.2%) which was reflected in the level of education. A small proportion of participants reported baseline visual and auditory impairments which differed significantly by site. Nearly all participants received the fixed-dose combination tablet efavirenz/emtricitabine/tenofovir disoproxil fumarate (EFV/FTC/TDF) unless contraindicated, in which case TDF was replaced with zidovudine or abacavir and EFV was replaced with nevirapine.
TABLE 1.
Baseline characteristics and outcomes for participants at each site
| Characteristic | Categories | Peri-urban (RKK) (n = 500) [n (%) or mean (SD)] |
Rural (BTD) (n = 500) [n (%) or mean (SD)] |
p-value |
|---|---|---|---|---|
| Gender | Women | 280 (55.8) | 318 (63.6) | 0.014 |
| Age | Years | 34 (9.9) | 34 (10.2) | 0.734 |
| Education | Years | 9.7 (2.8) | 9.1 (3.6) | 0.002 |
| Education beyond matriculation | Years | 0.36 (0.8) | 0.22 (0.7) | 0.003 |
| Race | Black | 465 (92.6) | 500 (100) | < 0.001 |
| Coloured | 6 (1.2) | |||
| Indian | 31 (6.2) | |||
| Ethnicity | Zulu | 301 (60.2) | 488 (97.6) | < 0.001 |
| Xhosa | 109 (21.8) | 4 (0.8) | ||
| Other | 59 (11.8) | 8 (1.6) | ||
| Missing | 31 (6.2) | 0 (0.0) | ||
| Language | isiZulu | 470 (93.6) | 500 (100) | < 0.001 |
| English | 489 (97.4) | 376 (75.2) | < 0.001 | |
| Other | 239 (47.6) | |||
| Auditory impairment | Yes | 11 (2.2) | 20 (4.0) | 0.141 |
| Visual impairment | Yes | 27 (5.4) | 61 (12.2) | < 0.001 |
| No impairment | Yes | 465 (92.6) | 423 (84.6) | < 0.001 |
| Single dose nevirapine | Yes | 26 (9.3) | 53 (23.9) | 0.005 |
| Antiretroviral therapy | EFV/FTC/TDF | 492 (98.0) | 497 (99.3) | 0.095 |
| Other | 8 (2.0) | 3 (0.7) | ||
| Enrolment CD4 count | Cells/µL | 384 (284) | 355 (287) | 0.33 |
| Timing of viral load | ||||
| 6 monthsa | Log copies/ml (n = 917) | 3.7 (1.3) | 3.3 (1.1) | 0.001 |
| 12 monthsa | Log copies/ml (n = 755) | 3.7 (0.8) | 3.0 (0.9) | 0.004 |
| 18 monthsa | Log copies/ml (n = 431) | 3.7 (1.1) | 3.0 (0.9) | 0.023 |
| 24 monthsa | Log copies/ml (n = 141) | 3.9 (2.1) | 3.0 (0.9) | 0.012 |
| 30 monthsa | Log copies/ml (n = 5) | 5.3 (4.2) | 8.3 (4.2) | 0.73 |
| Percentage suppressed | ||||
| 6 monthsb | 55.8 | 38.2 | - | |
| 12 monthsb | 84.4 | 82.5 | - | |
| 18 monthsb | 90.6 | 88.8 | - | |
| 24 monthsb | 91.6 | 90.0 | - | |
| 30 monthsb | 92.2 | 90.0 | - | |
| Final disposition | In care | 416 (83.0) | 414 (82.8) | 0.89 |
| In study clinics | 344 (68.8) | 314 (62.8) | ||
| Lost to follow-up | 62 (12.4) | 72 (14.4) | ||
| Died | 22 (4.4) | 14 (2.8) | ||
| Resistance | One or more mutations | 23 (4.6) | 19 (3.8) | 0.72 |
| One or more mutations in two drug classes: NRTI, NNRTI or PI | 1 (0.02) | 3 (0.6) | 0.3 |
Abbreviations: BTD, rural site in KwaZulu-Natal; EFV, efavirenz; FTC, emtricitabine; NNRTI, nonnucleoside reverse transcriptase inhibitor; NRTI, nucleoside reverse transcriptase inhibitor; PI, protease inhibitor; RKK, peri-urban site in Durban; TDF, tenofovir disoproxil fumarate.
Median and standard deviation.
Percentage of 500 with intention to treat.
Clinic retention and disposition
Over 2741 patient-years of follow-up, clinic retention and final disposition did not differ between sites (Table 1; Figure 1a,b). Overall, death was infrequent (< 4% cumulative) (Figures 2a, S1a) and did not differ by site (Figure 2b) or by remaining ISC (Figure S1b). The rate of mortality was significantly different among the four groups defined by age (< 32 years vs. > 32 years) and gender, overall (Figure 2c; p = 0.015) and being ISC (Figure S1c; p = 0.018). Overall, 13.4% of participants were LTFU and 17% of participants could not be contacted, which includes being LTFU and deaths (Table 1; Figure 1a,b). By the end of the study, 172 (15.6%) participants were CSP with > 65% remaining ISC (Table 1; Figure 1a,b).
FIGURE 1.
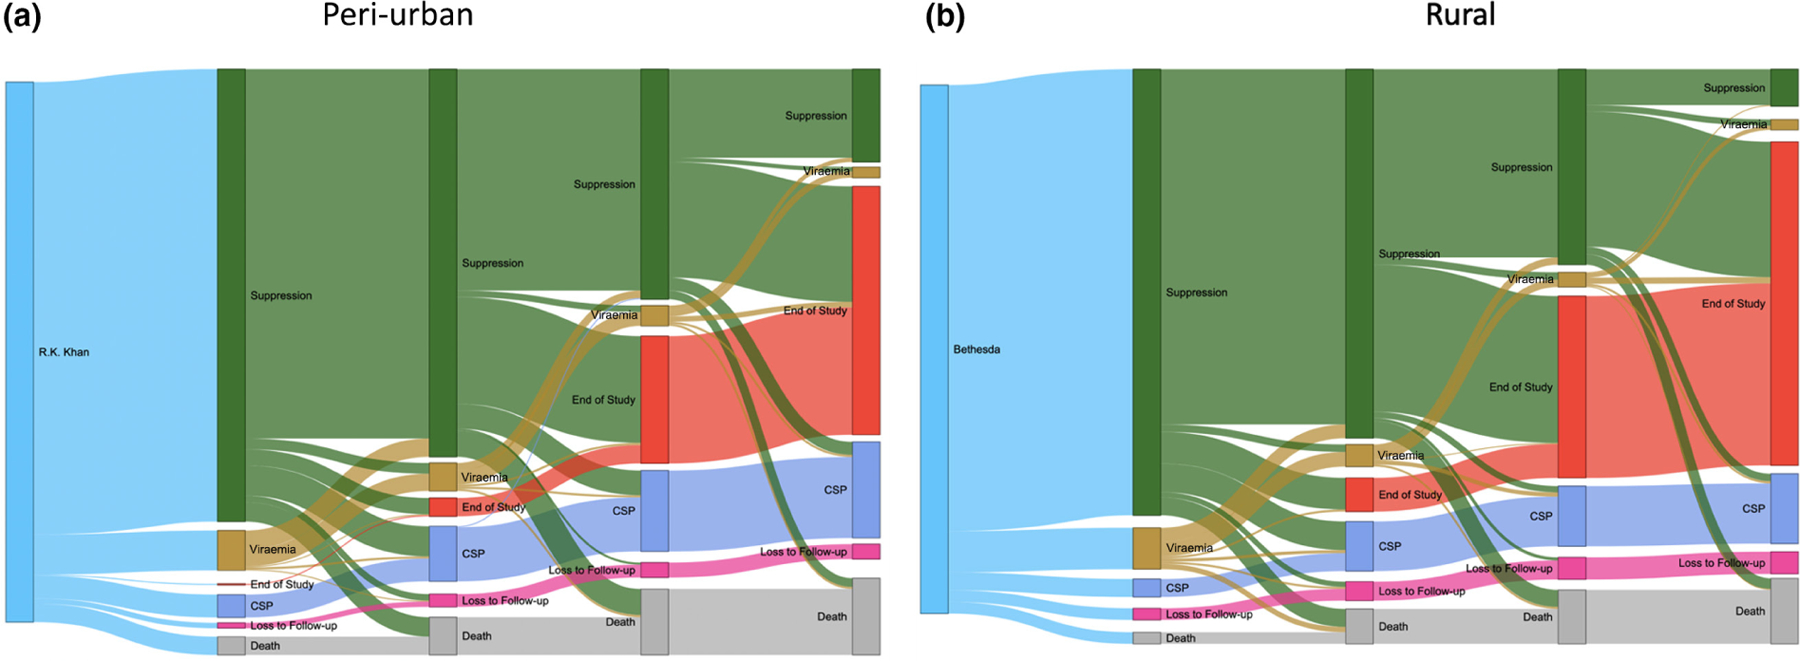
(a, b) Retention and viral load suppression at each viral load monitoring visit at the R.K. Khan Hospital clinic (a) and Bethesda Hospital clinics (b). The disposition of each participant at the time of viral load testing and how their disposition changes between each test are illustrated. The vertical nodes define disposition when viral load testing was due, and the grey ‘flows’ identify the proportion of participants from the previous nodes that flow into subsequent nodes
FIGURE 2.
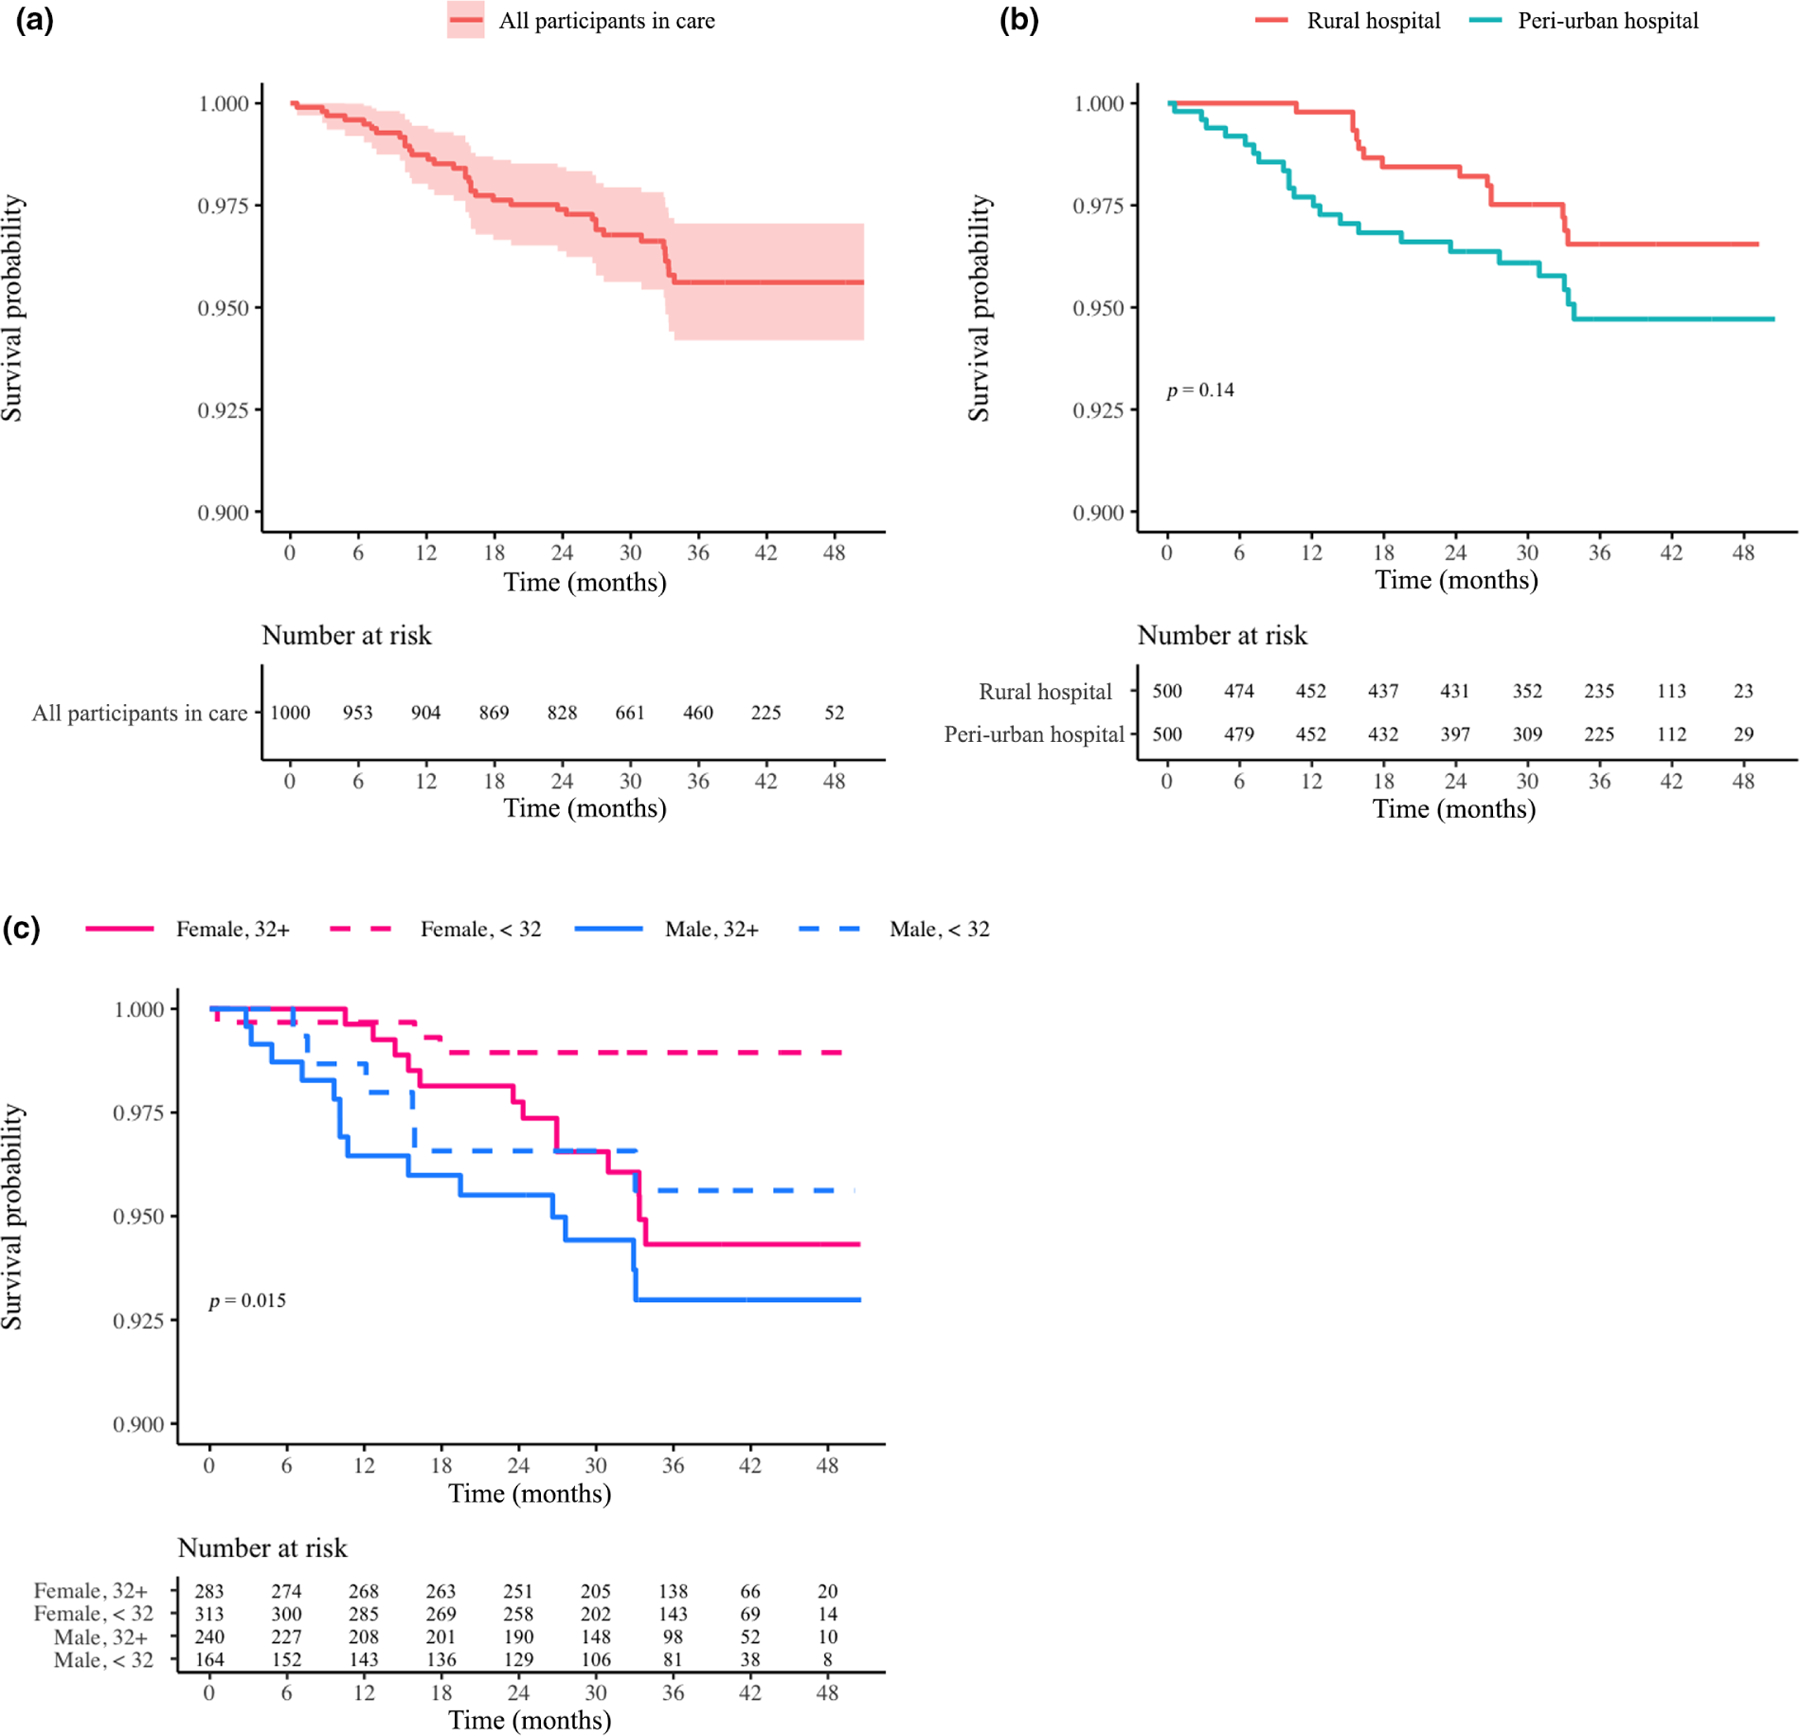
(a–c) Probability of survival for participants in care overall (a), by site (b) and by age/gender (c). Log-rank p-values are provided if significant (< 0.05). The time interval extended from participant enrolment until the end of the study with death date as the event date. Censoring occurred for those who became uncontactable
Virological outcomes
Among all 1000 participants, 47%, 84% and 91% achieved VS by 6, 12 and 24 months, respectively. By the end of the study, 917 participants had at least one VL test result. Among participants who had a VL result, 49%, 89% and 95% had VS by 6, 12 and 24 months, respectively (Figures 3a, S2a). However, time to VS differed significantly between peri-urban and rural sites overall (p = 0.0002; Figure 3b) and for those remaining ISC (p = 0.00012; Figure S2b). Viral suppression occurred earlier at the peri-urban site; however, the rural site rapidly closed the gap; VS also differed by age and gender overall (p = 0.0075; Figure 3c) but not for those who were ISC (Figure S2c).
FIGURE 3.
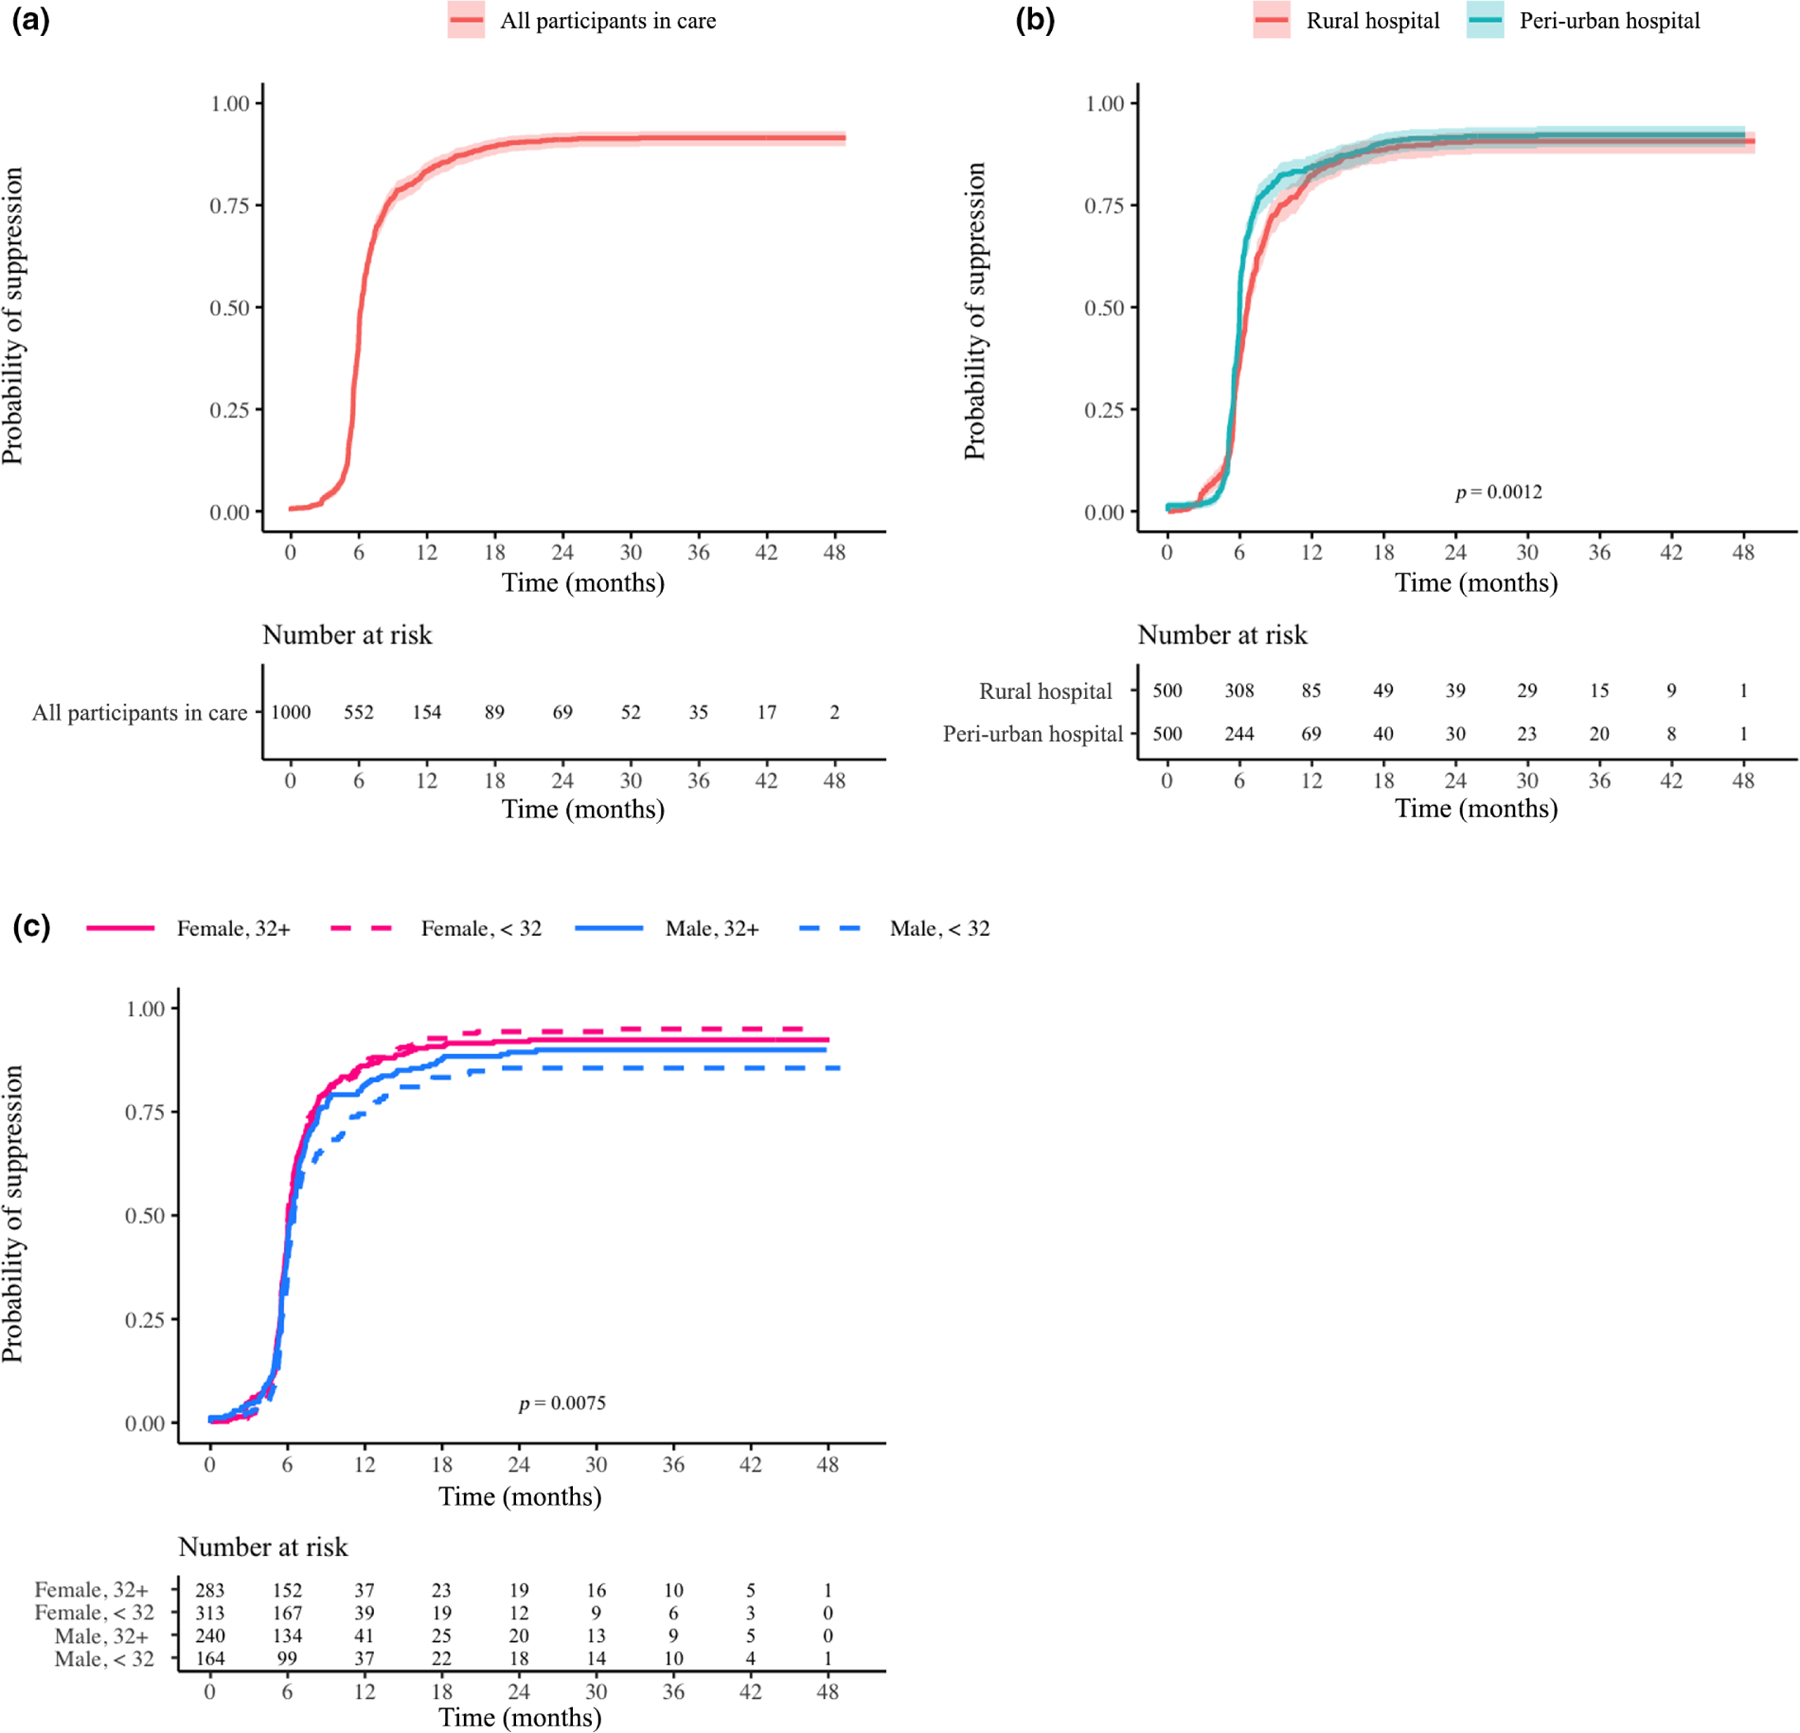
(a–c) Probability of viral load suppression over time for participants in care overall (a), by site (b) and by age/gender (c). Log-rank p-values are provided if significant (< 0.05). The underlying assumption was that at enrolment every participant was in a state of viraemia. Therefore, the time interval extended from participant enrolment until the end of the study with date of first suppression event as the event date. Censoring occurred for participants who were lost to follow-up or died
Among all participants, approximately 12% developed VF in the first 30 months of treatment (Figure 4a). Of these participants, 35% subsequently became suppressed. If participants without a VL were considered failures then 19.9% had VF. Among participants remaining ISC with a VL, 10.6% had VF (Figure S3a). Among all participants the rate of VF did not differ between sites (Figure 4b); however, at both sites, men and women with a mean age of < 32 years had the highest rate of VF, while women > 32 years had the lowest rate (p = 0.019; Figure 4c). Again, for participants remaining in care there was no difference by site (Figure S3b), and women > 32 years old had the lowest proportion of VF (p = 0.044; Figure S3c). Of 872 participants achieving VS, 63 (7.2%) subsequently developed VF (Figure 5a). This proportion did not differ by site (Figure 5b) but was greater for younger men (Figure 5c; p = 0.051). Similar trends in the TLOVR were observed for those remaining ISC, except that there were no significant differences by age and gender (Figure S4a–c).
FIGURE 4.
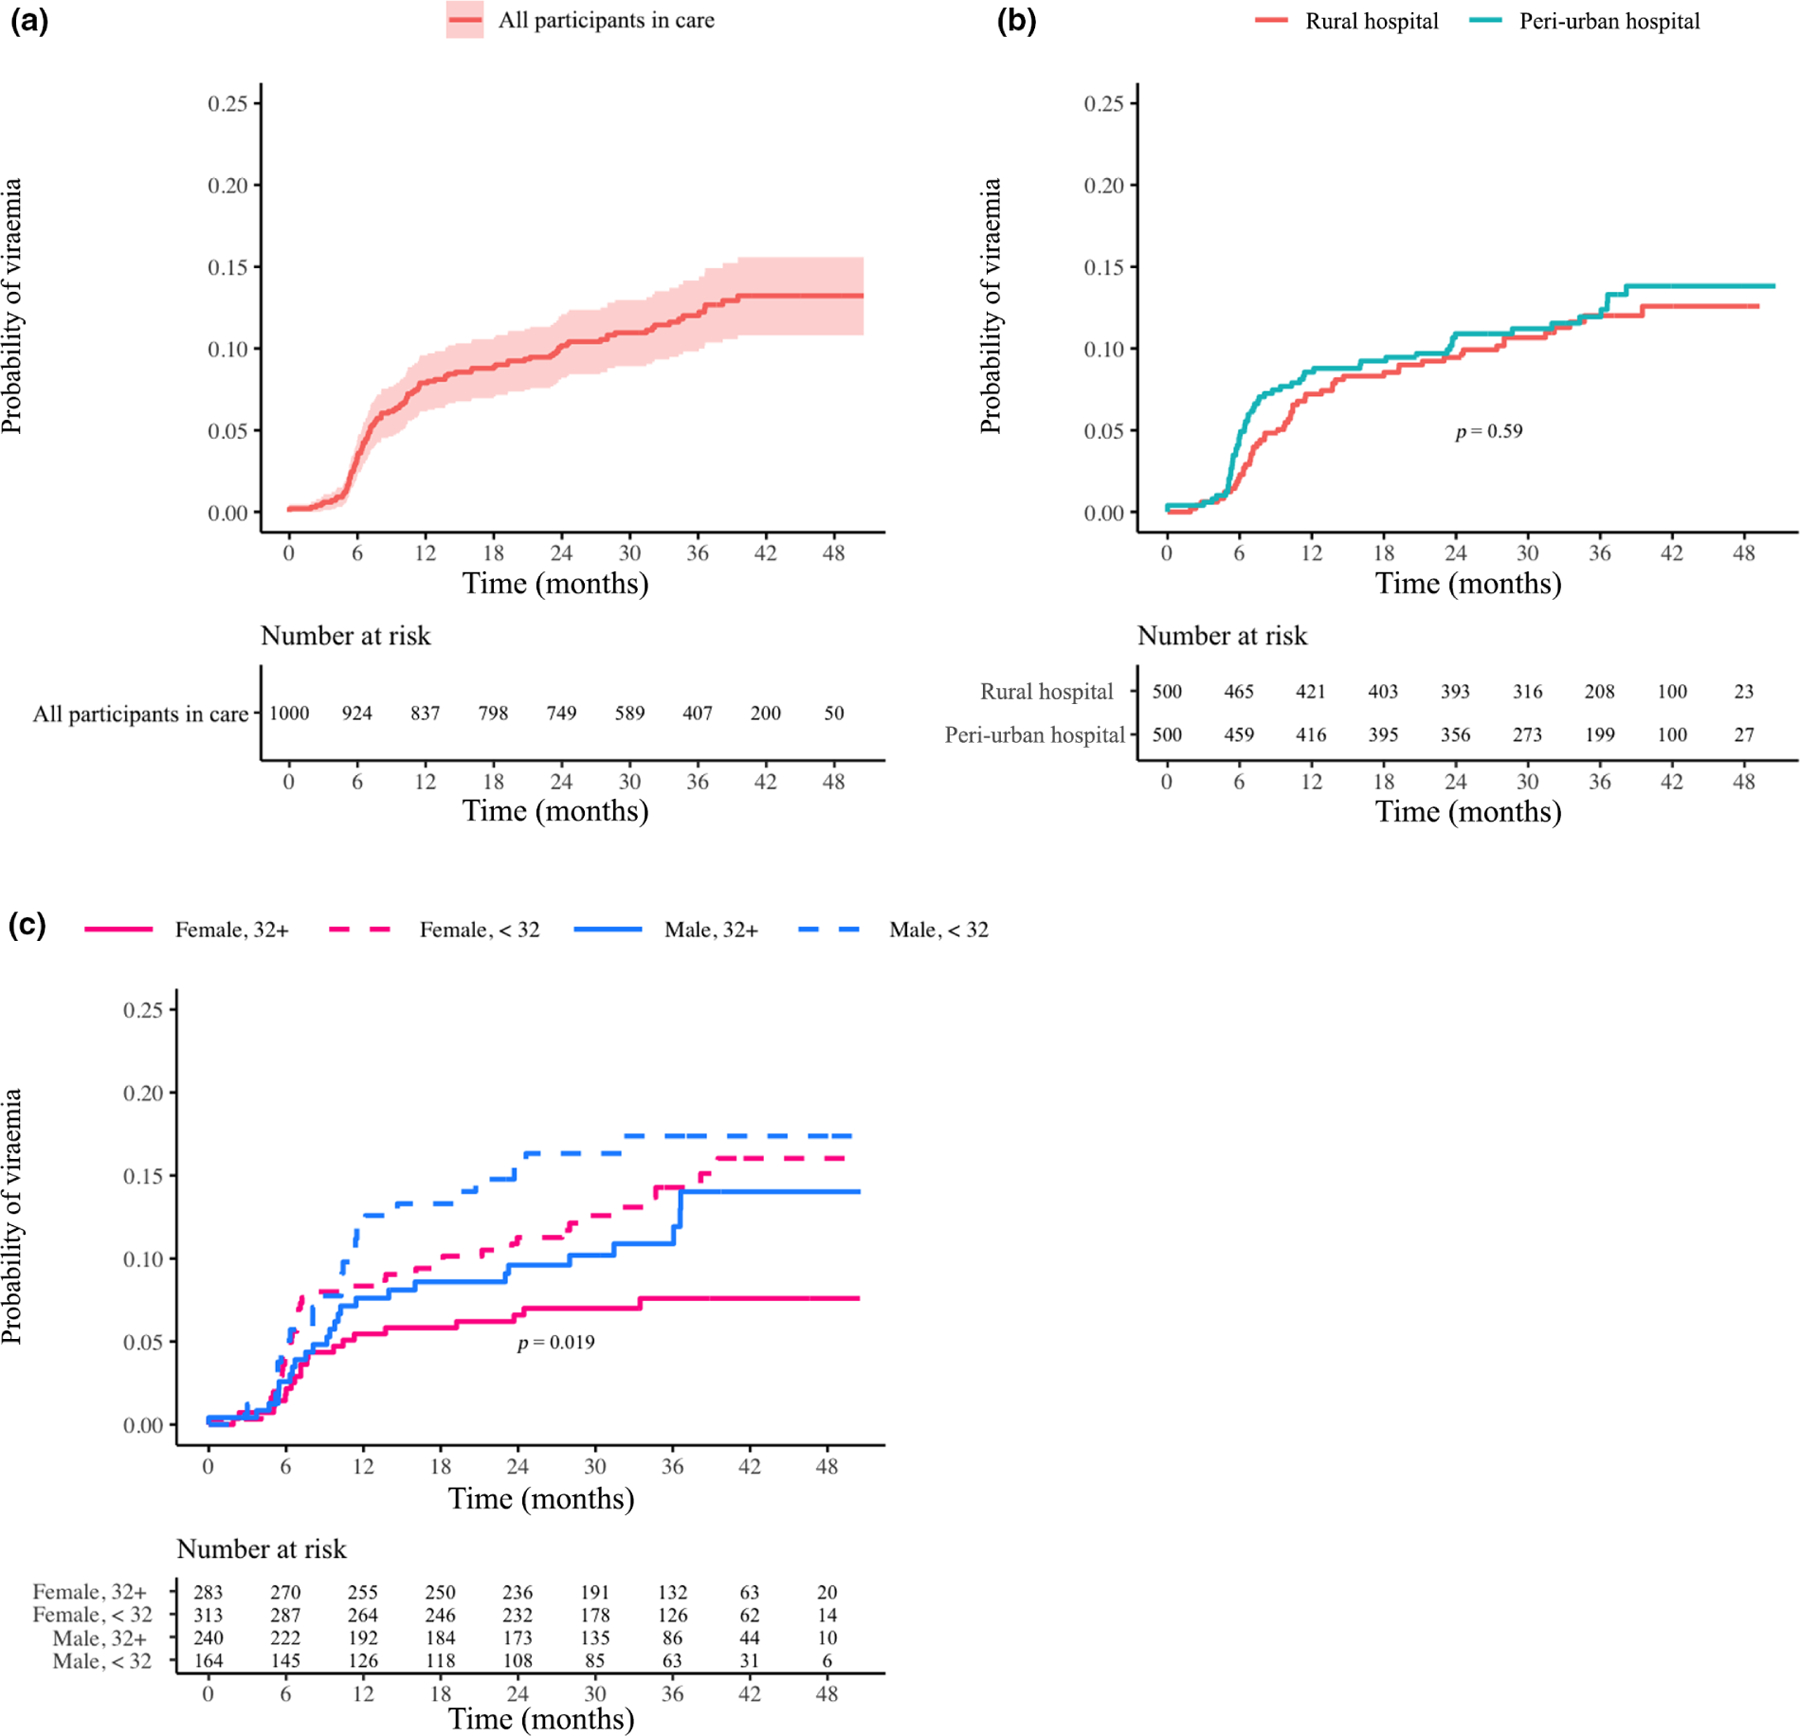
(a–c) Probability of virological failure (viral load > 1000 copies/ml) for participants in care overall (a), by site (b) and by age/gender (c). Log-rank p-values are provided if significant (< 0.05). The underlying assumption was that at 5 months after enrolment every participant should have achieved a state of virological suppression. Therefore, the time interval extended from participant enrolment until the end of the study with date of first failure event as the event date. Censoring occurs for those who became uncontactable or died
FIGURE 5.
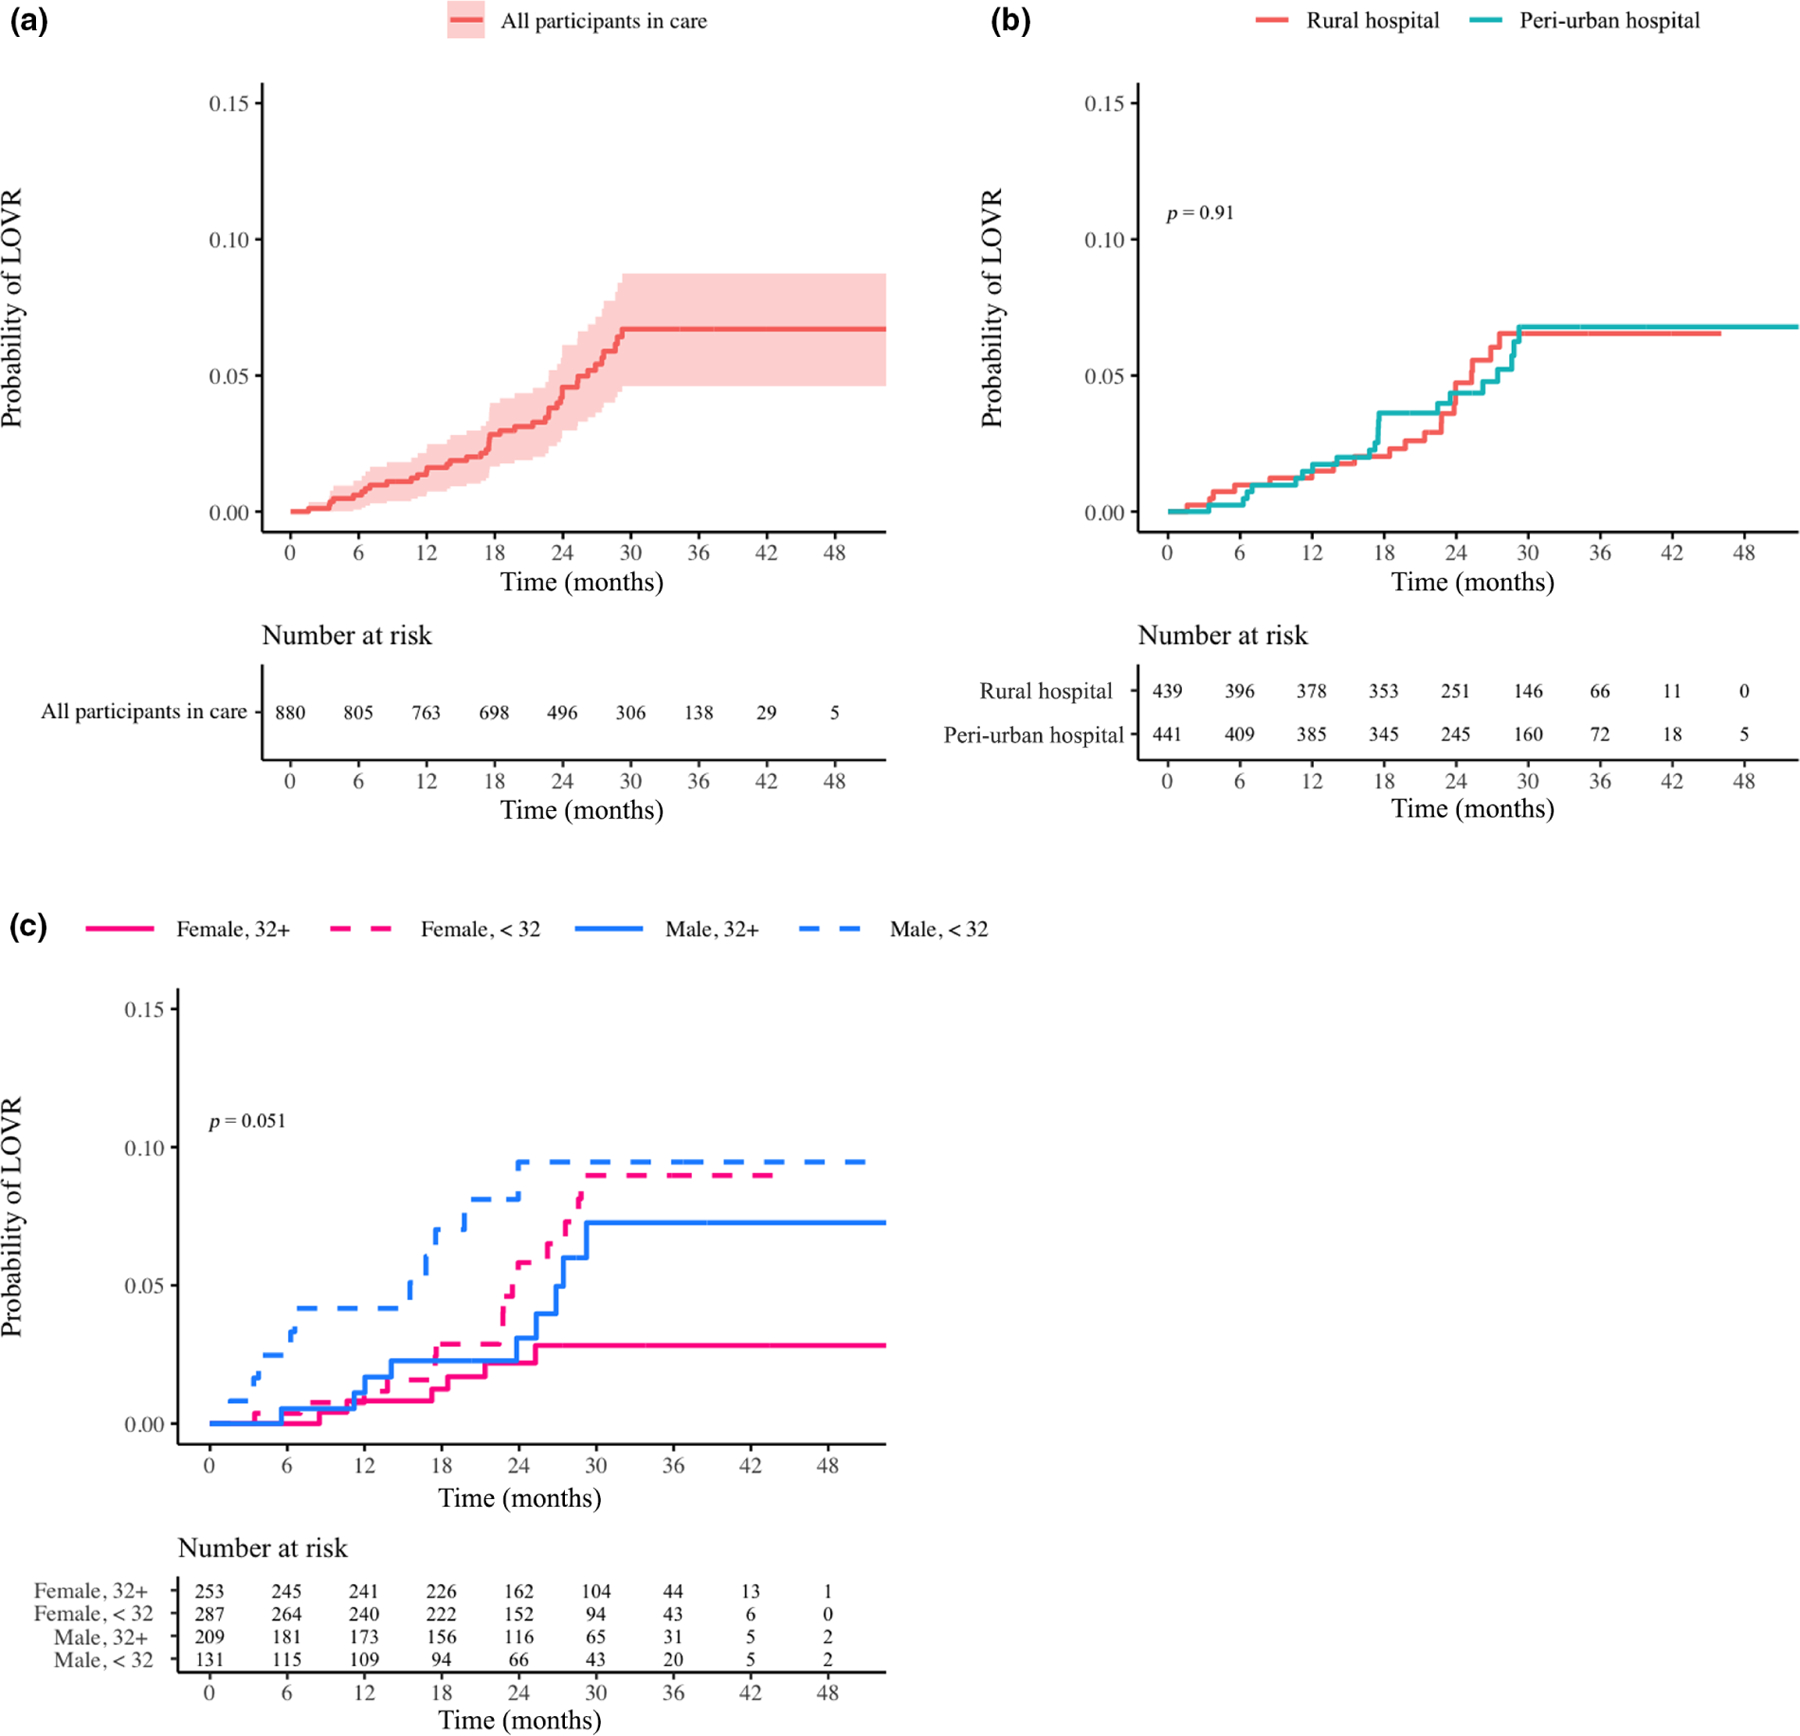
(a–c) Time to loss of virological response for participants in care overall (a), by site (b), and by age/gender (c). Log-rank p-values are provided if significant (< 0.05). The population analysed included only those participants who were suppressed at any point during the study. Therefore, the time interval extended from the date of first suppression until the end of the study, with date of first failure event as the event date. Censoring occurred for those who were lost to follow-up or died
HIV drug resistance at virological failure
Out of 106 participants with VF, 55 had a successful genotypic resistance test. Genotypes were not obtained for the remaining 51 of those participants because 37 provided samples that were below the limit of detection, nine did not return for testing, four provided samples that could not be amplified, and one had poor-quality sequencing. Among 55 genotypes, 42 (76.4%) had at least one known resistance mutation, and 13 had no mutations, which did not differ by clinic site (Figure S5; Table 1). K103N (59% at BTD and 32% RKK) and M184V (52% at RKK and BTD) were the two most common mutations, followed by V106 M (31% at RKK and BTD) and K65R (31% at RKK and 20% at BTD). Only K103N and K65R differed by site. If those cases having a confirmatory VL < 1000 copies/ml were excluded from the VF calculation, there would be 6.8% of those on ART and 7.4% of those on ART having a VL with VF.
DISCUSSION
This large prospective longitudinal cohort study compared outcomes in ART-naïve patients initiating treatment in a peri-urban versus rural setting within a region having the highest prevalence of HIV in the world and demonstrated similar clinic retention, VF, drug resistance and mortality. Outcomes were similar depite substantial differences between the sites. The peri-urban site was characterized by enhanced operational procedures, robust staffing, easy access to laboratories, consistent record-keeping and access to a trained pharmacist. The deep rural site was insufficiently staffed, with few nurses managing all aspects of clinic activity including record-keeping, phlebotomy, monitoring results and dispensing medication. Although VS was noted earlier in the peri-urban clinic, potentially due to differences in the timing of viral load monitoring, ultimately 84% and 91% of participants overall achieved VS by 12 and 24 months, respectively. Of note, men (in particular men < 32 years old) had significantly worse outcomes compared with women and men > 32 years, emphasizing the need for programmes to provide greater support for this group.
Over 15% of participants relocated to an outside clinic, 14% were LTFU and 4% died. In general, multiple factors contributed to a substantial decline in mortality from HIV/AIDS in South Africa over the last 5 years. Free access to potent ART with minimal toxicity, rollout of a universal test and treat policy, and massive educational programmes directed to patients and healthcare providers have all played a role in improving life expectancy in KZN and SA in general from 62.6 years in 1990 to 64.1 years in 2020. The success of this programme can be traced to a substantial increase in the number of patients attending clinics for chronic disease management [10,11]. A systematic review and meta-analysis reported a LTFU rate of 11% at 3 months after ART initiation and 25.1% at 5 years after ART initiation in South Africa [12]. A national laboratory cohort study in South Africa showed that the majority of LTFU cases were attributed to a change in service provider or death [13]. Unfortunately transferring patients back to local clinics in an attempt to ease the burden of travel on patients and to decongest central clinics had a negative effect on retention in care metrics [14–16]. Other factors that affected retention were low CD4 count, poor functionality, younger age, stage 4 disease, poor clinic experience and transfer to the private sector. Patients with lower CD4 counts are more likely to be hospitalized or too ill to travel, adversely impacting retention in care.
Based on the 90–90–90 targets, 73% of all people with HIV and 90% of people on ART must achieve VS. In this study, suppression surpassed 90% by 2 years. This indicates that South Africa may have been close to achieving the third UNAIDS goal. In a 2017 South African cross-sectional household survey, overall 62.3% of people with HIV achieved VS [17]. Similarly, within KZN, only 67.5% of people with HIV had VS. These data suggest that a large proportion of patients either have an unsuppressed viral load, did not have a VL test obtained or were LTFU. This subset of patients is at high risk of transmitting drug-resistant HIV, developing opportunistic diseases, further encumbering the healthcare system, or dying. Despite substantial resources, VL monitoring and resistance testing remain suboptimal in South Africa [18]. Failure to detect VF increases the likelihood of drug resistance. Although VF and drug resistance did not differ between sites, VS was noted earlier for the peri-urban clinic, which probably reflects greater attention to monitoring at this site. Finally, the percentage of patients having at least one major resistance mutation (76.4%) was comparable to other similar studies [19–21]. The most common mutations, K103N, M184V, K65R, and V106 M, reflect the first-line regimen used in the South Africa during the study period [19,21,22].
Our findings of poor outcomes in young men was consistent with reports from other cohorts in South Africa and eastern Africa [22–24]. In addition, a 2017 report showed that men aged 15–24 years had the lowest proportion of VS (41.5%) [20]. Given the migratory nature of the male population, being LTFU and changes in service provider are common. Additionally, inconsistent care for this population has had a documented effect of VF and death [23–25].
Results from ADReSS are critical to informing the 2020 UNAIDS goals from a region with the highest HIV prevalence in the world. These findings can serve as a unique, real-world, prospective benchmark to compare with emerging data for patients receiving dolutegravir-based first-line regimens in South Africa. It remains to be seen whether these regimens will be sufficient to close the gap on the 95–95–95 goals set for 2030.
Limitations of this study include the fact that > 20% of participants did not have a VL, potentially underestimating the true proportion of VS. In addition, some patients with VF did not return for a genotype test. Thus, the proportion of patients with resistance and specific mutations tmay be underestimated. Another limitation is that baseline genotypic reseistance testing is not standard of care therefore, it is possible that some of the mutations described were present prior to initiation of ART. The strengths of this study include the size of the cohorts, the propective design and a unique observation of real-world management of HIV at a programmatic level from two contrasting settings.
CONCLUSIONS
Despite the vast infrastructural and functional differences between peri-urban and rural sites in KZN, we did not detect a statistically significant difference in measured outcomes. Of note, and consistent with other reports, young men were at a higher risk of being LTFU, VF and death. In order to achieve the WHO 95–95–95 goals by 2030, substantial gains in clinic retention and VS are required, especially for young men with HIV. Improved patient service, suffficient virological monitoring and enhanced adherence counselling will be essential.
Supplementary Material
ACKNOWLEDGEMENTS
We are grateful to the participants, clinical staff and study team members at the participating sites for their generous contributions to this work and especially the following ADReSS collaborators: Ansuri Singh, Buhle Zuma, Dr Jacinth Mudali, Dr Khairoonisa Pathan, Dr Cyril Nkabinde, Dr Nompumelelo Gloria Nkabinde, Dr Kelly Gates, Darius McDaniel, Melen Pillay, Dr Thandeka Mtadi, Nomathemba B Zungu, Nomzamo Mbatha, Sajiv Pertab, Sifiso Shange and Sithembile Mafuleka.
Funding information
This work was supported by the National Institute of Allergy and Infectious Diseases of the National Institutes of Health under award number R01 AI098558. VCM received support from the Emory CFAR (P30 AI050409). The content is solely the responsibility of the authors and does not necessarily represent the official views of the National Institutes of Health.
Footnotes
CONFLICTS OF INTEREST
VCM has received investigator-initiated research grants (to the institution) and consultation fees (both unrelated to the current work) from Eli Lilly, Bayer, Gilead Sciences and ViiV. DRK has received consulting honoraria (unrelated to the current work) and/or research grants (to the institution) from Gilead, GlaxoSmithKline, Merck and ViiV. MYSM received consulting fees unrelated to the current work from MSD, J&J, CIPLA and Gilead. All other authors report no potential conflicts.
SUPPORTING INFORMATION
Additional supporting information may be found in the online version of the article at the publisher’s website.
REFERENCES
- 1.UNAIDS. 90–90–90 - An ambitious treatment target to help end the AIDS epidemic [Internet] 2017. https://www.unaids.org/en/resources/documents/2017/90-90-90. Accessed December 8, 2020.
- 2.Universal Test and Treat [Internet] 2016. http://www.kznhealth.gov.za/test_treat.htm. Accessed February 5, 2021.
- 3.Cohen MS, Chen YQ, McCauley M, et al. Antiretroviral therapy for the prevention of HIV-1 transmission. N Engl J Med 2016;375(9):830–839. [DOI] [PMC free article] [PubMed] [Google Scholar]
- 4.Eisinger RW, Dieffenbach CW, Fauci AS. HIV viral load and transmissibility of HIV infection: undetectable equals untransmittable. JAMA 2019;321(5):451–452. [DOI] [PubMed] [Google Scholar]
- 5.Bennett DE, Jordan MR, Bertagnolio S, et al. HIV drug resistance early warning indicators in cohorts of individuals starting antiretroviral therapy between 2004 and 2009: world health organization global report from 50 countries. Clin Infect Dis off Publ Infect Dis Soc Am 2012;54(Suppl 4):S280–S289. [DOI] [PMC free article] [PubMed] [Google Scholar]
- 6.KwaZulu-Natal At A Glance [Internet] Durban, ZA: University of Kwzulu-Natal. http://mepi.ukzn.ac.za/OtherInfo/KZN.aspx. Accessed December 8, 2020. [Google Scholar]
- 7.Brijkumar J, Johnson BA, Zhao Y, et al. A packaged intervention to improve viral load monitoring within a deeply rural health district of South Africa. BMC Infect Dis 2020;20(1):836. [DOI] [PMC free article] [PubMed] [Google Scholar]
- 8.Harris PA, Taylor R, Minor BL, et al. The REDCap consortium: building an international community of software platform partners. J Biomed Inform 2019;95:103208. [DOI] [PMC free article] [PubMed] [Google Scholar]
- 9.Harris PA, Taylor R, Thielke R, Payne J, Gonzalez N, Conde JG. Research electronic data capture (REDCap)–a metadata-driven methodology and workflow process for providing translational research informatics support. J Biomed Inform 2009;42(2):377–381. [DOI] [PMC free article] [PubMed] [Google Scholar]
- 10.Cornell M, Lessells R, Fox MP, et al. Mortality among adults transferred and lost to follow-up from antiretroviral therapy programmes in South Africa: a multicenter cohort study. J Acquir Immune Defic Syndr 1999 2014;67(2):e67–e75. [DOI] [PMC free article] [PubMed] [Google Scholar]
- 11.Wandeler G, Keiser O, Pfeiffer K, et al. Outcomes of antiretroviral treatment programs in rural Southern Africa. J Acquir Immune Defic Syndr 1999 2012;59(2):e9–16. [DOI] [PMC free article] [PubMed] [Google Scholar]
- 12.Kaplan S, Nteso KS, Ford N, Boulle A, Meintjes G. Loss to follow-up from antiretroviral therapy clinics: a systematic review and meta-analysis of published studies in South Africa from 2011 to 2015. South Afr J HIV Med 2019;20(1):984. [DOI] [PMC free article] [PubMed] [Google Scholar]
- 13.Fox MP, Bor J, Brennan AT, et al. Estimating retention in HIV care accounting for patient transfers: a national laboratory cohort study in South Africa. PLoS Medicine 2018;15(6):e1002589. [DOI] [PMC free article] [PubMed] [Google Scholar]
- 14.Colasanti J, McDaniel D, Johnson B, Del Rio C, Sunpath H, Marconi VC. Novel predictors of poor retention following a down-referral from a hospital-based antiretroviral therapy program in South Africa. AIDS Res Hum Retroviruses 2016;32(4):357–363. [DOI] [PMC free article] [PubMed] [Google Scholar]
- 15.Koole O, Tsui S, Wabwire-Mangen F, et al. Retention and risk factors for attrition among adults in antiretroviral treatment programmes in Tanzania, Uganda and Zambia. Trop Med Int Health TM IH 2014;19(12):1397–1410. [DOI] [PMC free article] [PubMed] [Google Scholar]
- 16.Dalal RP, Macphail C, Mqhayi M, et al. Characteristics and outcomes of adult patients lost to follow-up at an antiretroviral treatment clinic in johannesburg, South Africa. J Acquir Immune Defic Syndr 1999 2008;47(1):101–107. [DOI] [PubMed] [Google Scholar]
- 17.Randall S South African national HIV prevalence, incidence, behaviour and communication survey, 2017: towards achieving the UNAIDS 90–90-90 targets 2019.
- 18.Iwuji CC, Shahmanesh M, Koole O, et al. Clinical outcomes after first-line HIV treatment failure in South Africa: the next cascade of care. HIV Med 2020;21(7):457–462. [DOI] [PMC free article] [PubMed] [Google Scholar]
- 19.Marconi VC, Sunpath H, Lu Z, et al. Prevalence of HIV-1 drug resistance after failure of a first highly active antiretroviral therapy regimen in KwaZulu Natal, South Africa. Clin Infect Dis off Publ Infect Dis Soc Am 2008;46(10):1589–1597. [DOI] [PMC free article] [PubMed] [Google Scholar]
- 20.Hunt GM, Dokubo EK, Takuva S, et al. Rates of virological suppression and drug resistance in adult HIV-1-positive patients attending primary healthcare facilities in KwaZulu-Natal, South Africa. J Antimicrob Chemother 2017;72(11):3141–3148. [DOI] [PubMed] [Google Scholar]
- 21.Steegen K, Bronze M, Papathanasopoulos MA, et al. HIV-1 antiretroviral drug resistance patterns in patients failing NNRTI-based treatment: results from a national survey in South Africa. J Antimicrob Chemother 2017;72(1):210–219. [DOI] [PubMed] [Google Scholar]
- 22.Rossouw TM, Nieuwoudt M, Manasa J, et al. HIV drug resistance levels in adults failing first-line antiretroviral therapy in an urban and a rural setting in South Africa. HIV Med 2017;18(2):104–114. [DOI] [PubMed] [Google Scholar]
- 23.Chammartin F, Zürcher K, Keiser O, et al. Outcomes of patients lost to follow-up in african antiretroviral therapy programs: individual patient data meta-analysis. Clin Infect Dis off Publ Infect Dis Soc Am 2018;67(11):1643–1652. [DOI] [PMC free article] [PubMed] [Google Scholar]
- 24.Henson PM, Gould D, Becker EL. Activation of stimulus-specific serine esterases (proteases) in the initiation of platelet secretion. I. Demonstration with organophosphorus inhibitors. J Exp Med 1976;144(6):1657–1673. [DOI] [PMC free article] [PubMed] [Google Scholar]
- 25.Blevins M, José E, Bilhete FR, et al. Two-year death and loss to follow-up outcomes by source of referral to HIV care for HIV-infected patients initiating antiretroviral therapy in rural Mozambique. AIDS Res Hum Retroviruses 2015;31(2):198–207. [DOI] [PMC free article] [PubMed] [Google Scholar]
Associated Data
This section collects any data citations, data availability statements, or supplementary materials included in this article.


