

Abstract
Objective:
Early identification can improve outcomes for children with autism spectrum disorder (ASD). We sought to assess changes in early ASD identification over time and by co-occurring intellectual disability (ID) and race/ethnicity.
Method:
Using data for 2002–2016 from a biennial population-based ASD surveillance program among 8-year-old children in the United States, we defined identification as a child’s earliest recorded ASD diagnosis or special education eligibility. Unidentified children had characteristics meeting the ASD surveillance case definition but no recorded identification by age 8 years. We calculated median age at identification among identified children, median age at identification including unidentified children, and cumulative incidence of identification by age 48 months.
Results:
ASD identification by age 48 months was 4 times (95% CI: 3.6–4.3) as likely in 2016 as in 2002, with the largest increases among children without ID. Median age at ASD identification among identified children decreased 3 months during this time. Children of every race/ethnicity were more likely to be identified over time. There were racial disparities stratified by ID: in 2016, Black and Hispanic children without ID were less likely to be identified with ASD than were White children (both groups risk ratio: 0.7; 95% CI: 0.5–0.8), but Black children were 1.5 times (95% CI: 1.3–1.9) as likely as White children to be identified with ASD and ID.
Conclusion:
Substantial progress has been made to identify more children with ASD early, despite minimal decrease in median age at diagnosis. Considerable disparities remain in early ASD identification by race/ethnicity and co-occurring intellectual disability.
Keywords: health status disparities, autism spectrum disorder, intellectual disability, epidemiology
Autism spectrum disorder (ASD) is characterized by social and communication impairment and restricted or repetitive behaviors.1 Early identification and intervention can improve outcomes for children with ASD.2–4 Tracking progress in early ASD identification over time, and whether there are disparities between groups, can support efforts to ensure that all children receive timely identification.
How early ASD identification is quantified and reported could influence interpretation of progress and disparities. Since 2000, the Autism and Developmental Disabilities Monitoring (ADDM) Network has used median age at earliest ASD diagnosis to measure early identification.5 This measure changed minimally from 2000–2016,6 which has prompted concerns about lack of progress in early ASD identification.7 Limitations to this measure, however, could mask improvement and disparities in early identification. The reported median indicates the age at which 50% of children with a recorded diagnosis were diagnosed and excludes children with characteristics meeting the ADDM ASD surveillance case definition who did not have a recorded diagnosis. Excluding children with ASD who would presumably receive an ASD diagnosis after age 8 years will bias median age estimates toward younger ages.8–10 This downward bias is greater when more children with ASD are undiagnosed.
Several studies of ADDM Network data have accounted for children without a documented ASD diagnosis or special education eligibility in median age calculations, and have found characteristics associated with earlier median age at identification.8,10 One found that the median age including unidentified children decreased across ADDM sites from 2006–2012.11 Although including unidentified cases in calculations reduces downward bias of estimates, median-based measures do not reflect differences in ASD prevalence and are sensitive to length of follow-up, complicating comparisons over time and between groups. If more children are identified across all ages, the median age will not change and will not reflect that the number of children diagnosed earlier is increasing. In addition, medians will generally be higher in an older cohort simply because a higher range of ages is possible.
Cumulative incidence is an alternative measure of early ASD identification that does reflect prevalence and allows age-by-age comparison over time and between groups of children. Cumulative incidence of ASD steadily increased for birth cohorts from 1980–2012 in Denmark12 and from 1990–2003 in California.13 The ADDM Network presented cumulative incidence measures for the first time in surveillance reports for 2016.6,14 Consistent with other studies, cumulative incidence of ASD diagnosis was higher for children born in 2012 compared to children born in 2008—indicating that more children were diagnosed early.14 How cumulative incidence of identified ASD has differed or changed over time by characteristics such as intellectual ability and race has not been reported.
In this study, we compared median-based and cumulative incidence approaches to assess progress in early ASD identification over time and by geography in the ADDM Network, and describe differences by co-occurring intellectual disability and race/ethnicity. Findings can be used to identify improvements and remaining gaps in early ASD identification. Findings will also help guide future reporting and interpretation of commonly used measures, providing additional information for action in support of early ASD identification efforts.
METHOD
Data Sources
The ADDM Network has reported biennial estimates of prevalence and characteristics of children aged 8 years with ASD in geographically defined surveillance areas (sites) across the United States since 2000. This study focused on 2002 and after because data were not available for Hispanic children in 2000.
Full descriptions of ADDM Network methods are available elsewhere.5,6,8,10,15–20 In brief, clinicians reviewed records from available health and education sources and applied a standardized surveillance case definition of ASD based on behavioral criteria for autism described in the DSM-IV (2000–2014) and DSM-5 (2016). Education records were not available for review at all sites during all surveillance years. The ADDM ASD surveillance case definition did not require a recorded clinical diagnosis or special education eligibility if clinician review determined that the child’s documented symptoms were best described as ASD.
In this study, children were considered to have ASD if they met the standardized ADDM ASD surveillance case definition. Children with a recorded ASD diagnosis or special education eligibility were considered “identified”; children without an ASD diagnosis or special education eligibility were considered “unidentified” through age 8 years. For children whose records contained information about IQ, co-occurring intellectual disability (ID) was defined as a score ≤70 on a child’s most recent IQ test or an examiner’s statement of ID in a developmental evaluation.
This analysis defines surveillance areas as described in each surveillance report. The sites participating in ADDM, as well as their respective surveillance areas, have changed over time, with 8–14 sites per year across the United States (www.cdc.gov/autismdataviz#resources). Consistent with the surveillance year 2012 report, the geographic area with education and health record access was used for Maryland in 2012.19
Information about race and ethnicity was abstracted from health or education records and supplemented by data from birth certificates and administrative or billing information. Analyses of race/ethnicity were limited to non-Hispanic Black (Black), non-Hispanic White (White), and Hispanic children because of small numbers in other groups.
Denominators for all sites and surveillance years included in this study are available in Table S1, available online, and were based on National Center for Health Statistics bridged-race postcensal population estimates (https://www.cdc.gov/nchs). For surveillance areas smaller than county level, populations were adjusted using public school enrollment counts (https://nces.ed.gov/ccd/pubagency.asp).
Statistical Analysis
Age at identification was defined as the age in months at a child’s earliest recorded ASD diagnosis or special education eligibility. Children with identification ages that were implausible (<6 months, n = 7) or invalid (>8 years, n = 5) and children with conflicting information about special education eligibility classification (n = 9) were excluded from analysis.
For analyses of geographic variability in progress in early identification over time, a subset of 9 sites were included that participated consecutively from 2008–2016: Arizona, Arkansas, Colorado, Georgia, Maryland, Missouri, New Jersey, North Carolina, and Wisconsin. For analyses of ID, the subset of sites with IQ data in ADDM surveillance reports were included (see footnote in Table S1, available online). Children who were not Black, White, or Hispanic, and children with unknown ID case status were included in overall analyses of progress over time but were excluded from analyses stratified by race/ethnicity or ID, respectively.
R (version 4.0.3; R Foundation for Statistical Computing, Vienna, Austria) was used for all analyses and visualizations. Median age at identification was calculated as the age in months at which 50% of children with recorded diagnosis or special education eligibility were identified (“median among identified children”). Median age was alternatively calculated including unidentified cases as censored observations, giving the age in months at which 50% of all cases were identified (“median including unidentified children”). The cumulative hazard or log of survival was used to calculate 95% CIs for medians.21,22 Permutation tests were used to test differences between median-based measures,23 with p values <.05 considered statistically significant.
Cumulative incidence of identified ASD was calculated as the number of children with an ASD diagnosis or special education eligibility at or before each month of age divided by the total population (single-month incidence was also calculated). Cumulative incidence of identified ASD by age 8 years and ADDM-reported prevalence differ because unidentified children are not included in cumulative incidence numerators.6 We report cumulative incidence of identified ASD by age 48 months as “cumulative incidence of early-identified ASD.” Cumulative incidence 95% CIs were calculated using the Wilson score method.24 Risk ratios25 and risk differences26 were used to compare cumulative incidences; risk ratios with 95% CIs that excluded 1 and risk differences with 95% CIs that excluded 0 were considered statistically significant.
RESULTS
A total of 31,393 children with ASD were included in the study. The number of children with ASD ranged from 1,370 (2004) to 5,469 (2014) (Table S1, available online). The percentage of children with a recorded ASD diagnosis or special education eligibility increased from 67.5% in 2002 to 82.7% in 2016. The percentage of children with ASD special education eligibility as their earliest or only identification also increased from 4.8% in 2002 to 16.2% in 2016. The total number of cases and the number of cases with recorded diagnosis or special education eligibility for all sites and surveillance years are available in Table S1, available online.
Progress in Early ASD Identification Over Time
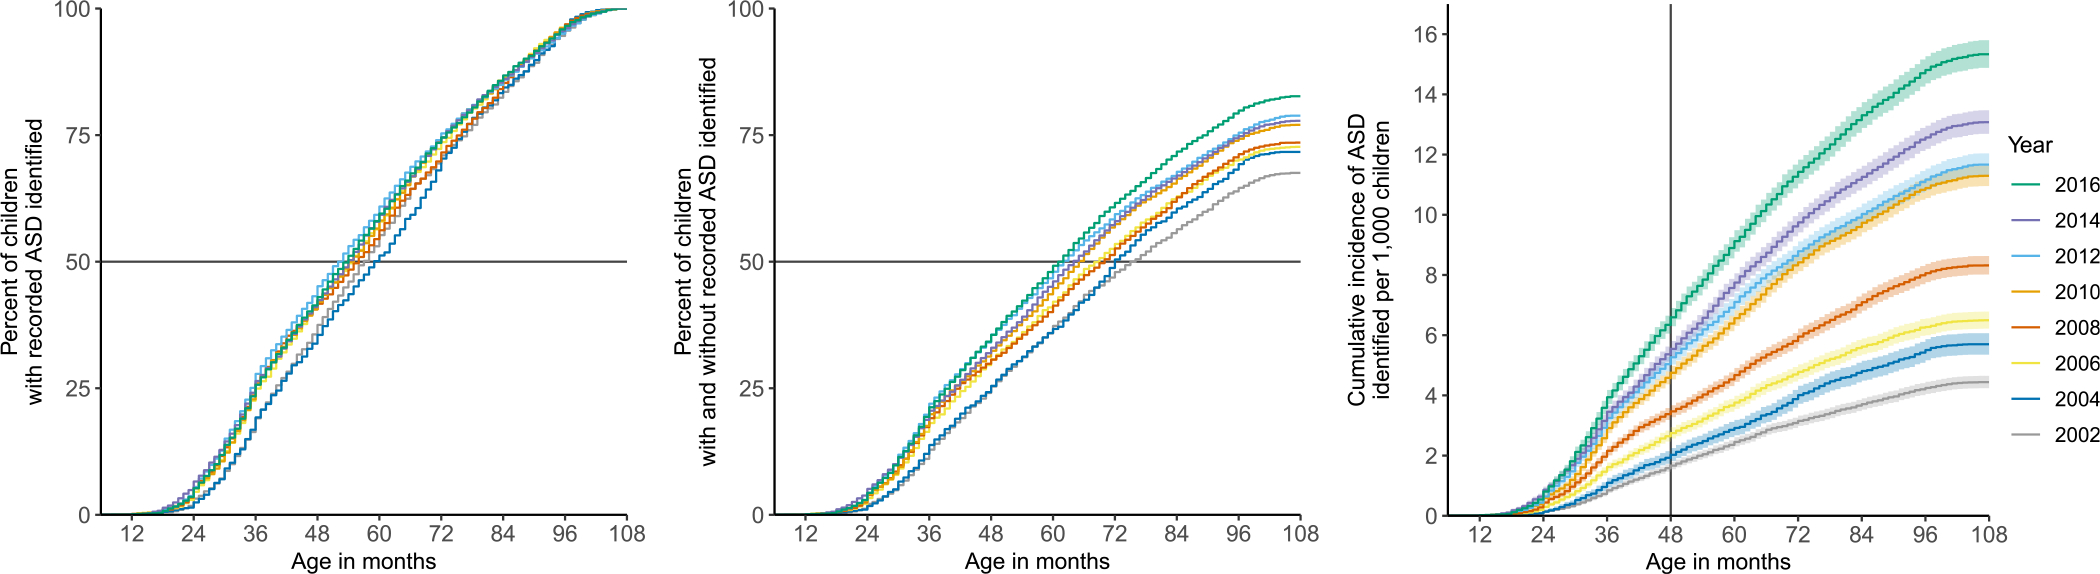
Figure 1 shows ASD identification by month of age for children through age 8 years from 2002–2016 using the 3 measures. The left panel shows the percentage of children with a recorded ASD identification who were identified, with a line at 50% indicating the median among identified children. The middle panel shows the percentage of children with and without recorded ASD identification who were identified, with a line at 50% indicating the median including unidentified children. The right panel shows the cumulative incidence of identified ASD per 1,000 children, with a line at age 48 months indicating early identification. Values and statistics for median among identified children, median including unidentified children, and cumulative incidence of early-identified ASD (by age 48 months) are given for each year relative to 2002 in Figure S1 and Table S2, available online.
FIGURE 1.
Early Identification of Autism Spectrum Disorder (ASD) Using 3 Metrics
Note: In the first panel, the gray line indicates the age in months at which 50% of children with recorded autism spectrum disorder (ASD) diagnosis or special education eligibility were identified (median among identified children). In the second panel, the line indicates the age in months at which 50% of children with and without recorded ASD were identified (median including unidentified children). In the third panel, the line indicates cumulative incidence of ASD identified by age 48 months per 1,000 children. Data are from the Autism and Developmental Disabilities Monitoring Network from 2002–2016.
The overall median among identified children was 57 months in 2002 and 54 months in 2016, a decrease of 3 months that was statistically significant by permutation test. The median among identified children was highest in 2004 (59 months) and lowest in 2012 (52.5 months). The left panel of Figure 1 illustrates that although the difference between first and last surveillance years was statistically significant, medians among identified children have been similar across surveillance years, without a pattern of decrease by year.
The median age including unidentified children was 76 months in 2002 and 62 months in 2016, a significant decrease of 14 months. There was an increase in overall percentage of identified children during this time, from 67.5% in 2002 to 82.7% in 2016; this is visible as the end point of each line at 108 months in the middle panel of Figure 1. The decrease in unidentified children meant that fewer children were censored over time with this approach, which contributed to the decrease in this median.
Cumulative incidence of early-identified ASD increased from 1.7 per 1,000 children in 2002 to 6.6 per 1,000 in 2016. This was a 4-fold increase, or 5 more children identified per 1,000. The right panel of Figure 1 shows year-by-year increases in cumulative incidence of early-identified ASD.
Geographic Variability in Progress Over Time
Looking at sites that participated in ADDM surveillance consecutively in the subset of years from 2008–2016, values for median among identified children ranged from 46 months (Missouri) to 65 months (Maryland) in 2008, and from 48 months (Maryland and North Carolina) to 60 months (Arizona and Georgia) in 2016 (Figure S2, top panels and Table S3, available online). There was no change in the median among identified children for the majority of sites (5 of 9). Two sites had years in which the median among identified children was lower than in 2008, namely, Georgia (2010–2014) and Maryland (2010–2016). Two other states had years in which the median among identified children was higher than 2008, namely, Arkansas (2010) and Missouri (2012–2016).
Values for median including unidentified children in this time period ranged from 59 months (Wisconsin) to 82 months (Colorado) in 2008, and from 54 months (Wisconsin) to 69 months (Colorado) in 2016 (Figure S2, bottom panels and Table S3, available online).The median age including unidentified children was significantly lower than 2008 for 5 of 9 sites: Arizona (2012–2016), Georgia and Missouri (2010–2016), North Carolina (2016), and New Jersey (2012). There was no change in this metric over time in Arkansas, Colorado, Missouri, and Wisconsin.
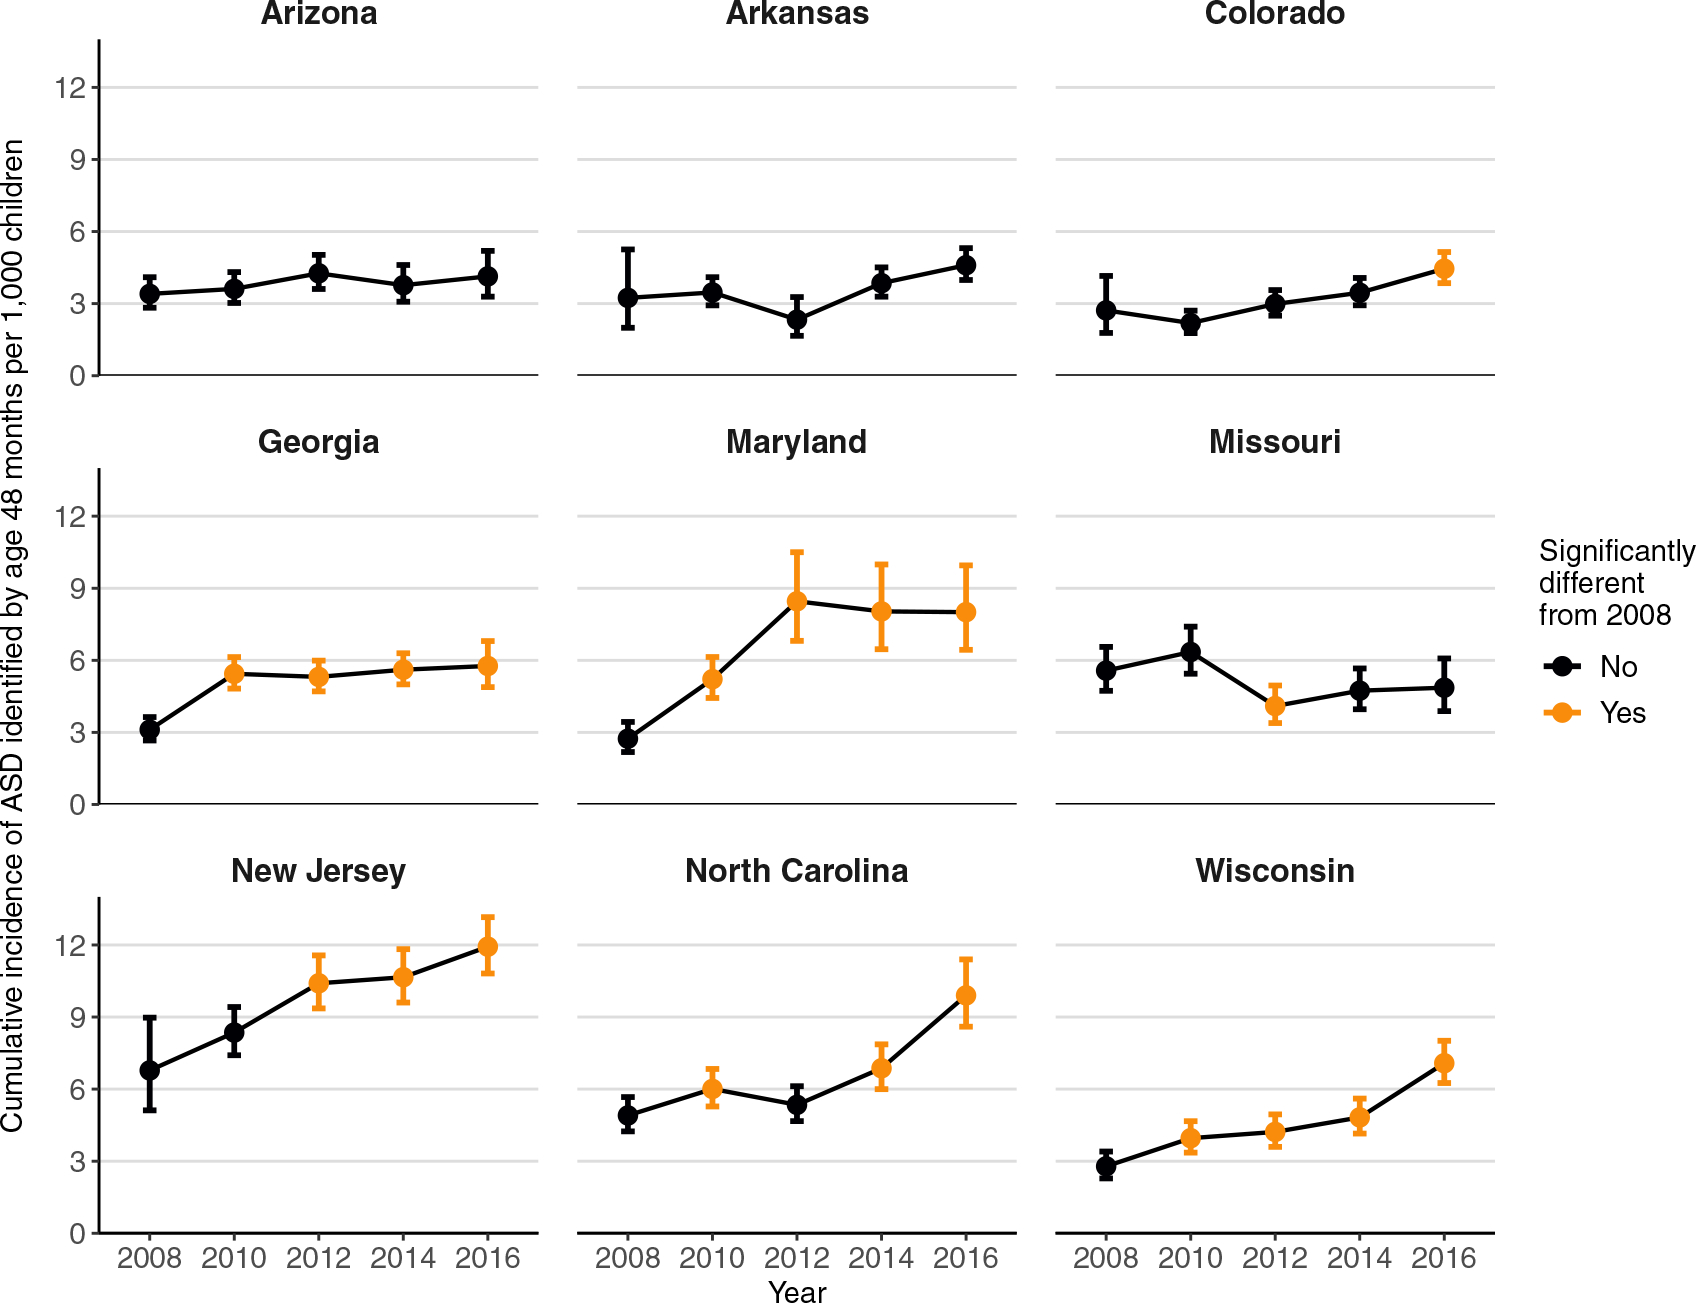
Cumulative incidence of early-identified ASD ranged from 2.7 per 1,000 (Colorado and Maryland) to 6.8 per 1,000 (New Jersey) in 2008, and from 4.1 per 1,000 (Arizona) to 11.9 per 1,000 (New Jersey) in 2016 (Figure 2; values are given in Table S3, available online). There were significant increases at 6 of 9 sites during this time period, with children 1.6 to 2.9 times as likely to have early-identified ASD in 2016 than in 2008. This translated to 2 more children per 1,000 identified with autism by age 48 months in Colorado, 3 more per 1,000 in Georgia, 4 more per 1,000 in Wisconsin, and 5 more per 1,000 in North Carolina, New Jersey, and Maryland. In Arizona and Arkansas, cumulative incidence of early-identified ASD did not change significantly; in Missouri, it was lower in 2012 than in 2008, but subsequent years were not significantly different from 2008.
FIGURE 2.
Cumulative Incidence of Early-Identified Autism Spectrum Disorder (ASD) Identification by Site
Note: Cumulative incidence is by age 48 months per 1,000 children. Limited to 9 sites that participated in the Autism and Developmental Disabilities Monitoring Network each surveillance year from 2008–2016.
Differences in Early Identification by Co-occurring Intellectual Disability
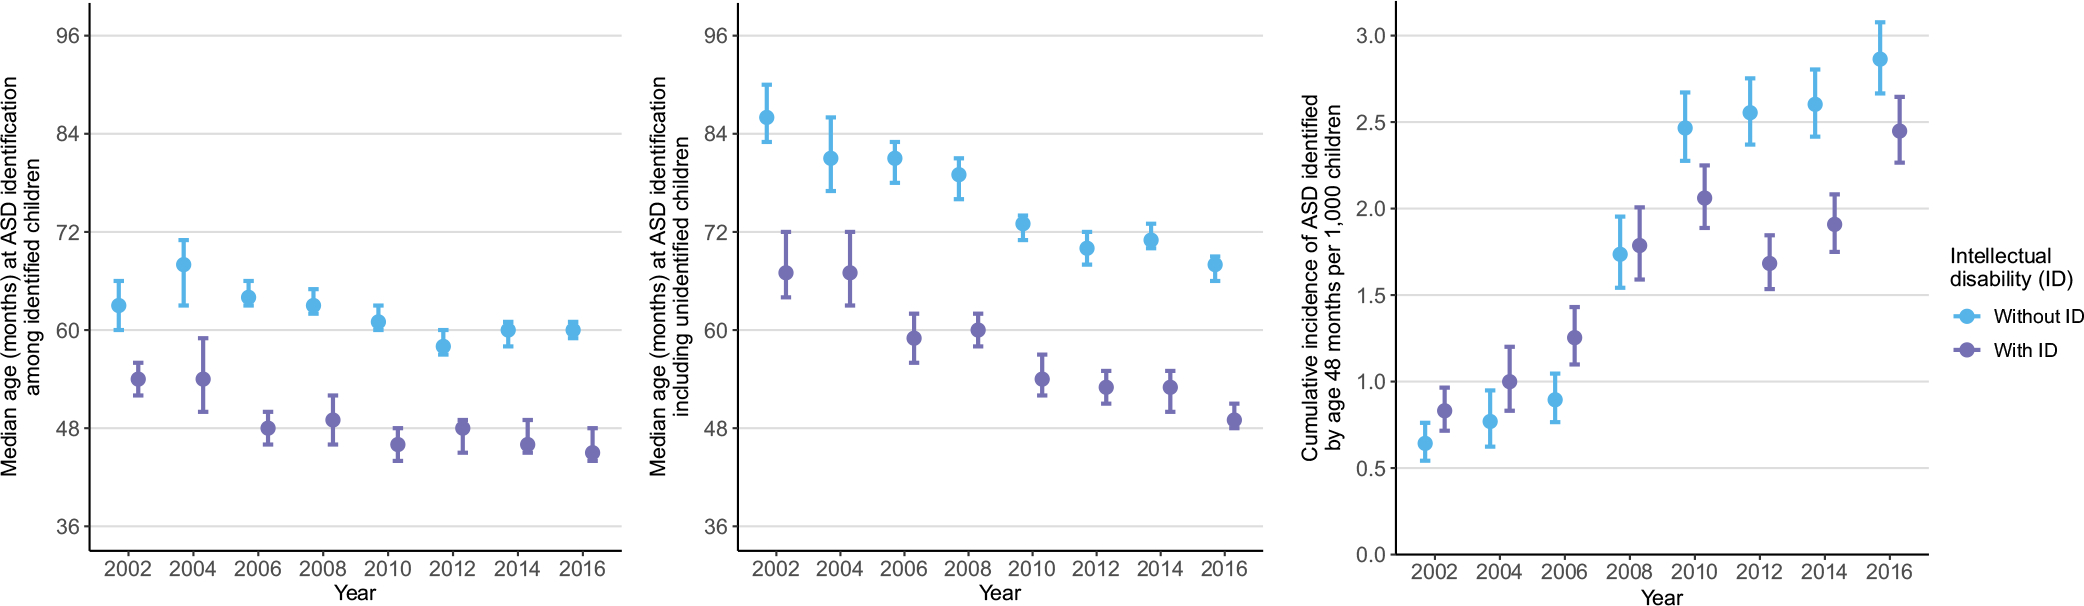
In the subset of sites with IQ data in ADDM surveillance reports (see footnote, Table S1, available online), and among children with known ID case status, the median among identified children was lower for children with ID every year (from 9 to 16 months lower) compared to children without ID (Figure 3, left panel and Table S4, available online). Over time, the median among identified children for children with ID decreased significantly, from 54 months in 2002 to 45 months in 2016. The median among identified children for children without ID did not change significantly from 63 months in 2002 to 60 months in 2016 (Table S5, available online).
FIGURE 3.
Three Metrics of Early Identification of Autism Spectrum Disorder (ASD) by Presence of Co-occurring Intellectual Disability (ID)
Note: Limited to sites with IQ data in Autism and Developmental Disabilities Monitoring Network surveillance reports from 2002–2016; excludes children with unknown ID case status. The first panel shows the median among identified children, which is the age in months at which 50% of children with recorded ASD diagnosis or special education eligibility were identified. The second panel shows the median including unidentified children, which is the age in months at which 50% of children with and without recorded ASD were identified. The third panel shows cumulative incidence of ASD identified by age 48 months per 1,000 children.
The median age including unidentified children showed the same pattern of earlier identification of children with ID every year (from 14 to 22 months lower than children without ID; Figure 3, middle panel and Table S4, available online). Unlike the median among identified children, however, significant improvement in the median including unidentified children was seen not only for children with ID (from 67 months in 2002 to 49 months in 2016) but also for children without ID (from 86 months in 2002 to 68 months in 2016) (Table S5, available online).
From 2002–2008, cumulative incidence of early-identified ASD among children without ID was similar to or lower than in children with ID; since 2010, children without ID were more likely to be identified than children with ID (Figure 3, right panel and Table S4, available online). Cumulative incidence of early-identified ASD was significantly higher than 2002 among children with and without ID every surveillance year 2006 and after (Figure 3, right panel). Overall, from 2002–2016, cumulative incidence of early-identified ASD among children with ID increased 2.9-fold, from 0.8 per 1,000 children in 2002 to 2.4 per 1,000 in 2016. Among children without ID, cumulative incidence of early-identified ASD increased 4.5-fold, from 0.6 per 1,000 in 2002 to 2.9 per 1,000 in 2016 (Table S5, available online).
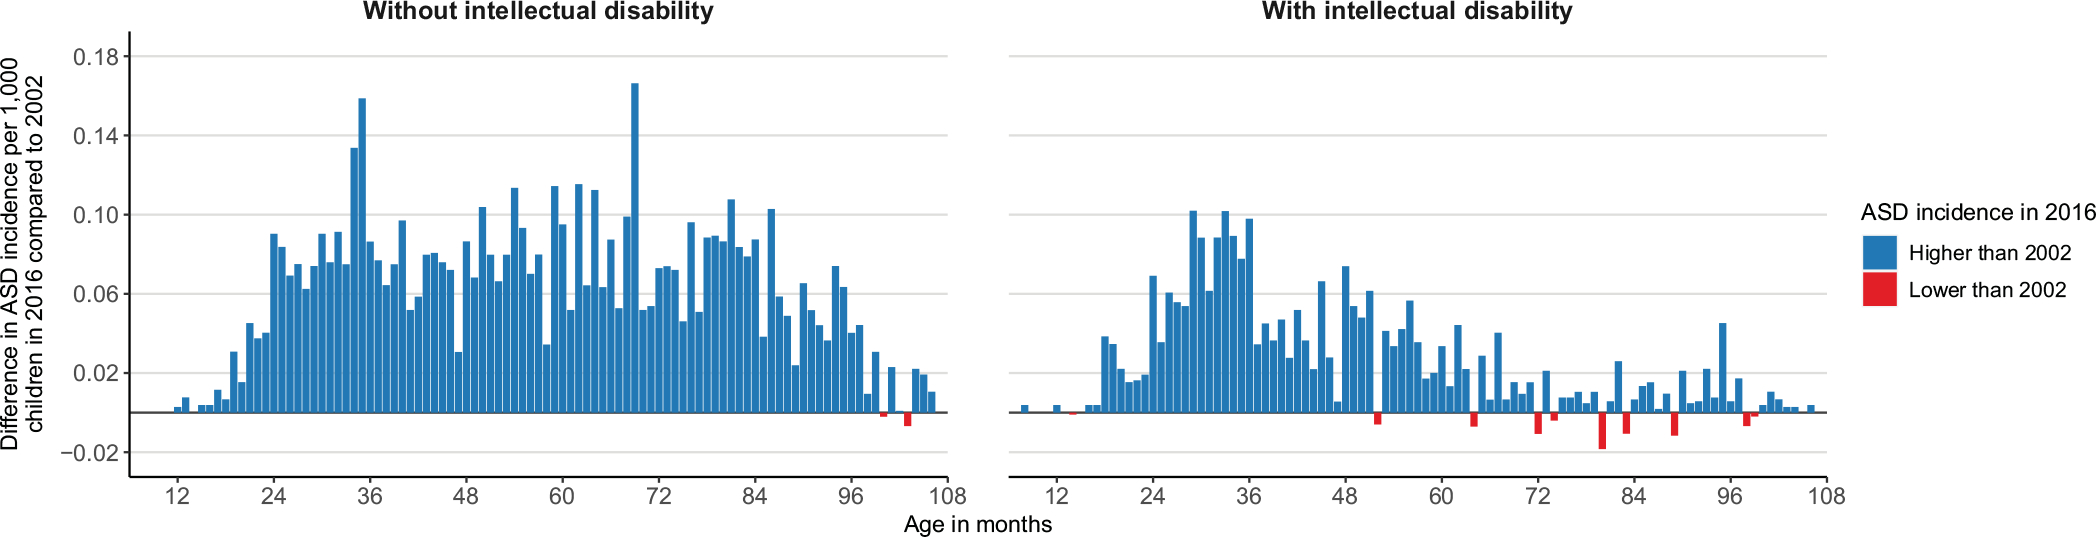
Figure 4 shows the difference in incidence of ASD identification per 1,000 at each month of age for children with and without ID in 2016 compared to 2002. Positive values (in blue) indicate an increase in ASD identification at a given month of age, and negative values (in red) indicate a decrease. For children without ID, there have been relatively uniform increases in ASD identification between ages 24 and 96 months (Figure 4, left panel). For children with ID, increases in ASD identification were more pronounced for younger versus older children (Figure 4, right panel). This pattern emerged across years and was not limited to 2016 (Figure S3 available online).
FIGURE 4.
Difference in Autism Spectrum Disorder (ASD) Incidence in 2016 Compared to 2002 for Each Month of Age and by Co-occurring Intellectual Disability (ID)
Note: Limited to sites with IQ data in Autism and Developmental Disabilities Monitoring Network surveillance reports; excludes children with unknown ID case status.
Differences in Early Identification by Race/Ethnicity
The median among identified children decreased significantly only for Black children, from 58 months in 2002 to 53 months in 2016. There was no significant change for Hispanic children from 2002–2016. The median among identified children for White children was significantly lower only in 2012 (52 months) than in 2002 (56 months) (Figure S4, top panel and Table S6, available online). There were no significant differences in the median among identified children for Black compared to White children in any year. There was only 1 significant difference for Hispanic compared to White children, namely, a higher median among identified children in 2010 (Table S7, available online).
There were significant decreases in median age including unidentified children for all 3 groups from 2002–2016. Over time, this measure decreased from 73 months to 60 months for Black children, 80 months to 59 months for Hispanic children, and 75 months to 62 months for White children (Figure S4, middle panel and Table S6, available online). Comparing between groups, there were no differences in median including unidentified children for Black compared to White children in any year. In 2 years (2004 and 2010), this measure was higher for Hispanic compared to White children (Table S7, available online).
From 2006–2016, cumulative incidence of early-identified ASD for all 3 groups was significantly higher than in 2002, with steady increases apparent over time (Figure S4, lower panel and Table S6, available online). In 2016, cumulative incidence of early-identified ASD was 3.5, 4.9, and 5.5 times as high compared to 2002 for White, Black, and Hispanic children, respectively. Relative gains were higher for Black and Hispanic children because cumulative incidence of early-identified ASD was lower for these groups than for White children in 2002. Absolute gains, however, were the same for all racial/ethnic groups: 5 more children identified per 1,000. Comparing between groups, cumulative incidence of early-identified ASD for Black children was lower than among White children from 2002–2012 (risk ratios from 0.7 to 0.8) but was not significantly different in 2014 or 2016. Early identification by this measure was lower for Hispanic children in every surveillance year, ranging from 0.5 to 0.8 times the rate among White children (Table S7, available online).
Differences in Early Identification by Race/Ethnicity and Co-occurring ID
For children without ID, median age at ASD identification among identified children was significantly higher only for Black children compared to White children in 2008, with no differences between Hispanic and White children in any year (Figure S5, top and middle panels and Table S8, available online). Median age including unidentified children was higher for Black and Hispanic children than for White children in 2006 and was also higher for Black children in 2010. From 2012–2016, median-based measurements were not different between groups.
Among children with ID, the median among identified children was higher for Black children than for White children in 2002, 2006, and 2008, and was higher for Hispanic children than for White children from 2008–2012 (Table S8, available online). Median age including unidentified children was significantly higher for Black children than for White children in 2002 and 2008 and was higher for Hispanic children than for White children in 2002, 2004, and 2008–2012. Neither of the median-based measurements was significantly different from that of White children in the 4 most recent surveillance years (2010–2016) for Black children or in the 2 most recent surveillance years (2014–2016) for Hispanic children.
Cumulative incidence of early-identified ASD among children without ID was significantly lower for Black and Hispanic children every surveillance year since 2002 (2002 and 2016 shown in Figure 5, left panel; values for all years available in Figure S5 and Table S8, available online). Rates among Black and Hispanic children without ID were from 0.2 to 0.6 times the rates of identification for White children from 2002–2012. In 2016, Black and Hispanic children without ID were both identified with ASD at 0.7 times the rate of White children (both groups 95% CI: 0.5–0.8) (Table S8, available online).
FIGURE 5.

Cumulative Incidence of Early-Identified Autism Spectrum Disorder (ASD) by Race/Ethnicity and Co-occurring Intellectual Disability (ID) in 2002 and 2016
Note: Cumulative incidence is by age 48 months per 1,000 children. Limited to sites with IQ data in Autism and Developmental Disabilities Monitoring Network surveillance reports; excludes children with unknown ID case status.
For children with ID, cumulative incidence of early-identified ASD went from being similar among Black, Hispanic, and White children in 2002 to being 1.5 times as high among Black children in 2016 (95% CI: 1.3–1.9) (Figure 5, right panel). Figure S6, available online, shows cumulative incidence of identified ASD at each month of age for Black, Hispanic, and White children in 2016, showing that disparities in identification exist across the entire age span. In addition, though small numbers limit statistical comparisons by site, the pattern of higher cumulative incidence of identified ASD with ID among Black children than among White children, and the lower cumulative incidence of identified ASD without ID among Black and Hispanic children than among White children, was consistent across sites in 2016 (Figure S7, Table S9, available online).
DISCUSSION
The median age calculation typically published in ADDM reports did not capture progress and disparities in early identification. Overall, the median age at ASD identification among identified children decreased only 3 months from 2002–2016, and gaps in identification among Black, Hispanic, and White children were not apparent in recent years. There were improvements in median age, including unidentified children, largely because there were proportionally fewer children without a recorded ASD diagnosis or special education eligibility over time.27
Earlier identification of children with ID compared to children without ID was observed using median-based measures in every year. This is consistent with prior ADDM studies and a population-based cohort in the United Kingdom,28 which have reported earlier evaluation6,8,10 and diagnosis6,8,10,28 for children with ID. There was also no significant decrease in the median among identified children for children without ID, whereas there was a decrease among children with ASD and ID. This was because increases in identification for children with ID were focused on earlier ages, whereas there were increases across all ages for children without ID. These findings suggest that there is still room for improvement to identify these children earlier.
Cumulative incidence—a measure that incorporates information about prevalence—revealed encouraging signs of progress, yet also striking disparities in early ASD identification based on ID and race/ethnicity. In each group, children were more likely to be identified with ASD in 2016 than in 2002, with substantial progress made in identifying more children without co-occurring ID. Progress was not uniform, however, among sites that participated in all surveillance years from 2008–2016. Although most sites showed increases in early ASD identification in this time frame, significant improvement was not seen for Arizona, Arkansas, or Missouri. This could reflect fewer services available in these surveillance areas, or populations with lower socioeconomic status (SES)29 who may have less access to services. Some sites, such as New Jersey, showed large increases in cumulative incidence of early-identified ASD—progress that was masked by median age of identification.
The overall gap in early identification between Black and Hispanic compared to White children has been narrowing over time. Black children were identified early at the same rate as White children in 2014 and 2016, but fewer Hispanic children were identified with ASD by 48 months than were White children in every year. The findings by race/ethnicity are similar to reported ASD prevalence for these groups, with 2016 being the first year in which prevalence was the same between Black and White children (albeit still lower among Hispanic children).6
Further disparities emerged when children were stratified by ID status. Among children without ID, early ASD identification was lower in every surveillance year among Black and Hispanic children—from one-fifth to two-thirds the rate of identification among White children. Lower SES has been associated with lower prevalence of ASD8,11,29 and could be one contributing factor, but disparities in identification remain after adjusting for SES.11,29 A recent review found that racial and ethnic minorities had less access to health care and reported lower quality of care.30 Language can also be a barrier for Spanish-speaking Hispanic families,30 suggesting a need to improve outreach, information, and system accessibility for non–English speakers. One resource is CDC’s “Learn the Signs. Act Early.” program, which provides free developmental milestone tracking tools, books, and other informational materials in English, Spanish, and other languages (https://www.cdc.gov/ncbddd/actearly/freematerials.html).
There was also a striking disparity in early ASD identification among children with ID: in recent years, Black children were around 50% more likely to be identified with ASD and co-occurring ID than were White and Hispanic children. This finding is consistent with a recent ADDM study that found higher ID prevalence among Black children compared to White, Asian, or Hispanic children.31 Contributing to this disparity are social determinants of health, which include individual and community-level factors such as SES, housing, physical environment, and experiences with racism and racial discrimination. Unlike with ASD, lower SES has been associated with higher prevalence of ID.31 Adverse birth outcomes such as preterm birth and low birth weight—linked to social determinants of health32—are more common among Black births than White or Hispanic births33 and are associated with higher risk of ID.34,35
There is also evidence of inequities in access to services—another aspect of social determinants of health—for Black children with ASD and ID. For instance, the 2016 ADDM prevalence report found that despite being more likely to have co-occurring ID than White children, Black children with ASD were less likely to be evaluated for ASD by age 36 months.6 The same report also found that Black children with ID had a higher median age at ASD diagnosis than White children with ID.6 This difference in median age was not apparent in the current study, which used a broader definition of “identification” that included ASD special education eligibility from education sources, where Black children are more likely to have records.36
The disparity in identification of Black children with ASD and ID is likely multifactorial and will require interventions targeting social determinants of health at the individual and community level, including preventing known ID risk factors such as adverse birth outcomes. This study did not include children with only ID to address whether ASD might be missed among Black children compared to other groups, but a study of ID prevalence in 2014 found that Black children were proportionally less likely to have an ASD diagnosis than were other racial groups.31 It is vital to ensure that Black children with or without ID receive timely diagnosis and appropriate intervention for ASD.
Developmental screening is one important way to identify developmental problems, including ASD, early. The American Academy of Pediatrics Periodic Survey data from 2002–2016 found that pediatricians’ self-reported use of developmental screening tools tripled, and referral of at-risk patients to early intervention also increased during this time period.37 Earlier surveys did not include specific questions about ASD screening and referral, but increased developmental screening could result in more children with developmental concerns including ASD being referred for potential diagnosis, and could have contributed to the improvements seen in this study. Efforts to increase developmental screening and enrollment in early intervention—2 objectives of Healthy People 203038—could also include monitoring and eliminating racial disparities in these goals.
Results of this study might not generalize to communities that do not participate in ADDM, and there is considerable variability among ADDM sites.6,19,20,39 Although communities participating in the ADDM Network have changed over the years, this limitation was partially mitigated by examining year-to-year change by site. In addition, this analysis used the metrics and data as presented in the ADDM Network reports and did not perform multivariable analyses; however, the median-based measure results are qualitatively similar to the results of a recent multivariable analysis.11 Future papers could examine factors in more complex models using cumulative incidence.
In the future, linking ADDM Network data to screening or other medical and educational service use data could provide more information about how children with ASD are—or are not—identified early. Data describing children’s paths from screening to diagnosis to interventions could identify barriers to accessing needed services.
Our findings reveal that substantially more children with ASD are being identified early than in the past, especially those without ID. This progress has occurred as greater emphasis has been placed on increasing screening and timely evaluation and diagnosis of children with autism. Despite this progress, there is still room for improvement to identify children without ID earlier, and there are still concerning racial disparities among children with similar cognitive ability. Considerable work remains to continue to increase early and equitable identification of children with ASD.
Supplementary Material
Acknowledgments
The authors have reported no funding for this work. The findings and conclusions in this report are those of the authors and do not necessarily represent the official position of the Centers for Disease Control and Prevention.
Dr. Maenner served as the statistical expert for this research.
Footnotes
Disclosure: Drs. Shaw, Hughes, Bakian, Lee, Pettygrove, Maenner, and Ms. McArthur have reported no biomedical financial interests or potential conflicts of interest.
Contributor Information
Kelly A. Shaw, National Center on Birth Defects and Developmental Disabilities, Centers for Disease Control and Prevention, Atlanta, Georgia..
Dedria McArthur, National Center on Birth Defects and Developmental Disabilities, Centers for Disease Control and Prevention, Atlanta, Georgia..
Michelle M. Hughes, National Center on Birth Defects and Developmental Disabilities, Centers for Disease Control and Prevention, Atlanta, Georgia..
Amanda V. Bakian, University of Utah, Salt Lake City..
Li-Ching Lee, Johns Hopkins University, Baltimore, Maryland..
Sydney Pettygrove, University of Arizona, Tucson..
Matthew J. Maenner, National Center on Birth Defects and Developmental Disabilities, Centers for Disease Control and Prevention, Atlanta, Georgia..
REFERENCES
- 1.American Psychiatric Association. Diagnostic and Statistical Manual of Mental Disorders, 5th ed. (DSM-5). Arlington, VA: American Psychiatric Publishing; 2013. [Google Scholar]
- 2.Johnson CP, Myers SM. American Academy of Pediatrics Council on Children With Disabilities. Identification and evaluation of children with autism spectrum disorders. Pediatrics. 2007;120:1183–1215. 10.1542/peds.2007-2361. [DOI] [PubMed] [Google Scholar]
- 3.Hyman SL, Levy SE, Myers SM, et al. Identification, evaluation, and management of children with autism spectrum disorder. Pediatrics. 2020;45(1):e20193447. 10.1542/peds.2019-3447. [DOI] [PubMed] [Google Scholar]
- 4.Zwaigenbaum L, Bauman ML, Choueiri R, et al. Early intervention for children with autism spectrum disorder under 3 years of age: recommendations for practice and research. Pediatrics. 2015;136(Suppl 1):S60–S81. 10.1542/peds.2014-3667E. [DOI] [PMC free article] [PubMed] [Google Scholar]
- 5.Autism and Developmental Disabilities Monitoring Network Surveillance Year 2000 Principal Investigators, Centers for Disease Control and Prevention. Prevalence of autism spectrum disorders–Autism and Developmental Disabilities Monitoring Network, six sites, United States, 2000. MMWR Surveill Summ. 2007;56:1–11. [PubMed] [Google Scholar]
- 6.Maenner MJ. Prevalence of autism spectrum disorder among children aged 8 years–ADDM Network, 11 sites, United States, 2016. MMWR Surveill Summ. 2018;67:1–23. [DOI] [PMC free article] [PubMed] [Google Scholar]
- 7.Carbone PS, Campbell K, Wilkes J, et al. Primary care autism screening and later autism diagnosis. Pediatrics. 2020;146:e20192314. [DOI] [PMC free article] [PubMed] [Google Scholar]
- 8.Shattuck PT, Durkin M, Maenner M, et al. Timing of identification among children with an autism spectrum disorder: findings from a population-based surveillance study. J Am Acad Child Adolesc Psychiatry. 2009;48:474–483. 10.1097/CHI.0b013e31819b3848. [DOI] [PMC free article] [PubMed] [Google Scholar]
- 9.Sheldrick RC, Maye MP, Carter AS. Age at first identification of autism spectrum disorder: an analysis of two US surveys. J Am Acad Child Adolesc Psychiatry. 2017;56: 313–320. 10.1016/j.jaac.2017.01.012. [DOI] [PMC free article] [PubMed] [Google Scholar]
- 10.Maenner MJ, Schieve LA, Rice CE, et al. Frequency and pattern of documented diagnostic features and the age of autism identification. J Am Acad Child Adolesc Psychiatry. 2013;52:401–413. e8. 10.1016/j.jaac.2013.01.014. [DOI] [PMC free article] [PubMed] [Google Scholar]
- 11.Stewart L, Baio J, Rosenberg S, et al. Timing of Autism Spectrum Disorder Identification in the U.S. from the Autism and Developmental Disabilities Monitoring Network 2006–2012. Poster presented at: International Society for Autism Research; May 4, 2019; Montreal, Canada. [Google Scholar]
- 12.Schendel DE, Thorsteinsson E. Cumulative incidence of autism into adulthood for birth cohorts in Denmark, 1980–2012. JAMA. 2018;320:1811–1813. 10.1001/jama.2018.11328. [DOI] [PMC free article] [PubMed] [Google Scholar]
- 13.Hertz-Picciotto I, Delwiche L. The rise in autism and the role of age at diagnosis. Epidemiology. 2009;20:84–90. 10.1097/EDE.0b013e3181902d15. [DOI] [PMC free article] [PubMed] [Google Scholar]
- 14.Shaw KA, Maenner MJ, Baio J, et al. Early identification of autism spectrum disorder among children aged 4 years — early autism and developmental disabilities monitoring network, six sites, United States, 2016. MMWR Surveill Summ. 2020;69:1–11. [DOI] [PMC free article] [PubMed] [Google Scholar]
- 15.Autism and Developmental Disabilities Monitoring Network Surveillance Year 2002 Principal Investigators, Centers for Disease Control and Prevention. Prevalence of autism spectrum disorders–Autism and Developmental Disabilities Monitoring Network, 14 sites, United States, 2002. MMWR Surveill Summ. 2007;56:12–28. [PubMed] [Google Scholar]
- 16.Autism and Developmental Disabilities Monitoring Network Surveillance Year 2006 Principal Investigators, Centers for Disease Control and Prevention (CDC). Prevalence of autism spectrum disorders–Autism and Developmental Disabilities Monitoring Network, United States, 2006. MMWR Surveill Summ. 2009;58:1–20. [PubMed] [Google Scholar]
- 17.Autism and Developmental Disabilities Monitoring Network Surveillance Year 2008 Principal Investigators, Centers for Disease Control and Prevention. Prevalence of autism spectrum disorders–Autism and Developmental Disabilities Monitoring Network, 14 sites, United States, 2008. MMWR Surveill Summ. 2012;61:1–19. [PubMed] [Google Scholar]
- 18.Developmental Disabilities Monitoring Network Surveillance Year 2010 Principal Investigators, Centers for Disease Control and Prevention (CDC). Prevalence of autism spectrum disorder among children aged 8 years–Autism and Developmental Disabilities Monitoring Network, 11 sites, United States, 2010. MMWR Surveill Summ. 2014; 63:1–21. [PubMed] [Google Scholar]
- 19.Christensen DL, Baio J, Van Naarden Braun K, et al. Prevalence and characteristics of autism spectrum disorder among children aged 8 years–Autism and Developmental Disabilities Monitoring Network, 11 sites, United States, 2012. MMWR Surveill Summ. 2016;65:1–23. 10.15585/mmwr.ss6503a1. [DOI] [PMC free article] [PubMed] [Google Scholar]
- 20.Baio J, Wiggins L, Christensen DL, et al. Prevalence of autism spectrum disorder among children aged 8 years–Autism and Developmental Disabilities Monitoring Network, 11 sites, United States, 2014. MMWR Surveill Summ. 2018;67:1–23. 10.15585/mmwr.ss6706a1. [DOI] [PMC free article] [PubMed] [Google Scholar]
- 21.Therneau TM. A Package for Survival Analysis in S. 2015; https://CRAN.R-project.org/package=survival. Accessed April 20, 2021. [Google Scholar]
- 22.Therneau TM, Grambsch PM. Modeling Survival Data: Extending the Cox Model. New York: Springer; 2000. [Google Scholar]
- 23.Mangiafico S. Rcompanion: Functions to Support Extension Education Program Evaluation. 2020; https://CRAN.R-project.org/package=rcompanion. Accessed April 20, 2021.
- 24.Harrell FE Jr. Hmisc: Harrell Miscellaneous; 2019; https://CRAN.R-project.org/package=Hmisc. Accessed April 20, 2021.
- 25.Stevenson M EpiR: Tools for the Analysis of Epidemiological Data; https://CRAN.R-project.org/package=epiR. Accessed April 20, 2021.
- 26.Scherer R. PropCIs: Various Confidence Interval Methods for Proportions; 2018; https://CRAN.R-project.org/package=PropCIs. Accessed April 20, 2021.
- 27.Maenner MJ, Graves SJ, Peacock G, Honein MA, Boyle CA, Dietz PM. Comparison of 2 case definitions for ascertaining the prevalence of autism spectrum disorder among 8-year-old children. Am J Epidemiol. 2021;190:2198–2207. [DOI] [PMC free article] [PubMed] [Google Scholar]
- 28.Hosozawa M, Sacker A, Mandy W, Midouhas E, Flouri E, Cable N. Determinants of an autism spectrum disorder diagnosis in childhood and adolescence: evidence from the UK Millennium Cohort Study. Autism. 2020;24:1557–1565. 10.1177/1362361320913671. [DOI] [PMC free article] [PubMed] [Google Scholar]
- 29.Durkin MS, Maenner MJ, Baio J, et al. Autism spectrum disorder among US children (2002–2010): socioeconomic, racial, and ethnic disparities. Am J Public Health. 2017; 107:1818–1826. 10.2105/AJPH.2017.304032. [DOI] [PMC free article] [PubMed] [Google Scholar]
- 30.Smith KA, Gehricke J-G, Iadarola S, Wolfe A, Kuhlthau KA. Disparities in service use among children with autism: a systematic review. Pediatrics. 2020;145(Suppl 1): S35–S46. 10.1542/peds.2019-1895G. [DOI] [PubMed] [Google Scholar]
- 31.Patrick ME, Shaw KA, Dietz PM, et al. Prevalence of intellectual disability among eight-year-old children from selected communities in the United States, 2014, Disabil Health J, Volume 14, Issue 2, 2021, 101023, ISSN 1936–6574, 10.1016/j.dhjo.2020.101023. [DOI] [PMC free article] [PubMed] [Google Scholar]
- 32.Lorch SA, Enlow E. The role of social determinants in explaining racial/ethnic disparities in perinatal outcomes. Pediatr Res. 2016;79:141–147. 10.1038/pr.2015.199. [DOI] [PMC free article] [PubMed] [Google Scholar]
- 33.Martin JA, Hamilton BE, Osterman MJK, Driscoll AK. Births: final data for 2018. National Vital Statistics Reports. 2019;68; cdc.gov/nchs/data/nvsr/nvsr68/nvsr68_130508.pdf. [PubMed] [Google Scholar]
- 34.Mackay DF, Smith GCS, Dobbie R, Cooper S-A, Pell JP. Obstetric factors and different causes of special educational need: retrospective cohort study of 407,503 schoolchildren. BJOG. 2013;120:297–307. discussion 307–308. doi: 10.1111/1471-0528.12071. [DOI] [PubMed] [Google Scholar]
- 35.Aarnoudse-Moens CSH, Weisglas-Kuperus N, van Goudoever JB, Oosterlaan J. Meta-analysis of neurobehavioral outcomes in very preterm and/or very low birth weight children. Pediatrics. 2009;124:717–728. 10.1542/peds.2008-2816. [DOI] [PubMed] [Google Scholar]
- 36.Imm P, White T, Durkin MS. Assessment of racial and ethnic bias in autism spectrum disorder prevalence estimates from a US surveillance system. Autism. 2019;23:1927–1935. 10.1177/1362361319827510. [DOI] [PMC free article] [PubMed] [Google Scholar]
- 37.Lipkin PH, Macias MM, Baer Chen B, et al. Trends in pediatricians’ developmental screening: 2002–2016. Pediatrics. 2020;145. 10.1542/peds.2019-0851. [DOI] [PubMed] [Google Scholar]
- 38.U.S. Department of Health and Human Services, Office of Disease Prevention and Health Promotion. Healthy People 2030. Accessed September 29, 2020; https://health.gov/healthypeople/objectives-and-data/browse-objectives/children. [Google Scholar]
- 39.Sheldrick RC, Carter AS. State-level trends in the prevalence of autism spectrum disorder (ASD) from 2000 to 2012: a reanalysis of findings from the Autism and Developmental Disabilities Network. J Autism Dev Disord. 2018;48:3086–3092. 10.1007/s10803-018-3568-z. [DOI] [PMC free article] [PubMed] [Google Scholar]
Associated Data
This section collects any data citations, data availability statements, or supplementary materials included in this article.