

Abstract
Rationale
During the first wave of the coronavirus disease (COVID-19) pandemic in New York City, the number of mechanically ventilated COVID-19 patients rapidly surpassed the capacity of traditional intensive care units (ICUs), resulting in health systems utilizing other areas as expanded ICUs to provide critical care.
Objectives
To evaluate the mortality of patients admitted to expanded ICUs compared with those admitted to traditional ICUs.
Methods
Multicenter, retrospective, cohort study of mechanically ventilated patients with COVID-19 admitted to the ICUs at 11 Northwell Health hospitals in the greater New York City area between March 1, 2020 and April 30, 2020. Primary outcome was in-hospital mortality up to 28 days after intubation of COVID-19 patients.
Results
Among 1,966 mechanically ventilated patients with COVID-19, 1,198 (61%) died within 28 days after intubation, 46 (2%) were transferred to other hospitals outside of the Northwell Health system, 722 (37%) survived in the hospital until 28 days or were discharged after recovery. The risk of mortality of mechanically ventilated patients admitted to expanded ICUs was not different from those admitted to traditional ICUs (hazard ratio [HR], 1.07; 95% confidence interval [CI], 0.95–1.20; P = 0.28), while hospital occupancy for critically ill patients itself was associated with increased risk of mortality (HR, 1.28; 95% CI, 1.12–1.45; P < 0.001).
Conclusions
Although increased hospital occupancy for critically ill patients itself was associated with increased mortality, the risk of 28-day in-hospital mortality of mechanically ventilated patients with COVID-19 who were admitted to expanded ICUs was not different from those admitted to traditional ICUs.
Keywords: mechanically ventilated COVID-19 patients, traditional ICU, expanded ICU, COVID pandemic, hospital occupancy for critically ill patients
Since December 2019, coronavirus disease (COVID-19) rapidly spread worldwide and was designated as a global pandemic by March 2020 by the World Health Organization (1). The United States surpassed all other countries in total cases of COVID-19 patients (>30 million) and deaths (>550,000) (2). New York had the estimated highest initial incidence rates of COVID-19 in the United States (3).
Northwell Health is the largest health system in New York (with 23 hospitals and nearly 800 outpatient facilities), serving approximately 11 million people each year. Northwell Health treated many severe cases of COVID-19 patients requiring mechanical ventilation during the first wave of the pandemic (March to April 2020), with our original intensive care unit (ICU) capacity unable to meet the demand for beds (4). To respond to the rapidly escalating number of critical patients, we expanded ICU capacity by converting non-ICU spaces such as post-procedure short stay wards, post-anesthesia recovery areas, and in some instances, general wards, into ICUs, referred to hereafter as “expanded ICUs” (5–7).
Several previous studies have demonstrated the association between ICU crowding with increased mortality in patients with non-COVID-19 illnesses (8–10), and more recently, COVID-19 illness (11, 12). Although not limited to ICU patients, a national database covering approximately 20% of overall hospitalization in the United States also showed an association between surges in hospital COVID-19 caseload and worse outcomes (13). Furthermore, evidence from nonpandemic related hospital crowdedness suggests increased mortality and worse outcomes when patients requiring ICUs were located in nonspecialty ICUs (14), in ICUs with furthest geographic distance from native specialty ICU (15), or, more recently, in critically ill patients awaiting an ICU bed in the emergency department (16). Although the experiences regarding utilization of expanded ICUs during the early phase of the pandemic have been described (17–19), the outcomes of patients admitted to these expanded ICUs have not been previously evaluated and require analysis using a large cohort of COVID-19 patients. Therefore, the aim of this study was to compare the 28-day in-hospital mortality after intubation of COVID-19 patients admitted to expanded ICUs in comparison with those admitted to traditional ICUs.
Methods
Study Design and Population
The Northwell Health Institutional Review Board approved this study as minimal-risk research using data collected for routine clinical practice and waived the requirement for informed consent. The study includes all mechanically ventilated patients (18 years or older) with confirmed severe acute respiratory syndrome coronavirus 2 (SARS-CoV-2) infection between March 1, 2020 and April 30, 2020. COVID-19 infection was confirmed by a positive result on polymerase chain reaction testing of a respiratory sample. Patients were admitted to one of 11 Northwell Health hospitals that all have established ICUs in New York City, Suffolk County, or Nassau County, which all comprise the greater New York City area. Clinical outcomes were available through May 31, 2020.
Patients were excluded if they were younger than 18 years old at the time of admission, transferred to the Northwell Health system from outside hospitals after intubation, or were placed on extracorporeal membrane oxygenation (ECMO). We also excluded patients who had do-not-resuscitate (DNR) orders initiated shortly after intubation (within 24 h) because we assumed the decision for their DNR was mainly due to factors other than assigned ICU type (expanded or traditional).
Data Collection
Data were collected from the Enterprise Electronic Health Record (EHR; Sunrise Clinical Manager; Allscripts) reporting database. Manual chart reviews were conducted by research staff and medical students trained by the principal investigators. Data collected included patient demographic information, comorbidities, assigned ICU type after intubation, laboratory test results, diagnoses during the hospital course, and outcomes (28-day in-hospital mortality after intubation). The assigned ICU type after intubation was defined as the initial place where patients stayed for more than 24 hours after intubation. Simplified Acute Physiology Score II was calculated at the time of ICU admission as a measure of illness severity (20). Race was self-reported in prespecified fixed categories in the EHR. Hospital transfers within Northwell Health were merged and considered as a single visit. Information regarding total beds of traditional ICUs was also extracted from the EHR. We counted the number of ICU beds that had been used at least one time during the last year before the pandemic (from January 2019 to December 2019) as total traditional ICU beds.
Outcomes
The primary outcome measured was in-hospital mortality up to 28 days after intubation between the patients in traditional versus expanded ICUs.
Traditional ICU and Expanded ICU
Traditional ICUs were classified as those locations that were already designated as ICUs before the pandemic. The traditional ICUs include surgical ICUs, medical ICUs, and cardiac care units and any departments that had been given ICU/cardiac care unit “care level” designations based on EHR assignments. Expanded ICUs were the departments/wards that were converted into ICUs during the pandemic, which included any physical pediatric or neonatal ICU spaces used to treat intubated adult COVID-19 patients, as the staffing and patient characteristics differed largely from its traditional uses. “Care levels” describe the services provided at any hospital in the Northwell Health system, categorized as ICU/cardiac care unit, step-down units, private patient rooms, and semiprivate patient rooms.
The differences in characteristics between traditional and expanded ICUs are summarized in Table 1. Regardless of traditional or expanded ICU, patients were cared for by board-certified physicians specializing in critical care or cardiology with additional support from general hospitalists. The nurse-to-patient ratio was always maintained at 1:2 in both the expanded and traditional ICUs, with the consideration that the expanded ICUs achieved this ratio either by relocating nurses from the same department or other non-ICU wards or with the allocation of travel nurses. In contrast, traditional ICUs had nursing staff that was predominantly comprised of those who originally worked in the respective ICU.
Table 1.
Difference in characteristics of traditional and expanded intensive care units
| Traditional ICUs | Expanded ICUs | |
|---|---|---|
| Original | ICUs | General wards or ICUs not for adult mechanically ventilated patients |
| Total number of departments during time interval of study | 35 | 92 |
| Total number of patients during study time interval | 1,067 | 899 |
| ICU type | Closed ICU system | |
| Assigned physicians | Residents and fellows supervised physicians in critical care or cardiology department | |
| Nurse to patient ratio | 1:2 for 24 h | |
| Predominant assignment of nurses | Nurses traditionally working in ICUs | Nurses who do not often work in ICUs |
| Proportion (%) of mechanically ventilated patients among total admitted patients in December 2019 in each department* | 35 | 1 |
| Max ICU capacity | Limited (fixed number) | Flexible (up to the max capacity of the general ward) |
Definition of abbreviations: COVID-19 = coronavirus disease 2019; ICU = intensive care unit.
It was used as a surrogate for experience with treating mechanically ventilated patients before the coronavirus disease 2019 (COVID-19) pandemic.
Due to the increased patient volume and variable severity, as is typical for severe COVID-19, many wards were converted into expanded ICUs despite seldomly treating mechanically ventilated patients before the beginning of the pandemic. Before the pandemic in December 2019, the incidence of mechanical ventilation was approximately 35% in our traditional ICUs. However, during the first wave, the incidence of mechanical ventilation was approximately 100% in traditional ICUs as well as in the departments that would become our future expanded ICUs.
Measurement of Hospital Occupancy for Critically Ill Patients
We measured hospital occupancy for critically ill patients on each day at each hospital:
For a given patient, the hospital occupancy for critically ill patients corresponded to the date of intubation. For example, if there were 20 mechanically ventilated COVID-19 patients in all ICUs at Lenox Hill hospital on March 5 with a traditional ICU capacity of 48, hospital occupancy for critically ill patients would be 20 divided by 48, or 0.42.
With increased patient volumes exceeding traditional ICU capacity, expanded ICUs began accommodating for this increasing number of intubated COVID-19 patients (Table 1), which represents a hospital occupancy for critically ill patients approximating to 1.0. Therefore, we defined the value of 1.0 as the cutoff point for the hospital occupancy of critically ill patients to determine days when occupancy exceeded 1.0.
Statistical Analysis
Chi-square and Mann-Whitney U tests were used to compare baseline categorical and continuous variables, respectively. The primary endpoint was in-hospital survival through Day 28, and the comparison of interest was ICU type: traditional versus expanded ICU. Survival times (number of days from ventilation until death or last follow-up) were considered to be uncensored if the patient died in the hospital on Day 28 or earlier. Survival times were considered to be censored at the date of hospital discharge, the date of transfer, or Day 28, whichever came first. Unadjusted and adjusted Cox proportional hazard (PH) regression analyses were performed to evaluate the risk of in-hospital mortality through Day 28 comparing ICU types. Kaplan-Meier survival curves were plotted for both unadjusted and adjusted models. In the adjusted models, we included several adjustment variables. In addition to information regarding basic demographics and comorbidities (age, gender, body mass index, and past medical histories of hypertension, diabetes, chronic heart disease, and chronic lung disease), we used the variables of hospital occupancy and patient’s severity as adjustment factors, since both of these variables were known to be associated with mortality of mechanically ventilated patients with COVID-19 (11, 21). Hospital occupancy for critically ill patients was measured as described above, while patients’ severity was estimated by using Simplified Acute Physiology Score II. Time from the start of respiratory symptoms until intubation was included as a covariate. The variable of “admitted hospital” (the hospital in which the patient was treated) was also used as a random effect in the analysis but did not appreciably alter the results; therefore, for simplicity, the final model did not include “admitted hospital”. The analysis, including a random effect, is shown in Tables E1 and E2 in the online supplement. The validity of the Cox model PH assumption for categorical covariates was assessed by visualizing graphs of the Kaplan-Meier estimates of the survival function as well as tests of the PH assumption using PROC PHREG (SAS Institute). Accordingly, time-dependent covariates for the variables of “time from symptoms until intubation” and “chronic lung disease” were included in the model because the PH assumptions were not met. Once again, since the inclusion of these time-dependent covariates did not appreciably alter the results, they were omitted from the final model. A sensitivity analysis using each patient’s actual time from intubation until hospital discharge (i.e., not censoring all times greater than 28 d) was performed using the Cox model. In this model, 15.6% (306/1,966) were additionally censored because they were still in the hospital by May 31, the date of final follow-up. Adjusted hazard ratio (HR), 95% confidence interval (CI), and two-tailed P values are reported. P < 0.05 was regarded as denoting a statistically significant result. All analyses were conducted using the SAS software, version 9.4 (SAS Institute, Cary, NC) and R Studio version 4.0.3.
Results
The change in the number of new intubated COVID-19 patients admitted to our health system and the total number of these patients in ICUs during the first wave of the pandemic are shown in Figure 1. After the first COVID-19 patient was intubated on March 2, the number of intubated patients rapidly increased, and more than 70 patients were intubated per day in our health system during the peak of the first wave (Figure 1A). In the earlier phase, mechanically ventilated COVID-19 patients were admitted primarily to traditional ICUs, but as traditional ICU capacity became saturated, the usage of expanded ICUs increased (Figure 1B). The change in the number of mechanically ventilated patients in ICUs from March 1 to April 30 admitted to traditional and expanded ICUs per each hospital is shown in Figure E1.
Figure 1.
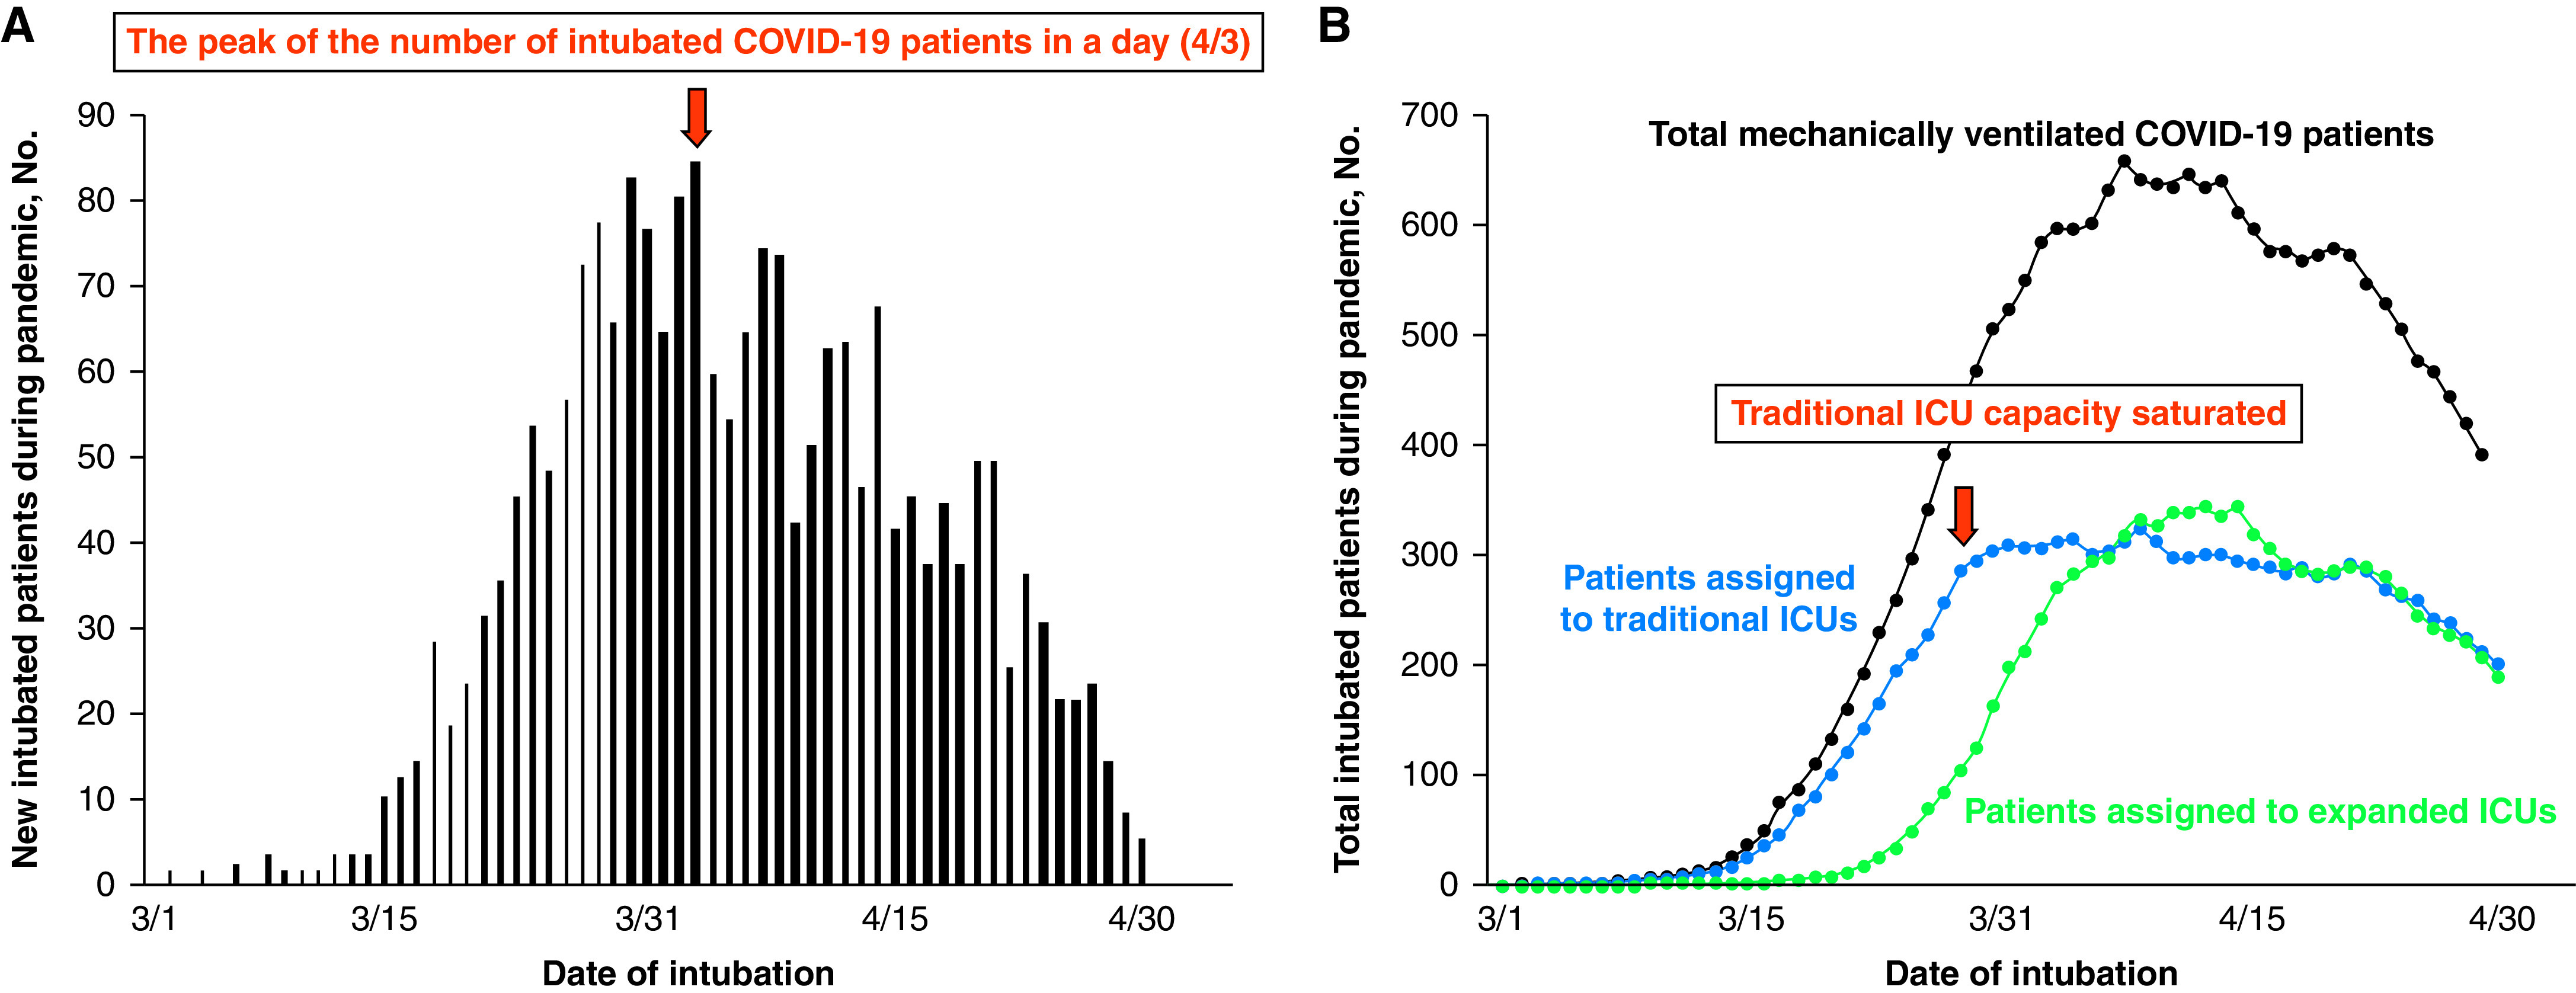
Change in the number of mechanically ventilated patients during the first wave of the COVID-19 pandemic in New York City. (A) Daily change in the number of intubated patients from March 1 to April 30. The maximum number was 84 on April 3. (B) Change in the number of mechanically ventilated patients in intensive care units (ICUs) from March 1 to April 30. The black line represents the number of patients in all ICUs, the blue line represents the number of patients in traditional ICUs, and the green line represents the number of patients in expanded ICUs. In the early phase of the pandemic, intubated COVID-19 patients were admitted primarily to traditional ICUs, but as traditional ICU capacity became saturated, the usage of expanded ICUs increased. COVID-19 = coronavirus disease 2019.
A total of 2,145 adult mechanically ventilated patients with COVID-19 admitted to 11 hospitals within the Northwell Health system were included. Among them, a total of 179 were excluded because they were under 18 years old (n = 13), transferred from hospitals outside of the Northwell Health system after intubation (n = 5), placed on ECMO (n = 11), or had DNR orders initiated within 24 hours after intubation (n = 150). From the remaining 1,966 patients, 1,067 (54.3%) were assigned to traditional ICUs and 899 (45.7%) to expanded ICUs, respectively, which were analyzed in this study (Figure 2). Characteristics of analyzed patients, such as age, sex, race, comorbidities, and illness severity at the time of ICU admission, are shown in Table 2.
Figure 2.

Flow diagram of patients. COVID-19 = coronavirus disease 2019; DNR = do-not-resuscitate; ECMO = extracorporeal membrane oxygenation; ICU = intensive care unit; NH = Northwell Health system.
Table 2.
Baseline characteristics of all subjects
| Traditional ICU (n = 1,067), n (%) | Expanded ICU (n = 899), n (%) | P Value | |
|---|---|---|---|
| Age (yr) | 0.53 | ||
| <65 | 540 (50.6) | 426 (47.4) | |
| ⩾65–<74 | 295 (27.6) | 263 (29.3) | |
| ⩾75–<84 | 190 (17.8) | 175 (19.5) | |
| ⩾85 | 42 (3.9) | 35 (3.9) | |
| Sex, male | 709 (66.4) | 622 (69.2) | 0.20 |
| Race | 0.48 | ||
| Asian | 113 (10.6) | 79 (8.8) | |
| Black | 195 (18.3) | 166 (18.5) | |
| White | 368 (34.5) | 331 (36.8) | |
| Other/multiracial | 335 (31.4) | 285 (31.7) | |
| Unknown | 56 (5.3) | 38 (4.2) | |
| Insurance | 0.65 | ||
| Commercial | 337 (31.6) | 265 (29.5) | |
| Medicaid | 223 (20.9) | 211 (23.5) | |
| Medicare | 474 (44.4) | 393 (43.7) | |
| Other/self pay | 33 (3.1) | 30 (3.3) | |
| BMI | <0.001 | ||
| <30 | 533 (50.0) | 426 (47.4) | |
| ⩾30 (obesity) | 481 (45.1) | 368 (40.9) | |
| Missing data | 53 (5.0) | 105 (11.7) | |
| Past medical history | |||
| Hypertension | 680 (63.7) | 521 (58.0) | 0.009 |
| Diabetes | 452 (42.4) | 366 (40.7) | 0.46 |
| Chronic heart disease | 142 (13.3) | 110 (12.2) | 0.48 |
| Chronic lung disease | 44 (4.1) | 37 (4.1) | >0.99 |
| After-hours intubation (17:00–9:00) | 421 (39.5) | 373 (41.5) | 0.36 |
| Time from starting respiratory symptom until intubation (d)* | 0.22 | ||
| <5 | 206 (19.3) | 142 (15.8) | |
| ⩾5–<8 | 213 (20.0) | 170 (18.9) | |
| ⩾8–<14 | 295 (27.6) | 257 (28.6) | |
| ⩾14 | 238 (22.3) | 221 (24.6) | |
| Missing data | 115 (10.8) | 109 (12.1) | |
| SAPS II at ICU admission* | 0.01 | ||
| <50 | 225 (21.1) | 169 (18.8) | |
| ⩾50–<60 | 241 (22.6) | 208 (23.1) | |
| ⩾60–<70 | 238 (22.3) | 224 (24.9) | |
| ⩾70 | 250 (23.4) | 239 (26.6) | |
| Missing data | 113 (10.6) | 59 (6.6) |
Definition of abbreviations: BMI = body mass index; ICU = intensive care unit; SAPS II = Simplified Acute Physiology Score II.
We categorized these variables by quantile.
In the survival analysis up to 28 days after intubation, the average duration of follow-up on the surviving patients and deceased patients are 21.6 days (±8.5 d) and 9.3 days (±7.2 d), respectively. In-hospital mortality at 28 days was 57% (613/1,067) and 65% (585/899) in traditional and expanded ICUs, respectively. Kaplan-Meier curves were plotted for the patients admitted to traditional and expanded ICUs. The log-rank test as an unadjusted analysis showed that the mortality in expanded ICUs was greater than that in traditional ICUs (P = 0.001) (Figure 3A). Using an adjusted Cox proportional hazard regression analysis, the risk of mortality among patients admitted to expanded ICUs was observed not to be different from that of patients admitted to traditional ICUs (HR, 1.07; 95% CI, 0.95–1.20; P = 0.28) (Figure 3B). The mortality among patients who were intubated when the hospital occupancy for critically ill patients was greater than 1.0 was 28% greater than that of patients who were intubated when the hospital occupancy for critically ill patients was less than 1.0 (HR, 1.28; 95% CI, 1.12–1.45; P < 0.001) (Table 3).
Figure 3.

Survival curves of the patients admitted to traditional and expanded intensive care units (ICUs). (A) Unadjusted Kaplan-Meier survival curves and (B) adjusted survival curves of mechanically ventilated COVID-19 patients in expanded ICUs compared with those in traditional ICUs. The P value was calculated using the (A) log-rank test and (B) proportional hazard regression analysis, respectively. COVID-19 = coronavirus disease 2019.
Table 3.
Proportional hazard regression results from intubation to 28-day in-hospital mortality
| Unadjusted* HR (95% CI) | P Value | Adjusted HR (95% CI) | P Value | |
|---|---|---|---|---|
| Overcrowded ICU | 1.43 (1.27–1.62) | <0.001 | 1.28 (1.12–1.45) | <0.001 |
| Expanded ICU | 1.21 (1.08–1.35) | 0.001 | 1.07 (0.95–1.20) | 0.28 |
| Age (yr) | ||||
| <65 | 1 [Reference] | 1 [Reference] | ||
| ⩾65–<74 | 1.35 (1.18–1.54) | <0.001 | 1.28 (1.11–1.47) | <0.001 |
| ⩾75–<84 | 1.52 (1.30–1.76) | <0.001 | 1.33 (1.13–1.56) | <0.001 |
| ⩾85 | 2.61 (2.03–3.37) | <0.001 | 2.20 (1.68–2.89) | <0.001 |
| Female | 0.90 (0.80–1.02) | 0.11 | 0.87 (0.77–0.99) | 0.04 |
| BMI | ||||
| <30 | 1 [Reference] | 1 [Reference] | ||
| ⩾30 (obesity) | 0.88 (0.78–1.00) | 0.03 | 0.98 (0.86–1.11) | 0.73 |
| Missing data | 2.36 (1.95–2.87) | <0.001 | 2.50 (2.05–3.05) | <0.001 |
| Hypertension | 1.18 (1.05–1.33) | 0.005 | 1.08 (0.95–1.22) | 0.26 |
| Diabetes | 1.13 (1.01–1.27) | 0.04 | 1.11 (0.98–1.25) | 0.09 |
| Chronic heart disease | 1.46 (1.25–1.71) | <0.001 | 1.28 (1.09–1.51) | <0.001 |
| Chronic lung disease | 1.33 (1.01–1.74) | 0.04 | 1.29 (0.97–1.70) | 0.08 |
| Time from admission until intubation (d) | ||||
| <5 | 1 [Reference] | 1 [Reference] | ||
| ⩾5–<8 | 0.84 (0.69–1.03) | 0.09 | 0.88 (0.72–1.07) | 0.19 |
| ⩾8–<14 | 0.94 (0.79–1.13) | 0.53 | 1.03 (0.86–1.24) | 0.71 |
| ⩾14 | 1.17 (0.98–1.40) | 0.08 | 1.26 (1.05–1.52) | 0.01 |
| Missing data | 1.79 (1.46–2.21) | <0.001 | 1.79 (1.45–2.21) | <0.001 |
| SAPS II, score points | ||||
| <50 | 1 [Reference] | 1 [Reference] | ||
| ⩾50–<60 | 1.24 (1.03–1.48) | 0.02 | 1.17 (0.97–1.41) | 0.10 |
| ⩾60–<70 | 1.17 (0.97–1.41) | 0.09 | 1.21 (1.01–1.46) | 0.04 |
| ⩾70 | 1.52 (1.27–1.81) | <0.001 | 1.47 (1.22–1.75) | <0.001 |
| Missing data | 1.83 (1.46–2.29) | <0.001 | 1.65 (1.32–2.07) | <0.001 |
Definition of abbreviations: BMI = body mass index; CI = confidence interval; HR = hazard ratio; ICU = intensive care unit; SAPS II = Simplified Acute Physiology Score II.
Unadjusted model considers one variable of the model at a time.
For sensitivity analysis, we evaluated in-hospital mortality until hospital discharge. For this analysis, 15.6% (306/1,966 patients) were additionally censored because they were still in the hospital at the date of final follow-up. The average duration of follow-up on the surviving patients at their discharge and deceased patients are 32.3 days (±21.5 d) and 11.8 days (±11.4 d), respectively. The results were similar to the survival analysis up to 28 days, which is no significant difference in mortality of patients admitted to expanded ICUs versus traditional ICUs (HR, 1.04; 95% CI, 0.93–1.17; P = 0.49) with increased risk of mortality with hospital occupancy for critically ill patients (HR, 1.27; 95% CI, 1.12–1.44; P < 0.001) (Table 4). We also evaluated the mortality considering the influence of admitted hospital as a random effect and confirmed that it did not appreciably alter the results (Tables E1 and E2).
Table 4.
Sensitivity analysis with in-hospital mortality from intubation to hospital discharge
| Unadjusted* HR (95% CI) | P Value | Adjusted HR (95% CI) | P Value | |
|---|---|---|---|---|
| Overcrowded ICU | 1.43 (1.27–1.61) | <0.001 | 1.27 (1.12–1.44) | <0.001 |
| Expanded ICU | 1.20 (1.08–1.34) | <0.001 | 1.04 (0.93–1.17) | 0.49 |
| Age (yr) | ||||
| <65 | 1 [Reference] | 1 [Reference] | ||
| ⩾65–<74 | 1.36 (1.19–1.55) | <0.001 | 1.26 (1.10–1.44) | <0.001 |
| ⩾75–<84 | 1.42 (1.23–1.64) | <0.001 | 1.36 (1.16–1.59) | <0.001 |
| ⩾85 | 2.59 (2.02–3.32) | <0.001 | 2.34 (1.79–3.04) | <0.001 |
| Female | 0.90 (0.80–1.02) | 0.10 | 0.84 (0.74–0.95) | 0.006 |
| BMI | ||||
| <30 | 1 [Reference] | 1 [Reference] | ||
| ⩾30 (obesity) | 0.88 (0.79–0.99) | 0.03 | 0.98 (0.87–1.10) | 0.73 |
| Missing data | 2.31 (1.91–2.29) | <0.001 | 2.39 (1.97–2.91) | <0.001 |
| Hypertension | 1.15 (1.02–1.28) | 0.02 | 1.07 (0.95–1.21) | 0.29 |
| Diabetes | 1.13 (1.02–1.27) | 0.03 | 1.10 (0.98–1.23) | 0.13 |
| Chronic heart disease | 1.39 (1.20–1.62) | <0.001 | 1.26 (1.08–1.48) | 0.005 |
| Chronic lung disease | 1.26 (0.96–1.63) | 0.10 | 1.23 (0.94–1.62) | 0.14 |
| Time from admission until intubation (d) | ||||
| <5 | 1 [Reference] | 1 [Reference] | ||
| ⩾5–<8 | 0.85 (0.70–1.02) | 0.08 | 0.88 (0.73–1.06) | 0.18 |
| ⩾8–<14 | 0.97 (0.82–1.15) | 0.70 | 1.06 (0.89–1.26) | 0.51 |
| ⩾14 | 1.19 (1.00–1.41) | 0.04 | 1.27 (1.06–1.51) | 0.01 |
| Missing data | 1.77 (1.45–2.16) | <0.001 | 1.78 (1.45–2.19) | <0.001 |
| SAPS II, score points | ||||
| <50 | 1 [Reference] | 1 [Reference] | ||
| ⩾50–<60 | 1.16 (0.97–1.38) | 0.10 | 1.13 (0.95–1.35) | 0.17 |
| ⩾60–<70 | 1.20 (1.01–1.43) | 0.04 | 1.18 (0.99–1.40) | 0.07 |
| ⩾70 | 1.48 (1.25–1.74) | <0.001 | 1.37 (1.16–1.63) | <0.001 |
| Missing data | 1.61 (1.30–2.01) | <0.001 | 1.52 (1.22–1.90) | <0.001 |
Definition of abbreviations: BMI = body mass index; CI = confidence interval; HR = hazard ratio; ICU = intensive care unit; SAPS II = Simplified Acute Physiology Score II.
Unadjusted model considers one variable of the model at a time.
Discussion
In this multicenter, retrospective, cohort study of mechanically ventilated patients with confirmed COVID-19 infection during the first wave of the pandemic in New York City, we have shown that the risk of 28-day in-hospital mortality after intubation of the patients with COVID-19 admitted to expanded ICUs was not different from that of patients admitted to traditional ICUs. However, exceeding the hospital capacity for critically ill COVID-19 patients was associated with higher mortality, which was consistent with the results of previous studies (11, 12).
The observed increased mortality during hospital ICU occupancy over 1.0, along with comparable mortality outcomes in expanded versus traditional ICUs, are significant findings regarding management during the pandemic. First, the higher mortality during times of crisis due to utilization of scarce resources such as ICU staff and beds is consistent with prior literature (6) and the experience of clinicians. This can be due to higher levels of care required, the complexity of disease processes, and/or the unfamiliarity of clinicians with a novel disease. On the other hand, the comparable mortality rates of expanded versus traditional ICUs is an encouraging finding. This could be interpreted as a solution to the conundrum of care for the critically ill during periods of high strain on ICU resources. It must be noted that we also need to consider other potential solutions such as interfacility transfer of critically ill patients to balance the strain among multiple health systems because our results showed that the increased hospital strain itself, which leads to the need to open expanded ICUs, worsen the overall mortality, regardless of assigned ICU type. It is possible that the relationship of increased hospital occupancy and increased mortality can result from the distribution of limited medical resources to both traditional and expanded ICUs. However, it is also likely that there may be other factors involved that are not limited to the distribution of medical resources. Future studies should focus on potential explanations of the observed effect.
Our aim was to evaluate the mortality of the patients admitted to traditional and expanded ICUs. Although there was a mortality difference between patients admitted to traditional versus expanded ICUs in the univariate analysis, there were many potential confounders that needed to be considered. For example, as shown in Figure 1, the usage of expanded ICUs increased only after traditional ICU capacity became saturated, which means that the patients in expanded ICUs were likely to be admitted in the phase when the hospital was more crowded with critically ill COVID-19 patients. After the adjustments of several factors, including the patient severity and the scale of hospital strain, the difference in the mortality between traditional and expanded ICUs was diminished while exceeding the hospital capacity was still associated with higher mortality. Taken together, our results indicate that hospitals and health systems seem to be impacted by the strain itself rather than the potential decline in quality of treatment in expanded ICUs.
Limitations
As a retrospective study, our study has several limitations. With data collected from a heterogeneous population from 11 participating hospitals in New York, confirmatory studies in other geographical areas may be needed to support our results. Second, we did not include patients who underwent ECMO because ECMO patients were preferentially assigned to traditional ICUs due to specific staffing and training requirements. Third, we focused on short-term mortality after intubation because we were concerned that the longer outcome measurement would be influenced more greatly by factors after ICU discharge rather than the effect of the assigned ICU type. Considering that the time course of critical illness secondary to COVID-19 infection has been more prolonged than that of other respiratory illnesses (e.g., flu), it may be more crucial to assess longer-term outcomes in future prospective studies. Fourth, in this study, we measured hospital occupancy for critically ill patients by evaluating the scale of crowdedness, which was at the hospital level rather than at an individual ICU level. Future studies evaluating individual ICU crowdedness and its relationship to increased mortality may be worthwhile to confirm our findings. Fifth, we did not evaluate any nonclinical factors, such as the total availability of ventilators per day, that may have influenced decision-making regarding the initiation of mechanical ventilation. Although helpful, this information was beyond the scope of our study and was not readily available in the EHR. Finally, while we have used standardized methods to compare the acuity of patients in expanded versus traditional ICUs, it is still possible that these populations may be different in some other respects that need further evaluation.
In this study, we excluded patients who had DNR orders initiated during the early phase after intubation (within 24 h) to help reduce selection bias. In fact, the proportion of patients who had DNR within 24 hours after intubation was not different between those admitted to traditional ICUs (8% [90/1,157]) and those admitted to expanded ICUs (6% [60/959]).
Conclusions
Although increased hospital occupancy for critically ill patients itself was associated with increased mortality, the risk of 28-day in-hospital mortality of mechanically ventilated patients with COVID-19 who were admitted to expanded ICUs was not different from those admitted to traditional ICUs.
As a means to manage the immense volume of patients affected by this pandemic, many expanded ICUs were built throughout the world to effectively treat intubated COVID-19 patients. However, there is a paucity of information regarding the outcomes of expanded ICUs because we have never experienced a similar situation since the Spanish flu pandemic over a hundred years ago. We believe our data could be helpful if we face a similar pandemic in the future and the need to treat a high volume of critically ill patients in expanded ICUs.
Acknowledgments
Acknowledgment
The authors thank and honor all of the Northwell Health team members who consistently put themselves in harm’s way during the COVID-19 pandemic. The authors dedicate this manuscript to them, as their vital contribution to knowledge about COVID-19 and sacrifices on behalf of patients made it possible. The authors also want to thank all study participants for making this work possible. The authors thank Dr. Raymond Hou; Academic Associates Samuel Abecassis, Sarah Jacobs, Kate van Loveren, Mohanapriya Sayeen Nagarajan, Casey Owens, and Frances Steele; and medical students Chirag Bhatia, Christian Leung, Brandon Lynn, Courtney Pina, Marianne Ruelle, and Pinguang Yang for helping with data abstraction.
Northwell COVID-19 Research Consortium authors: Matthew A. Barish, North Shore University Hospital/Northwell Health, Manhasset, New York; Douglas P. Barnaby, Donald and Barbara Zucker School of Medicine at Hofstra/Northwell, Hempstead, New York and Institute for Health System Science, The Feinstein Institutes for Medical Research, Northwell Health, Manhasset, New York; Edith Burns, Donald and Barbara Zucker School of Medicine at Hofstra/Northwell, Hempstead, New York and Institute for Health System Science, The Feinstein Institutes for Medical Research, Northwell Health, Manhasset, New York; Jennifer Cookingham, Institute for Health System Science, The Feinstein Institutes for Medical Research, Northwell Health, Manhasset, New York; Zachary M. Kozel, Donald and Barbara Zucker School of Medicine at Hofstra/Northwell, Hempstead, New York; Ernesto P. Molmenti, North Shore University Hospital/Northwell Health, Manhasset, New York and Donald and Barbara Zucker School of Medicine at Hofstra/Northwell, Hempstead, New York; Rachel Monane, Institute for Health System Science, The Feinstein Institutes for Medical Research, Northwell Health, Manhasset, New York; and Marc d. Paradis, Holdings and Ventures, Northwell Health, Manhasset, New York.
Footnotes
A complete list of Northwell Health COVID-19 Research Consortium authors may be found before the beginning of the References.
Supported by National Institute on Aging grant R24AG064191 and U.S. National Library of Medicine of the National Institutes of Health grant R01LM012836.
Author Contributions: M.N. and D.J. had full access to all data in the study and take responsibility for the integrity of the data and the accuracy of the data analysis. Concept and design: M.N., D.J., K.S., and L.B.B. Acquisition, analysis, or interpretation of data: M.N., D.J., N.S., K.S., C.P.S., M.S., J.G., R.R., T.L., K.H., D.M.R., S.J.M., J.S.H., M.T.W., M.P.J., M.L.L., and L.B.B. Drafting of the manuscript: M.N. and N.S. (statistical part). Critical revision of the manuscript for important intellectual content: D.J., C.P.S., M.S., J.G., R.R., M.L.L., and L.B.B. Statistical analysis: M.N., N.S., C.P.S., A.G., and M.L.L.
The datasets used and analyzed during the current study are available from the corresponding author upon reasonable request.
This article has an online supplement, which is accessible from this issue’s table of contents at www.atsjournals.org.
Author disclosures are available with the text of this article at www.atsjournals.org.
Contributor Information
for the Northwell Health COVID-19 Research Consortium:
Matthew A. Barish, Douglas P. Barnaby, Edith Burns, Jennifer Cookingham, Zachary M. Kozel, Ernesto P. Molmenti, Rachel Monane, and Marc d. Paradis
References
- 1. Guan WJ, Ni ZY, Hu Y, Liang WH, Ou CQ, He JX, et al. China Medical Treatment Expert Group for Covid-19 Clinical characteristics of coronavirus disease 2019 in China. N Engl J Med . 2020;382:1708–1720. doi: 10.1056/NEJMoa2002032. [DOI] [PMC free article] [PubMed] [Google Scholar]
- 2.CSSE. 2020. https://gisanddata.maps.arcgis.com/apps/opsdashboard/index.html#/bda7594740fd40299423467b48e9ecf6
- 3.Weinberger DM Cohen T Crawford FW Mostashari F Olson D Pitzer VE et al. Estimating the early death toll of COVID-19 in the United States medRxiv 2020https://www.medrxiv.org/content/10.1101/2020.04.15.20066431v2.
- 4. Richardson S, Hirsch JS, Narasimhan M, Crawford JM, McGinn T, Davidson KW, et al. Northwell C-RC Presenting characteristics, comorbidities, and outcomes among 5700 patients hospitalized with COVID-19 in the New York City area. JAMA . 2020;323:2052–2059. doi: 10.1001/jama.2020.6775. [DOI] [PMC free article] [PubMed] [Google Scholar]
- 5. Sturdy A, Basarab M, Cotter M, Hager K, Shakespeare D, Shah N, et al. Severe COVID-19 and healthcare-associated infections on the ICU: time to remember the basics? J Hosp Infect . 2020;105:593–595. doi: 10.1016/j.jhin.2020.06.027. [DOI] [PMC free article] [PubMed] [Google Scholar]
- 6. Gandjour A. How many intensive care beds are justifiable for hospital pandemic preparedness? A cost-effectiveness analysis for COVID-19 in Germany. Appl Health Econ Health Policy . 2021;19:181–190. doi: 10.1007/s40258-020-00632-2. [DOI] [PMC free article] [PubMed] [Google Scholar]
- 7. Mathews KS, Seitz KP, Vranas KC, Duggal A, Valley TS, Zhao B, et al. National Heart, Lung, and Blood Institute Prevention and Early Treatment of Acute Lung Injury (PETAL) Clinical Trials Network Variation in initial US hospital responses to the coronavirus disease 2019 pandemic. Crit Care Med . 2021;49:1038–1048. doi: 10.1097/CCM.0000000000005013. [DOI] [PMC free article] [PubMed] [Google Scholar]
- 8. Gabler NB, Ratcliffe SJ, Wagner J, Asch DA, Rubenfeld GD, Angus DC, et al. Mortality among patients admitted to strained intensive care units. Am J Respir Crit Care Med . 2013;188:800–806. doi: 10.1164/rccm.201304-0622OC. [DOI] [PMC free article] [PubMed] [Google Scholar]
- 9. Anesi GL, Liu VX, Gabler NB, Delgado MK, Kohn R, Weissman GE, et al. Associations of intensive care unit capacity strain with disposition and outcomes of patients with sepsis presenting to the emergency department. Ann Am Thorac Soc . 2018;15:1328–1335. doi: 10.1513/AnnalsATS.201804-241OC. [DOI] [PMC free article] [PubMed] [Google Scholar]
- 10. Lapichino G, Gattinoni L, Radrizzani D, Simini B, Bertolini G, Ferla L, et al. Volume of activity and occupancy rate in intensive care units. Association with mortality. Intensive Care Med . 2004;30:290–297. doi: 10.1007/s00134-003-2113-4. [DOI] [PubMed] [Google Scholar]
- 11. Bravata DM, Perkins AJ, Myers LJ, Arling G, Zhang Y, Zillich AJ, et al. Association of intensive care unit patient load and demand with mortality rates in US Department of Veterans Affairs hospitals during the COVID-19 pandemic. JAMA Netw Open . 2021;4:e2034266. doi: 10.1001/jamanetworkopen.2020.34266. [DOI] [PMC free article] [PubMed] [Google Scholar]
- 12. Churpek MM, Gupta S, Spicer AB, Parker WF, Fahrenbach J, Brenner SK, et al. Investigators S-C Hospital-level variation in death for critically ill patients with COVID-19. Am J Respir Crit Care Med . 2021;204:403–411. doi: 10.1164/rccm.202012-4547OC. [DOI] [PMC free article] [PubMed] [Google Scholar]
- 13. Kadri SS, Sun J, Lawandi A, Strich JR, Busch LM, Keller M, et al. Association between caseload surge and COVID-19 survival in 558 U.S. hospitals, March to August 2020. Ann Intern Med . 2021;174:1240–1251. doi: 10.7326/M21-1213. [DOI] [PMC free article] [PubMed] [Google Scholar]
- 14. Stretch R, Della Penna N, Celi LA, Landon BE. Effect of boarding on mortality in ICUs. Crit Care Med . 2018;46:525–531. doi: 10.1097/CCM.0000000000002905. [DOI] [PMC free article] [PubMed] [Google Scholar]
- 15. Pascual JL, Blank NW, Holena DN, Robertson MP, Diop M, Allen SR, et al. There’s no place like home: boarding surgical ICU patients in other ICUs and the effect of distances from the home unit. J Trauma Acute Care Surg . 2014;76:1096–1102. doi: 10.1097/TA.0000000000000180. [DOI] [PMC free article] [PubMed] [Google Scholar]
- 16. Mohr NM, Wessman BT, Bassin B, Elie-Turenne MC, Ellender T, Emlet LL, et al. Boarding of critically ill patients in the emergency department. Crit Care Med . 2020;48:1180–1187. doi: 10.1097/CCM.0000000000004385. [DOI] [PMC free article] [PubMed] [Google Scholar]
- 17. Grasselli G, Pesenti A, Cecconi M. Critical care utilization for the COVID-19 outbreak in Lombardy, Italy: early experience and forecast during an emergency response. JAMA . 2020;323:1545–1546. doi: 10.1001/jama.2020.4031. [DOI] [PubMed] [Google Scholar]
- 18. Lee CCM, Thampi S, Lewin B, Lim TJD, Rippin B, Wong WH, et al. Battling COVID-19: critical care and peri-operative healthcare resource management strategies in a tertiary academic medical centre in Singapore. Anaesthesia . 2020;75:861–871. doi: 10.1111/anae.15074. [DOI] [PMC free article] [PubMed] [Google Scholar]
- 19. Griffin KM, Karas MG, Ivascu NS, Lief L. Hospital preparedness for COVID-19: a practical guide from a critical care perspective. Am J Respir Crit Care Med . 2020;201:1337–1344. doi: 10.1164/rccm.202004-1037CP. [DOI] [PMC free article] [PubMed] [Google Scholar]
- 20. Le Gall JR, Lemeshow S, Saulnier F. A new Simplified Acute Physiology Score (SAPS II) based on a European/North American multicenter study. JAMA . 1993;270:2957–2963. doi: 10.1001/jama.270.24.2957. [DOI] [PubMed] [Google Scholar]
- 21. Stephens JR, Stümpfle R, Patel P, Brett S, Broomhead R, Baharlo B, et al. Analysis of critical care severity of illness scoring systems in patients with coronavirus disease 2019: a retrospective analysis of three U.K. ICUs. Crit Care Med . 2021;49:e105–e107. doi: 10.1097/CCM.0000000000004674. [DOI] [PMC free article] [PubMed] [Google Scholar]