Abstract
Recent studies show polyvalent, ligand-modified nanoparticles provide significantly enhanced binding characteristics compared to isolated ligands. Here, we assess the ability of substrate-modified nanoparticles to provide enhanced enzymatic activity. Energy transfer assays allowed quantitative, real-time measurement of proteolytic digestion at polyvalent quantum dot-peptide conjugates. Enzymatic progress curves were analyzed using an integrated Michaelis-Menten (MM) formalism, revealing mechanistic details, including deviations from classic MM-behavior. A “hopping” mode of proteolysis at the nanoparticle was identified, confirming enhanced activity.
Keywords: quantum dots, nanoparticle, peptides, proteolysis, kinetics, FRET
Graphical Abstract
The development of nanoparticle (NP)-bioconjugates for application in a wide range of assay formats is ongoing. Recent studies have suggested that polyvalent, ligand-modified NPs often exhibit improved binding with monomeric receptors compared to isolated ligands. For example, Wang et al. engineered gold NPs to display saccharide ligands and found that the binding avidity with lectin was orders of magnitude higher than that for the isolated saccharide. 1 Similarly, Tassa et al. functionalized iron oxide NPs with multiple copies of a low-affinity synthetic derivative of the natural product FK506 and found that the avidity for the FK506-binding protein increased by >104-fold.2 Liu et al. observed that the antimicrobial properties of a cationic peptide were significantly enhanced when assembled as polyvalent NP vectors.3 These results, and similar observations with other polyvalent NP-bioconjugates, have spurred the development of NPs as enhanced bioaffinity platforms. Given these considerations, we reasoned that polyvalent NP-substrate conjugates might similarly provide a platform for the enhanced activity of enzymes.
Amongst available NP materials, semiconductor quantum dots (QDs) provide many unique physical and optical characteristics that are advantageous for studying enzyme activity at NP-bioconjugate interfaces.4–6 The QD surface area supports polyvalent modification with substrate molecules and, importantly, QD photoluminescence (PL) permits tracking of biorecognition events using, for example, Förster resonance energy transfer (FRET).4, 5 QD probes designed to measure proteolytic activity are a prominent example of this capability and generally consist of a central QD donor conjugated with peptides that display both a specific cleavage site and distal FRET acceptor. Within the assembly, QD PL is initially quenched through FRET but is recovered following proteolysis and diffusion of the dye-labeled peptide fragment beyond the range of energy transfer. Such probes have been used in assays for more than ten different proteases;7–13 however, the mode of action is either tacitly assumed to be described by the classic Michaelis-Menten (MM) model or treated as a ‘black box’ when not essential to the application. This is due, at least in part, to the common method for estimating proteolytic kinetic parameters from initial rates: a MM plot where reaction velocity is measured at fixed enzyme and increasing substrate concentrations, such that a maximum velocity, V, is reached.14, 15 This approach works well with colorimetric or fluorogenic substrates that “light-up” with proteolysis, but is poorly suited for application with QD-FRET-based probes. The latter utilize ratiometric detection that, while favorable for sensing applications, hinders sensitive kinetic analysis with excess substrate.Since the polyvalent QD-bioconjugate functions as both substrate and optical reporter, high concentrations yield an intense background upon which it is difficult to resolve small changes in PL resulting from protease activity. Moreover, substrate concentrations ≥ 10−4 M are generally needed to exceed the Michaelis constant, , but QDs are typically used at concentrations ≤ 10−6 M.7–13 Kinetic assays approaching V are thus exceedingly difficult to achieve. Previously, this limitation was addressed by measuring velocities as a function of enzyme concentration for a fixed amount of substrate—an excess enzyme format.7,9 This approach provided an apparent activity constant, , that reflected changes in the value, but which was not strictly equivalent. While IUPAC deems both excess substrate and excess enzyme formats to be valid,16 results from the latter in prior QD-FRET proteolytic assays have been difficult to reconcile given the use of the former in nearly all other assay formats.
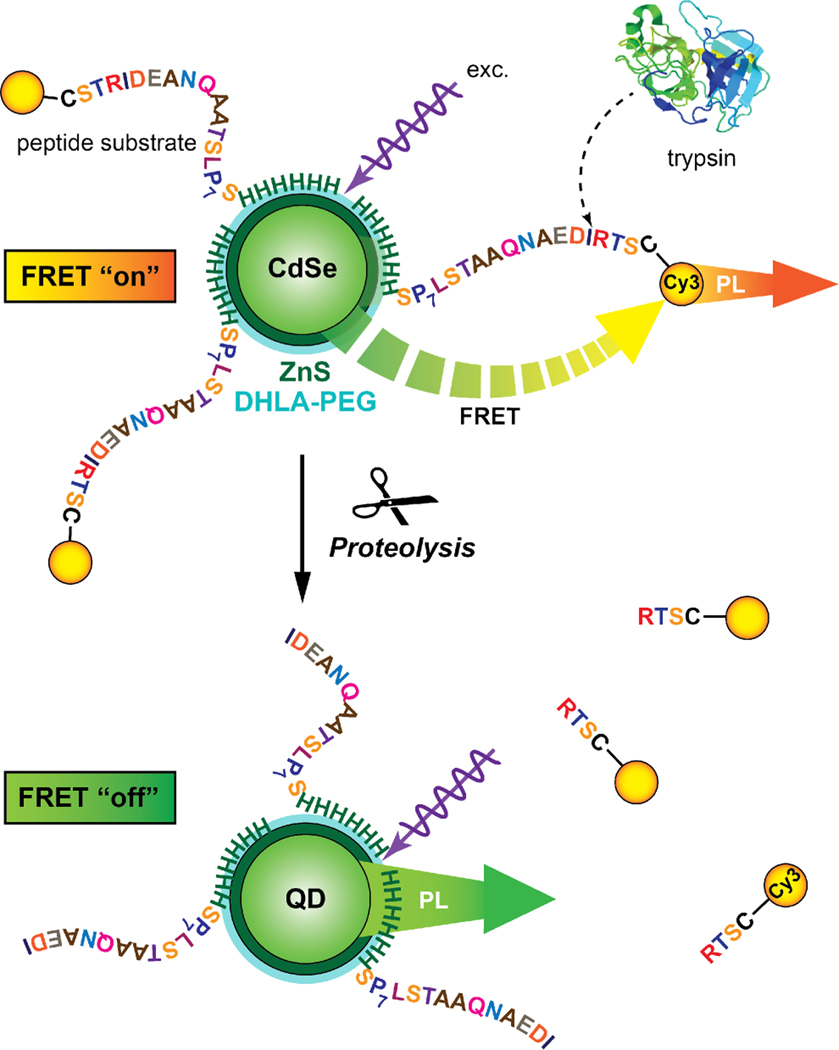
Here, we introduce a quantitative method for measuring proteolysis associated with QD-peptide substrate conjugates that overcomes the challenges noted above. The method is based on recording full reaction progress curves, in a ratiometric FRET format, using QD probes (Fig. 1). Full progress curves provide detailed kinetic information and far greater insight into the underlying mechanism than methods based on measuring initial rates. Dye-labeled peptide substrates for a prototypical serine protease, trypsin, were assembled to QDs and provided efficient FRET. Different sets of conjugates, with average valences that increased stepwise from 2–13, were prepared and subsequent proteolysis monitored in real-time via the loss of FRET.Fitting the data with an integrated form of the MM model 15,17,18 permitted estimation of the specificity constant, , and direct comparison with classical MM behavior. Analysis of the observed kinetic behavior, which included apparent rate enhancements, suggested that proteolytic activity proceeded through localized digestion of multiple peptide substrates at a single QD interface, and was consistent with a “hopping” model.
Figure 1.
Measuring trypsin activity using QD-(peptide-Cy3)n conjugates. Trypsin cuts the peptide to dissociate Cy3 acceptor from the QD donor, thereby disengaging FRET, which can be tracked spectroscopically as the ratio of Cy3/QD PL. Other dye acceptors can be used similarly.
Materials.
CdSe/ZnS core/shell QDs with PL emission maxima centered at 530 nm (FWHM = 39 nm) were synthesized as described previously19, 20 and made water soluble with poly(ethylene glycol) (PEG; MW ~750 Da) appended derivatives of dihydrolipoic acid.21,22 Peptide substrate was synthesized using standard in situ neutralization cycles with Boc-solid-phase-peptide synthesis.23 Labeling and purification procedures are described in detail elsewhere.7 Briefly, ~1 mg of peptide was dissolved in 1 mL of phosphate buffered saline (PBS), combined with excess maleimide-activated acceptor dye (Cy3 or A594), reacted at 22 °C for 1–2 h, then left overnight at 4°C. Excess dye was removed using nickel (II) nitrilotriacetic acid (Ni-NTA) agarose columns, the peptide desalted, then quantitated using the dye absorbance. Peptides were aliquoted, dried, and stored at −20 °C prior to use.
FRET calibration curves and analysis.
QD-(peptide-Cy3)n conjugates were self-assembled by mixing QDs (20 pmol; 0.2 μM) with 0–8 equivalents of Cy3-labeled peptide in PBS. QD-(peptide-A594)n conjugates were assembled similarly, mixing QDs (55 pmol; 0.5 μM) and 0–16 equivalents of A594-labeled peptide in PBS. The mixtures were equilibrated for 30–60 min and were transferred to a microtiter plate. PL spectra were acquired with excitation at 400 nm (Cy3) or 450 nm (A594) using a Tecan fluorescence plate reader. In parallel with the measurement of the calibration curves, samples with equivalent amounts of only peptide were measured to provide a correction for the amount of direct excitation of Cy3/A594 (see SI). Direct excitation of Cy3 was negligible; however, a small amount of direct excitation was observed with A594. Non-specific adsorption of Cy3/A594-labeled product peptide fragments was similarly evaluated by mixing different amounts of pre-digested peptide with the QDs in PBS, see Supporting Information (SI).
The FRET efficiency, , is a function of donor-acceptor distance, r, the number of acceptors per donor, N, and the characteristic Förster distance, (Eqn. 4).5,24 Experimentally, FRET efficiency is measured from changes in donor PL intensity, I, between the FRET-paired donor-acceptor state (measuring donor), DA, and a donor-only reference state, D.
| (4) |
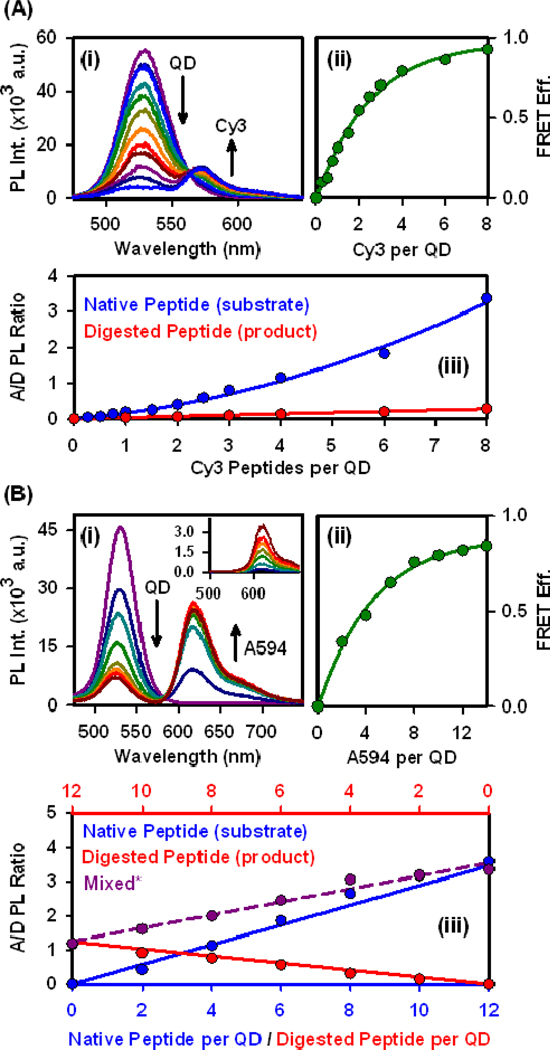
To track proteolysis quantitatively, the A/D PL ratio, was used in preference to the FRET efficiency. Details of the measurement and calculation of , including corrections for crosstalk, direct acceptor excitation, and peak areas, are given in the SI. The calibration curves (Fig. 2) were fit to obtain empirical functions that correlated p with N. These functions were then used to back-calculate n and at each time point in a progress curve.
Figure 2.
Calibration of changes in (i) PL spectra, (ii) FRET efficiency (from donor quenching), and (iii) A/D PL ratio with an increasing number of (A) Cy3- or (B) A594-labeled peptide substrates and products. The inset in B(i) shows the direct excitation of A594. * Designates mixtures of native and digested peptide with a constant total valence of 12 for the QD-A549 system.
Proteolytic assays.
The assay formats used to generate classic MM plots with both peptide and BANA substrate are described in the SI. To determine the MM parameters for the peptide in a kinetic format, a microtiter plate was prepared with bovine pancreatic trypsin at different concentrations in PBS, at ca. 22 °C. Digests of QD-(peptide-Cy3/A594)n conjugates were started by adding conjugate to the wells. The PL of each well was read every 2.5 min for over ≥2 h serially at 530 nm (QD) and 575/617 nm (Cy3/A594), with excitation at 400/450 nm, using the fluorescence plate reader. The A/D PL ratio was calculated for each time point. To partially correct for wavelength dependent drift in the experiments, the time-dependent A/D PL ratio was normalized to the control sample with no trypsin. The progress curves as A/D PL ratios were then converted to progress curves as QD-peptide substrate conjugate valence using the calibrations, and finally converted to progress curves as equivalent bulk substrate concentration. These latter progress curves were converted to enzyme-time for analysis. Since Eqn. 3 does not provide an explicit relation between and time, must be expressed in a closed form approximation given in the SI.25 The value of was taken from the experimental data and was used as the fitting parameter. To determine the MM parameters for hydrolysis of BANA in a kinetic assay, a series of assays were done similarly to those described for the QD-peptide substrate conjugates. The evolution of fluorescence from the 2-naphthylamine product was measured and converted to product concentration using calibrations samples (see SI). Further analysis was analogous to that with the peptide substrate. Detailed procedures and corresponding data (labeling/assay protocols, data processing, calculations, FRET-pair spectral overlap, peptide modeling, characterization of product adsorption on QDs, full kinetic assay data) are provided in the SI.
FRET characterization of QD-peptide substrate conjugates.
Trypsin, which cleaves C-terminal to lysine and arginine residues, was selected as a model protease due to its high specificity. A peptide substrate, C-STRIDEANQAAT-SLP7S-H6, was assembled to the QDs to create polyvalent NP substrates (Fig. 1). The peptide is shown divided into four functional modules: the N-terminal cysteine provided a unique thiol for dye labeling; the next module contained a single arginine residue as a cleavage site; the SLP7S module included a type II polyproline helix that functioned as a ~14 Å spacer;26 and the C-terminal hexahistidine sequence tightly assembled to the shell of the CdSe/ZnS QDs coated with poly(ethylene glycol) (PEG) ligands. Polyhistidine-driven self-assembly, which is characterized by nM, enables good control over the number of peptides assembled per QD and was critical to our experiments. 7,26–28
In real-time assays, the number of dye-labeled peptide substrates per QD was quantitatively measured using FRET. The QDs had peak PL at 530 nm and a quantum yield of The QDs were first paired as donors with a Cy3 acceptor, which is strongly absorbing (Ɛ = 150 000 L mol−1 cm−1 at 550 nm), and has emission largely resolved from the QD PL. The QD-Cy3 FRET pair had a spectral overlap integral of J = 6.9×10⁻¹⁰ mol−1 cm6 and a Förster distance of R0 = 5.4 nm. Changes in FRET efficiency for the QD-Cy3 pair as a function of increasing the number, N, of Cy3-labeled peptide substrates assembled per QD was characterized through the progressive quenching of QD PL and corresponding FRET-sensitization of Cy3 PL (Fig. 2A). Analysis of this data using the Förster formalism (Eqn. 4; see Methods) derived a QD-Cy3 center-to-center separation distance of r = 5.9 nm. Energy transfer to the Cy3 reached > 90% efficiency at N = 8. In order to utilize a higher number of peptides per QD, it was necessary to adopt a second FRET pair with a lower intrinsic efficiency per acceptor. Alexa Fluor 594 (A594) was selected due to its more red-shifted absorption and smaller molar absorption coefficient (Ɛ = 73 000 L mol −1 cm −1 at 590 nm) compared to Cy3. The QD-A594 pair was characterized by J = 1.6×10⁻¹⁰ mol−1 cm6 and R0 = 4.2 nm. Quenching of the QD PL with increasing A594-labeled peptide substrates per QD progressed more gradually than with Cy3 (Fig. 2B). An efficiency of ~85% was reached at N = 14 and confirmed access to higher values of N. The QD-A594 FRET data indicated r = 5.1 nm, in good agreement with that obtained using Cy3-labeled peptides.
For both the Cy3 and A594 acceptors, incremental changes in FRET efficiency per assembled peptide became small as the conjugate valence increased. In contrast, the FRET-sensitized dye acceptor (A)-to-QD donor (D) PL ratio (A/D PL ratio; Fig. 2) exhibited large changes even at higher conjugate valences, and did not require a FRET-off reference state for measurement. Real-time changes in QD and Cy3/A594 PL were measured in kinetic assays, and the corresponding A/D PL ratios were used to calculate values of N at each time point. An important aspect of this analysis was that the A/D PL ratios accounted not just for FRET from peptide substrates bound to the QDs, but also for some adsorption of the digested Cy3/A594-CSTR peptide product fragments formed during assays. While the Cy3-labeled product had very weak adsorption to the QDs, that of the A594-labeled product was more significant (Fig. 2A/B, iii). To correct for the latter, a suitable calibration function was derived from mixtures that contained both undigested substrate and product fragments (see SI).
Michaelis-Menten kinetic formalism.
The general form of a single-substrate, single-binding site enzyme catalyzed reaction is shown in Eqn. 1. Enzyme (E) irreversibly converts substrate (S) to product (P) through an intermediate enzyme-substrate complex (ES).
| (1) |
In the presence of excess substrate, and making the Briggs-Haldane steady-state assumption with the free ligand condition , the initial rate, v, of the net reaction in Eqn. 1 is given by the MM model, Eqn. 2. The terms include , the concentration of substrate; V, the maximum rate of catalysis; , the Michaelis constant; and , the rates for ES complex association and dissociation; , the turnover number; and , the total concentration of enzyme.17,29
| (2) |
As described elsewhere,15,17,18 Eqn. 2 can be integrated to give the time-dependent substrate concentration, Eqn. 3, in terms of , V, and time, t, where is the initial concentration of substrate (t = 0), and is its time-dependent concentration.
| (3) |
The validity of using Eqn. 3 and substrate-explicit mathematical reformulations (see SI) is predicated on three mechanistic assumptions: (a) the enzyme is stable over the time course; (b) the reaction is irreversible; and (c) the product is not an inhibitor.15 Further, reliable mathematical determinations of both and using reaction progress curves require satisfying two additional criteria: (d) and (e) Selwyn’s test.30 When (d) is not satisfied, the progress curves reflect only the ratio . This latter ratio, called the specificity constant, is a measure of enzyme efficiency and functions as an effective second-order rate constant.31,32 Selwyn’s test states that progress curves obtained from a system with MM kinetic behavior, at a fixed and variable , should superimpose when time is scaled by to yield a common trajectory in so-called “enzyme-time,” (units of M s). We apply the term progress curve to assay data presented in both normal-time and enzyme-time, but stipulate the distinction where necessary.
Digestion of quantum dot-peptide substrate conjugates.
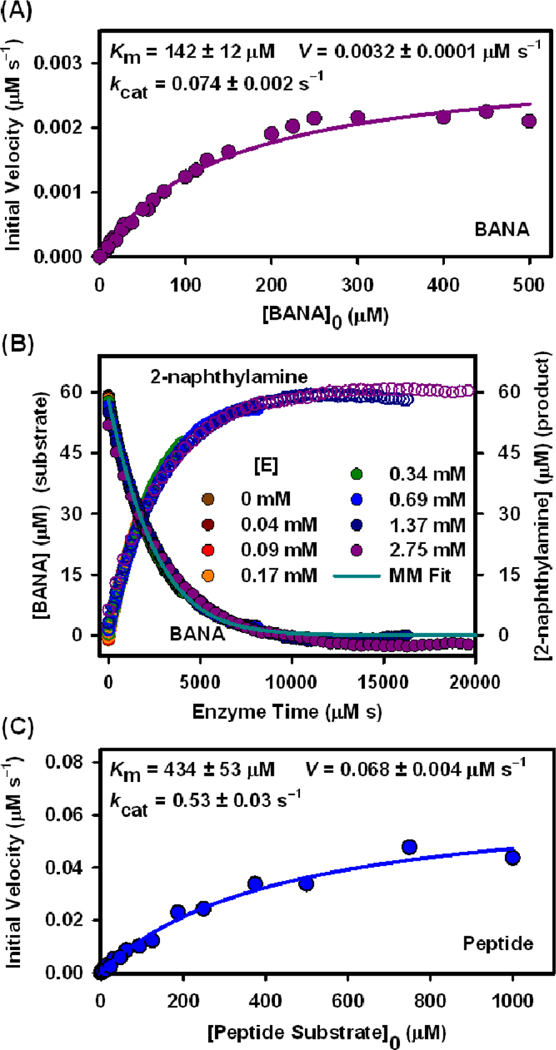
Prior to assays with QDs, the use of the integrated MM formalism was first validated using a small molecule fluorogenic substrate, -benzoyl-DL-arginine -naphthylamide hydrochloride, BANA.33 Values for and were determined from a conventional excess-substrate MM plot (Fig. 3A); in another experiment, the specificity constant, , was determined by fitting full progress curves in enzyme-time (Fig. 3B). Given that was unchanged between formats (identical conditions), values derived from both experiments agreed within 3%. Importantly, the full course of the progress curves was closely fit by the integrated MM model (see SI for experimental details). Next, freely diffusing peptide substrate was digested in bulk solution and and extracted from a MM plot (Fig. 3C). These values were used to provide a point of comparison between trypsin catalyzed hydrolysis in bulk solution and at a QD interface.
Figure 3.
(A) Michaelis-Menten (MM) plot for BANA hydrolysis. (B) Progress curves in enzyme-time for the hydrolysis of BANA (•) and formation of 2-naphthylamine product (○), catalyzed by different trypsin concentrations, . The solid line is the fit to the integrated MM model. (C) MM plot for peptide substrate digestion in solution.
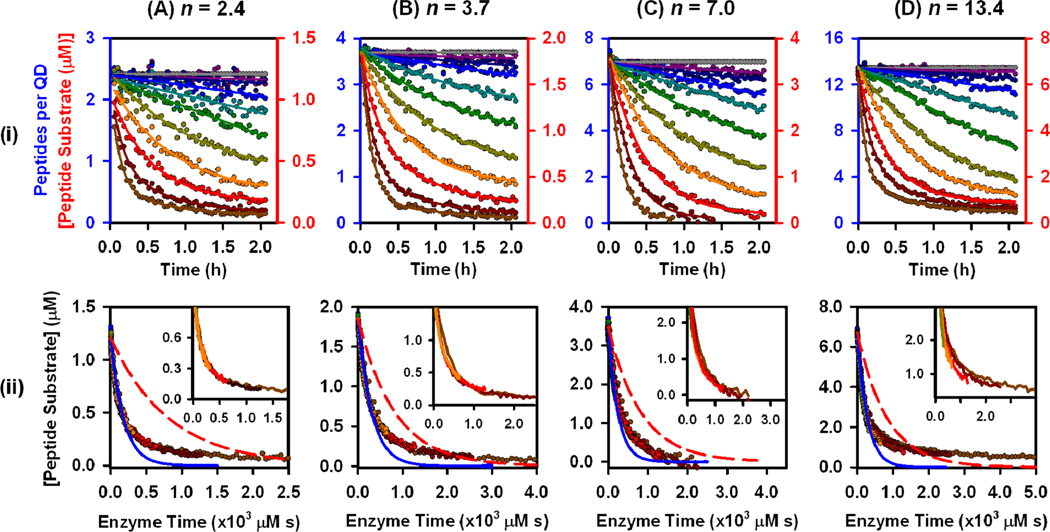
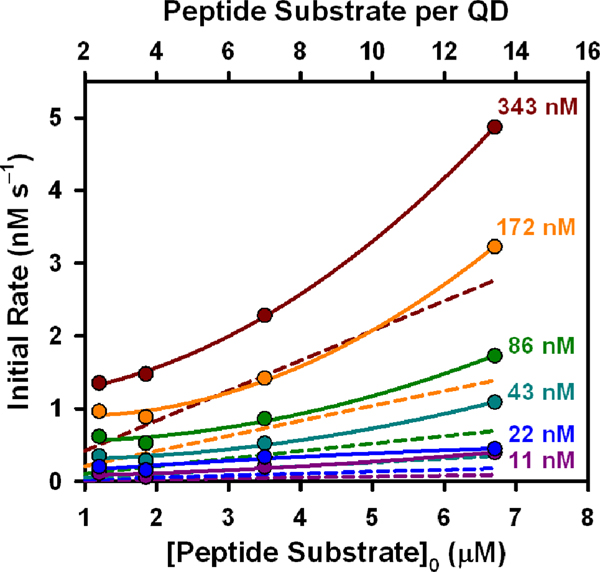
Self-assembled QD-peptide conjugates were prepared with targeted valences of N = 2, 4, and 8 Cy3-labeled peptide substrates per QD, or 12 A647-labled peptides, for trypsin digestion. The actual peptide substrate-to-QD ratios, measured from A/D PL ratios, were n = 2.4, 3.7, 7.0 and 13.4 peptides per QD. The small deviations from the targeted valences are attributed to preparingbatches of conjugate for assays using >10-fold more material than during calibration experiments. Note that we use N and n to distinguish between conjugate valences targeted in calibration experiments and those apparent in digestion experiments, and that these values are averages across the ensemble.28 Each QD-peptide substrate conjugate was digested with different concentrations of trypsin and the QD and Cy3/A594 PL collected at 2.5 min intervals for 120 min. Time-dependent increases in QD PL and corresponding decreases in Cy3/A594 emission directly reflected the loss of FRET with hydrolysis of the peptide substrate. The rates of change in QD PL, Cy3 or A594 PL, and A/D PL ratio were all proportional to the concentration of trypsin (see SI). Using the prior calibration data, the time-dependent A/D PL ratio data was converted into the time-dependent number of peptide substrates remaining per QD and the equivalent ‘bulk’ substrate concentration (Fig. 4i). The data collected in this assay format generally met the minimum MM requirement of excess substrate (see SI). Progress curves were converted to enzyme-time courses for each trypsin concentration, and fit with the integrated MM model to obtain (Fig. 4ii; Table 1). In contrast with the validation experiment with BANA, the integrated MM model did not fit the full time course of the experiment (Fig. 4i, blue lines). While the initial phases of substrate digestion were reasonably fit, negative departures from the MM model were observed at later times, indicating slower proteolysis than expected from the initial rates. The progress curves (in enzyme-time) were then compared with those predicted from the MM kinetic parameters (, , ) measured for the peptide substrate in bulk solution (Fig. 4ii; red lines). Despite the negative deviations from MM behavior at later times, the proteolytic rates associated with the QD-peptide substrate conjugates were nonetheless faster than those calculated for an equivalent amount of peptide in bulk solution (direct observation of progress curves for the peptide substrate in the absence of QDs was not possible, see SI). Initial rates were calculated for the different QD-peptide substrate conjugate valences as tangents to the initial phase of the progress curve (Fig. 5), and increased with increasing conjugate valence despite no change in the concentration of QDs.
Figure 4.
Progress curves in (i) normal time and (ii) enzyme-time for hydrolysis of QD-(peptide-Cy3/A594)n conjugates, catalyzed by different trypsin concentrations: (A) n = 2.4 (Cy3), (B) n = 3.7 (Cy3), (C) n = 7.0 (Cy3), and (D) n = 13.4 (A594). Trypsin concentrations were 0, 1.3, 2.7, 5.4, 11, 22, 43, 86, 172, 343, 687 nM, except for n = 2.4, where 687 nM was replaced with 0.6 nM. In (ii), blue curves are best fits to the MM model, and red curves are those predicted from the values of and V for only the peptide substrate in bulk solution.
Table 1.
Relevant kinetic parameters for QD-peptide substrate conjugates, bulk peptide substrate and BANA.
| Substrate | a | b | ||
|---|---|---|---|---|
|
| ||||
| CSTRIDEANQAATSLP7SH6 (peptide) | 0.53 ± 0.03 | 434 ± 53 | 1.2 ± 0.2 | |
|
| ||||
| QD Conjugates | [QD] (μM) | [S] (μM) | ||
|
| ||||
| QD-(peptide-Cy3)2.4 | 0.5 | 1.2 | 95 ± 5 | 5.6 ± 0.3 |
| QD-(peptide-Cy3)3.7 | 0.5 | 1.8 | 160 ± 10 | 3.3 ± 0.2 |
| QD-(peptide-Cy3)7.0 | 0.5 | 3.5 | 146 ± 9 | 3.6 ± 0.2 |
| QD-(peptide-A594)13.4 | 0.5 | 6.7 | 119 ± 7 | 4.4 ± 0.3 |
The uncertainty in is derived from the uncertainty in .
The listed uncertainties are standard errors associated with curve fitting the average data from three replicate experiments.
Figure 5.
Initial hydrolysis rates as a function of QD-peptide substrate conjugate valence (or peptide substrate concentration) at different trypsin concentrations. Dashed lines are those predicted from peptide digestion in bulk solution.
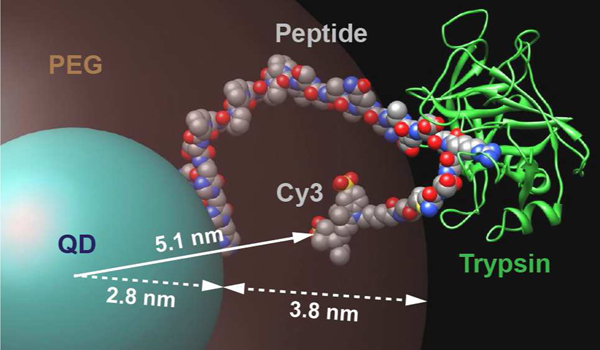
Unfortunately, individual values for both and could not be reliably extracted in our analysis. Given for the peptide substrate in bulk solution, this would have required millimolar concentrations of QD to satisfy the requirement of substrate concentrations 2–3-fold larger than . As mentioned, QDs are restricted to micromolar concentrations due to limitations in both solubility and optical density. Nevertheless, given our interest in comparing values, we defined an effective value, , by assuming that measured for digestion in bulk solution is unchanged and a good first approximation for the digestion of polyvalent QD-peptide substrate conjugates. Mechanistically, is the rate at which enzyme-substrate complex is converted to product and regenerated enzyme and, for this exercise, we assume that the enzyme-substrate complex itself is not affected by the QD, even if the details of the initial association with the substrate are affected. The chemical compositions of the peptide and trypsin are unchanged in the QD conjugate system, and the question is thus one of physical perturbation. Such an assumption is also predicated on the trypsin being able to bind and cleave the peptide substrate in a solution-like environment. To this end, we sought to simulate and visualize the structural assembly between QD-peptide substrate (Cy3) conjugates and trypsin. Details of the process are described in the SI and the structure is shown in Fig. 6. Peptide substrate was assembled to the QD, fitted into the binding site of trypsin using crystallographic data,34 torsion angles adjusted to place the Cy3 acceptor at the distance determined in FRET experiments (r = 5.1 nm; Fig. 2A), and an energy minimization done. In this peptide conformation, the arginine cleavage site and bound trypsin were located outside the volume of the PEG coating on the QD. This geometry supports our assumption of a minimally perturbed enzyme-substrate complex at the QD interface. We therefore calculate for each conjugate valence (Table 1) and discuss its interpretation as a semi-quantitative parameter below.
Figure 6.
Model of the peptide substrate assembled to the QD, with trypsin bound to the arginine cleavage site, outside the PEG coating. The QD-Cy3 donor acceptor separation distance r of 5.1 nm determined from FRET is indicated along with the QD core/shell radius of 2.8 nm and the 3.8 nm estimated maximum extension of the PEG ligand.
Assay benefits.
Our method for real-time measurements of proteolytic activity at a NP interface using QD-peptide conjugates and FRET overcomes challenges previously encountered with quantitative application of this sensing configuration: determination of a kinetic parameter () in an excess substrate configuration at , and direct observation of reaction progress to help reveal information about the underlying mechanism. Progress curves utilize a single reaction mixture and thus provide multiple data points under identical conditions, yielding a full description of the effects of substrate consumption, product formation, and/or time-dependent changes in enzyme activity.25,30 It is, however, not trivial to utilize a kinetic enzyme assay with NP-substrate bioconjugates. Our format was greatly facilitated by polyhistidine self-assembly of peptide to QD, which was rapid, reproducible and, most importantly, enabled control over substrate valence.27,28 Meticulous correlation of the A/D PL FRET ratio with both conjugated peptide substrate and adsorbed peptide product was also necessary. The sensitivity to the spectral overlap integral (i.e. Cy3 vs. A594) permitted tuning of the dynamic range of the assay by extending the range of peptide ratios displayed on the QD. Importantly, the kinetic format also ameliorated a limitation of ratiometric FRET assays: low sensitivity when resolving small amounts of FRET-sensitized acceptor PL on the bathochromic side of the donor PL spectrum. While enzyme assays based on initial rates consume < 10% of substrate, kinetic formats allow the full amount of substrate to be consumed.25 Rather than resolving < 10% changes in FRET at a fixed endpoint, the assay time can be extended for low enzyme activities, consuming more substrate for a greater net change in FRET, but without compromising the resolution of high activities. Clearly, combining this format with a high-throughput fluorescence plate reader facilitates the rapid generation of large amounts of data, in replicate, across many enzyme concentrations, thereby providing a quantitative method suitable for studying mechanisms of enzyme activity at the QD interface.
Insight from progress curves.
The caveat of progress curve analysis is the more complex mathematics needed to extract kinetic parameters. While is a general result that can be extracted from progress curves across a wide range of substrate concentrations, independent determination of and requires systems where so that is readily achieved. Nonetheless, the value of is a useful measure of overall enzyme efficiency. The values of in Table 1 are comparable to the 0.3–6.2 mM−1s−1 values previously reported with trypsin and four-residue peptide substrates containing an arginine cleavage site,35 but are much lower than the 1300–3600 mM s values reported for fifteen- residue peptide substrates.36 The value of measured for the peptide substrate in bulk solution is comparable to those in both of these prior reports. The most interesting results, however, are from comparing the activities between peptide substrate in bulk solution and the polyvalent QD-peptide substrate conjugates. The 3-fold or better increase in with the QD system reflects the enhanced activity that was observed upon comparison with the expected trajectories derived from bulk solution parameters (Fig. 4). We do not attempt to interpret the variability in between conjugate valences, which may have contributions from only being able to fit the initial portion of progress curves to an integrated MM model.
It is important to note that the departure of the progress curves (Fig. 4) from the trajectory defined by the integrated MM model was not due to a breakdown of the Briggs-Haldane assumption as the reaction neared completion. The Briggs-Haldane assumption holds over a greater proportion of a progress curve as the ratio increases; however, similar deviations were observed across the range of conjugate valences despite the increasing ratio. Further noting that the validation experiment with BANA (Fig. 3) was fully described by a MM progress curve, the departures from the classic trajectory with QD-peptide substrate conjugates are clearly indicative of a modified process. Indeed, another departure from classic MM kinetics was observed in the progress curve for n = 13.4, which showed evidence of systematic deviations from a common reaction trajectory in enzyme-time between different enzyme concentrations (insets, Fig. 4ii) and arguably failed Selwyn’s test. Although similar deviations were difficult to identify within the experimental precision for n = 2.4, 3.7, and 7.0, very pronounced deviations from Selwyn’s test were observed with the trypsin-catalyzed hydrolysis of BANA in the presence of QDs (see SI). Indirect evidence suggested that this was due to association of the BANA and/or trypsin with the QD interface. A simple MM model, without explicit consideration of the QD, does not appear to provide a full description of proteolytic activity in this format.
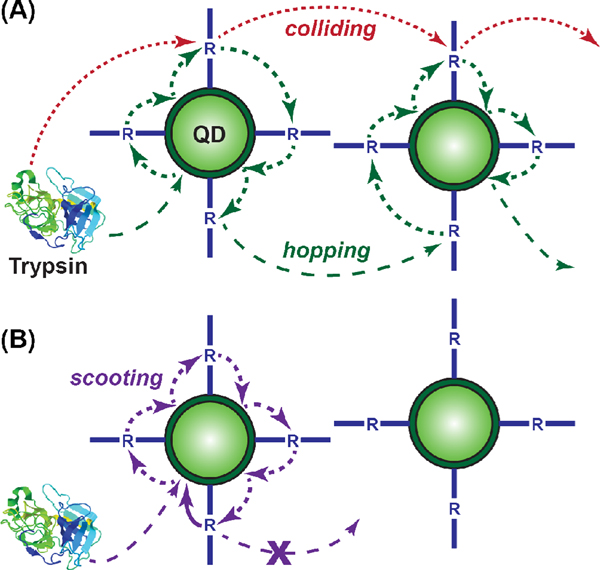
There are theoretical frameworks available to describe enzyme-polyvalent substrate activity at an interface. Enzyme catalysis has been described previously at bulk interfaces using a Langmuir-Michaelis-Menten (LMM) model;37,38 however, the geometry and assumptions of Langmuir adsorption are not suitable to account for QD-peptide substrate conjugates dispersed in bulk solution. Alternatively, activity at cell surfaces is typically modeled in one of two ways: “surface diffusion,” where a bound ligand moves on the cell interface; and “ligand rebinding,” where a ligand dissociates from the cell interface and subsequently rebinds at that same interface without diffusing a large distance away from the interface.39–41 In these models, the cell interface is treated as being flat at the molecular scale. Such an assumption is not suitable for a QD, which has pronounced curvature and facets at the size scale of proteins, and where the difference in size between a QD and cell (ca. 103 in diameter and 106 in surface area) is such that a small diffusion length away from a cell interface (i.e. a plane) is a potentially large distance away from a QD (i.e. a point). Berg et al. have described interfacial enzyme catalysis—including reaction progress curves—for phospholipase A2 (PLA2) acting on nanoscale (< 100 nm) lipid vesicles that were polyvalent in substrate.42 This system is most analogous to ours. Two possible modes of enzyme activity were postulated for the PLA2 system: “scooting” and “hopping” (Fig. 7A–B). Scooting comprised initial and irreversible adsorption to the vesicle surface with subsequent interfacial diffusion and catalysis. Accordingly, the progress curves and corresponding kinetic model for PLA2 acting on vesicular substrates were characterized by a first component that contributed early in the reaction, and a second component that dominated at later reaction times.42 A characteristic feature of this mechanism was that for vesicle-to-enzyme ratios >5:1, hydrolysis would proceed to endpoints that were proportional to enzyme concentration.42 This is a threshold for a statistical predominance of one enzyme acting per vesicle. In contrast, hopping, which was not supported by the experimental data with PLA2, comprised reversible adsorption with multiple catalytic events per vesicle, followed by the translocation of enzyme between vesicles.42 In the context of a general polyvalent NP-substrate conjugate, we suggest a third mode, “colliding” (Fig. 7A), which comprises enzyme-NP encounters with no more than one catalytic event and negligible association between the enzyme and NP interface.
Figure 7.
Schematics for possible modes of proteolysis with the polyvalent QD-peptide substrate conjugates: (A) colliding and hopping; (B) scooting.
Considering our QD-peptide substrate conjugates, it is possible to rule out a scooting mechanism (i.e. irreversible adsorption) for trypsin activity. Although activity was lower at QD-to-trypsin ratios ≥ 5:1, reaction endpoints were not strongly dependent on enzyme concentration and digests at ratios of ~100:1 still showed pronounced proteolytic activity. Indeed, some of these low ratio digests appear as though they would go to completion given sufficient time. If the digestion of QD-substrate followed a scooting model, then digests at 100:1 ratios would manifest as the equivalent of turning FRET off in ~1% of the QD-peptide substrate conjugates, which would not be observable in a real experiment. However, FRET changes in the vicinity of 30% were still observed at this ratio, suggesting that any trypsin adsorption to the QDs was reversible, thus clearly precluding a scooting mechanism.
We next consider our data in the context of hopping and colliding modes. The initial rate of proteolysis increased with increasing conjugate valence, despite no corresponding change in the probability of encounters between trypsin and QD-peptide substrate conjugates (i.e. [QD] and [E] were unchanged). One possible explanation for this increase was that a greater fractional coverage of the QD surface area by peptide substrate increased the probability of productive encounters between bound peptides and trypsin. While this accounts for the rate dependence on conjugate valence, it does not account for the enhanced trypsin activity with the QD conjugates. Polyvalent QD-peptide conjugates diffuse more slowly and comprise fewer diffusing entities than an equivalent amount of peptide in bulk solution; therefore, the hydrolytic rate should have significantly decreased with peptide assembly to the QD due to a lower collision frequency. In addition, such a system should closely follow a classic MM progress curve over the full time course. These considerations seem to preclude a colliding mode of trypsin activity.
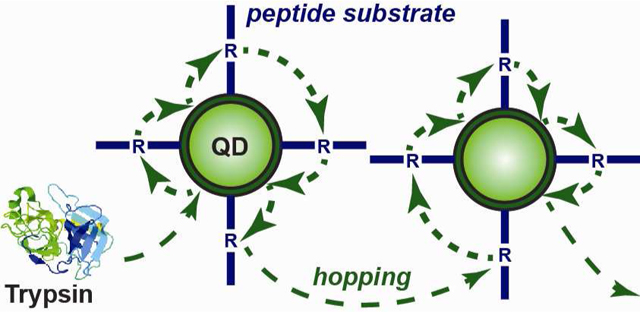
An alternate explanation for the initial rate enhancement with increasing conjugate valence is that, with each collision, weak association between the trypsin and the QD interface resulted in the consumption of multiple substrates before translocation of trypsin elsewhere—a hopping mode of trypsin activity. PEG is known to have weak and reversible interactions with proteins,43,44 and favorable interactions between trypsin and PEG have been reported.45 It has been shown that QDs of the size used here can support the self-assembly of 50 ± 10 peptides46 and, since we used ≤13 peptides per QD, PEGylated surface remained exposed at the QD interface. The primary distinction between scooting and hopping is a non-zero off-rate between the enzyme and NP interface. The known interactions between PEG and trypsin are much more consistent with hopping activity.
A hopping mode of activity also provides a rationale for the negative departures from classical MM trajectories at later times in Fig. 4. At early times in the assay, trypsin encounters and transiently associates with polyvalent QDs by virtue of the high local concentration of substrate at the QD interface and/or affinity for the PEGylated interface. The result is an enhanced initial rate of digestion compared to substrate in bulk solution. However, the ratio of enzyme-to-QD in these experiments is generally ≤ 1:1 and, as a majority of the peptide substrate is digested, the trypsin more frequently encounters and transiently associates with QDs that are effectively devoid of substrate. The result is a decrease in the digestion rate compared to that anticipated from the initial rate, which is associated with a predominance of substrate-rich QDs. This is supported by control experiments with the tryptic digestion of BANA in the presence and absence of QDs (see SI), which showed different progress curve trajectories and a similar tailing effect, further suggesting that the QD interface is not a spectator during digestion. It is within this context that we interpret as an approximate measure of affinity between trypsin and the QD-peptide substrate conjugate as a whole. The structure in Fig. 6 was derived from experimental FRET data and indicated that trypsin had the potential to bind the peptide substrate without contacting the QD or deeply penetrating the surrounding PEG coating. This spacing, coupled with the neutrality and favorable aqueous solvation of PEG, suggests that the local ionic strength and pH should differ minimally from bulk solution. Thus, in the absence of allosteric effects, the assumption of invariant between substrate in bulk solution and substrate conjugated to the QD should be a good approximation. The Mrksich Group has similarly suggested that the catalytic influence of a PEG layer on a bulk interface modified with substrate for cutinase is likely reflected in rather than .47 Potential allosteric effects cannot be dismissed, however, as the direct modification of trypsin with PEG has been reported to decrease but also increase to a degree sufficient for a 2–6-fold improvements in 45 Nonetheless, given the potential for trypsin to bind the substrate in a solution-like environment, any allosteric effects will be a consequence of its affinity for the PEG coating on the QDs. In the context of a hopping mode, is thus an empirical parameter that reflects the role of the QD interface in mediating catalysis, and uses activity in bulk solution as a point of comparison. The lower values of for the QD-peptide substrate conjugates compared to for the peptide alone (see Table 1) reflect the observed increase in trypsin activity from greater affinity for the conjugates. In analogy with a study by the Mrksich Group on the effect of co-localizing enzyme and substrate at a bulk interface,48 we suggest that the QD interface acts as an exosite that promotes catalytic activity. It is likely that this occurs by mediation of enzyme-substrate binding through localization of both trypsin and peptide within a nanoscale volume around the QD interface.
Hopping effects are unlikely to be limited to the activity of trypsin or other proteases, and could be a general property of enzymatic catalysis using polyvalent substrates assembled to NPs. Indeed, a recent communication of enhanced nuclease activity at polyvalent gold NP-oligonucleotide conjugates suggests another system where a hopping mode of activity may be applicable.49 Our results also suggest that the physical properties of the QD interface (e.g. hydrophobicity, polarity, charge) may strongly affect the degree of hopping observed in an enzyme specific manner. While the kinetic framework we present here was necessarily limited to a PEGylated surface as a representative starting point, there is good reason to expect complex interfacial effects. The Rotello group has reported changes in chymotrypsin activity (with a solution-phase substrate) resulting from enzyme adsorption on gold NPs with a range of surface properties.50 Our results similarly suggest several avenues for detailed future studies that focus on how interfacial properties can be tailored to rationally tune enzyme activity at NP-substrate conjugates. This greater understanding may lead to more sensitive and/or more selective diagnostic probes for clinically relevant protease activity, for example, with the QD-peptide conjugates used for sensing the activity of matrix metallproteinases.9, 51, 52
This study has shown that an enhancement of enzyme activity is also possible at polyvalent NP-bioconjugates. The development of a real-time, FRET-based kinetic assay permitted quantitative tracking of enzyme-catalyzed reaction progress curves for the first time. This approach revealed mechanistic features not readily accessible in standard endpoint assays. An integrated form of the classic MM model, which was first validated with a non-nanoparticle substrate, did not provide a full description of the reaction with QD-peptide substrate conjugates. The data, which included an increasing initial rate of proteolysis with increasing conjugate valence, was consistent with a hopping mode of proteolysis at the QD interface. Since this behavior is expected to be recurrent with other NP-enzyme systems, there is a need for new, quantitative models that relate hopping modes of activity to real values of , (and other physically relevant constants) rather than effective or ‘black box’ values in the context of the classic MM model. Such models must fit the full course of progress curves, and also address the inability of bulk concentrations of enzyme and substrate to account for NPs as diffusing entities, conjugated substrates as reactive sites, and the association of enzyme with both. Further analysis of the behavior of different types of enzymes acting on a series of distinct NP-substrate conjugate interfaces may allow for a better understanding of the underlying kinetic mechanisms common to such materials, the important but subtle contributions of the NP interface, and an improved capacity for rationally designing biological tools based on NPs.
Supplementary Material
Acknowledgements.
The authors acknowledge NRL, NRL NSI, ONR, and DTRA-JSTO MIPR # B112582M for financial support. WRA is grateful to the Natural Sciences and Engineering Research Council of Canada (NSERC) for a postdoctoral fellowship. JBB-C acknowledges a Marie Curie IOF. Molecular graphics were produced using the Chimera package from the Resource for Biocomputing, Visualization, and Informatics at the U.C. San Francisco (supported by NIH P41 RR-01081).
Footnotes
Supporting Information Available: Detailed materials and methods, details of data analysis, design of the peptide substrate and structural simulation, spectral overlap integrals and Förster distances, full data for validation with BANA substrate, data on non-specific adsorption and FRET calibration curves, full data for digestion of peptide substrates and QD-peptide conjugates. This material is available free of charge via the Internet at http://pubs.acs.org.
References
- 1.Wang X; Ramstrom O; Yan MD Anal Chem 2010, 82, 9082–9089. [DOI] [PMC free article] [PubMed] [Google Scholar]
- 2.Tassa C; Duffner JL; Lewis TA; Weissleder R; Schreiber SL; Koehler AN; Shaw SY Bioconj Chem 2010, 21, 14–19. [DOI] [PMC free article] [PubMed] [Google Scholar]
- 3.Liu LH; Xu KJ; Wang HY; Tan PKJ; Fan WM; Venkatraman SS; Li LJ; Yang YY Nat Nanotechnol 2009, 4, 457–463. [DOI] [PubMed] [Google Scholar]
- 4.Algar WR; Tavares AJ; Krull UJ Anal Chem Acta 2010, 673, 1–25. [DOI] [PubMed] [Google Scholar]
- 5.Medintz IL; Mattoussi H. Phys Chem Chem Phys 2009, 11, 17–45. [DOI] [PubMed] [Google Scholar]
- 6.Zrazhevskiy P; Sena M; Gao XH Chem SocRev 2010, 39, 4326–4354. [DOI] [PMC free article] [PubMed] [Google Scholar]
- 7.Sapsford KE; Farrell D; Sun S; Rasooly A; Mattoussi H; Medintz IL Sens Actuat B Chem 2009, 139, 13–21. [Google Scholar]
- 8.Boeneman K; Mei BC; Dennis AM; Bao G; Deschamps JR; Mattoussi H; Medintz IL J Am Chem Soc 2009, 131, 3838–3829. [DOI] [PMC free article] [PubMed] [Google Scholar]
- 9.Medintz IL; Clapp AR; Brunel FM; Tiefenbrunn T; Uyeda HT; Chang EL; Deschamps JR; Dawson PE; Mattoussi H. Nat Mater 2006, 5, 581–589. [DOI] [PubMed] [Google Scholar]
- 10.Shi LF; Rosenzweig N; Rosenzweig Z. Anal Chem 2007, 79, 208–214. [DOI] [PubMed] [Google Scholar]
- 11.Choi Y; Lee J; Kim K; Kim H; Sommer P; Song R. Chem Commun 2010, 46, 9146–9148. [DOI] [PubMed] [Google Scholar]
- 12.Sapsford KE; Granek J; Deschamps JR; Boeneman K; Blanco-Canosa JB; Dawson PE; Susumu K; Stewart MH; Medintz IL ACS Nano 2011, 5, 2687–2699. [DOI] [PubMed] [Google Scholar]
- 13.Prasuhn DE; Feltz A; Blanco-Canosa JB; Susumu K; Stewart MH; Mei BC; Yakovlev AV; Loukov C; Mallet JM; Oheim M; Dawson PE; Medintz IL ACS Nano 2010, 4, 5487–5497. [DOI] [PubMed] [Google Scholar]
- 14.Lehninger AL; Nelson DL; Cox MM, Principles of Biochemistry. Second ed.; Worth Publishers: New York, 1993. [Google Scholar]
- 15.Marangoni AG, Enzyme Kinetics: A Modern Approach. John Wiley & Sons, Inc.: Hoboken, 2003. [Google Scholar]
- 16.McNaught AD; Wilkinson A, IUPAC Compendium of Chemical Terminology (the “Gold Book”). 2nd ed.; Blackwell Scientific Publications: Oxford, 1997. [Google Scholar]
- 17.Purich DL, Enzyme Kinetics: Catalysis & Control. Elsevier: Burlington, 2010. [Google Scholar]
- 18.Moreno J. Biochem Ed 1985, 13, 64–66. [Google Scholar]
- 19.Dabbousi BO; Rodriguez-Viejo J; Mikulec FV; Heine JR; Mattoussi H; Ober R; Jensen KF; Bawendi MG J Phys Chem B 1997, 101, 9463–9475. [Google Scholar]
- 20.Susumu K; Oh E; Delehanty JB; Blanco-Canosa JB; Johnson BJ; Jain V; Hervey WJ; Algar WR; Boeneman K; Dawson PE; Medintz IL J Am Chem Soc 2011, 133, 9480–9496. [DOI] [PubMed] [Google Scholar]
- 21.Mei BC; Susumu K; Medintz IL; Delehanty JB; Mountziaris TJ; Mattoussi H. J Mater Chem 2008, 18 4949–4958 [Google Scholar]
- 22.Mei BC; Susumu K; Medintz IL; Mattoussi H. Nat Protocols 2009, 4, 412–423. [DOI] [PubMed] [Google Scholar]
- 23.Schnolzer M; Alewood P; Jones A; Alewood D; Kent SB Int J Pept Protein Res 1992, 40, 180–93. [DOI] [PubMed] [Google Scholar]
- 24.Lakowicz JR, Principles of Fluorescence Spectroscopy. 3rd ed.; Springer: New York, 2006. [Google Scholar]
- 25.Golicnik M. Anal Biochem 2010, 406, 94–96. [DOI] [PubMed] [Google Scholar]
- 26.Prasuhn DE; Blanco-Canosa JB; Vora GJ; Delehanty JB; Susumu K; Mei BC; Dawson PE; Medintz IL ACS Nano 2010, 4, 267–278. [DOI] [PMC free article] [PubMed] [Google Scholar]
- 27.Sapsford KE; Pons T; Medintz IL; Higashiya S; Brunel FM; Dawson PE; Mattoussi H. J Phys Chem C 2007, 111, 11528–11538. [Google Scholar]
- 28.Pons T; Medintz IL; Wang X; English DS; Mattoussi H. J Am Chem Soc 2006, 128, 15324–15331. [DOI] [PubMed] [Google Scholar]
- 29.Briggs GE; Haldane JBS Biochem J 1925, 19, 338–339. [DOI] [PMC free article] [PubMed] [Google Scholar]
- 30.Duggleby RG Methods 2001, 24, 168–174. [DOI] [PubMed] [Google Scholar]
- 31.Mathews CK; Holde KEV; Ahern KG, Biochemistry. 3 ed.; Benjamin Cummings: San Francisco, 2000. [Google Scholar]
- 32.Eisenthal R; Danson MJ; Hough DW Trends Biotechnol. 20, 25, 247–249. [DOI] [PubMed] [Google Scholar]
- 33.Ute T; Asahara M; Tsuchikura H. Clin Chem 1970, 16, 322–330. [PubMed] [Google Scholar]
- 34.Li, J.; Zhang, C.; Xu, X.; Wang, J.; Yang, H.; Xu, C.; Ma, D.; Wang, Y.; Gong, W.; Lai, R., doi: 10.2210/pdb2o9q/pdb. [DOI]
- 35.Caprioli RM; Smith L. Anal Chem 1986, 58, 1080–1083. [Google Scholar]
- 36.Coombs GS; Rao MS; Olson AJ; Dawson PE; Madison EL JBiol Chem 1999, 274, 24074–24079. [DOI] [PubMed] [Google Scholar]
- 37.Foose LL; Blanch HW; Radke CJ Langmuir 2008, 24, 7388–7393. [DOI] [PubMed] [Google Scholar]
- 38.Lee HJ; Wark AW; Goodrich TT; Fang S; Com RM Langmuir 2005, 21, 4050–4057. [DOI] [PubMed] [Google Scholar]
- 39.Lagerholm BC; Thompson NL Biophys J 1998, 74, 1215–1228. [DOI] [PMC free article] [PubMed] [Google Scholar]
- 40.Lagerholm BC; Thompson NL J Phys Chem B 2000, 104, 863–868. [Google Scholar]
- 41.Wang D; Gou SY; Axelrod D. Biophys Chem 1992, 43, 117–137. [DOI] [PubMed] [Google Scholar]
- 42.Berg OG; Yu BZ; Rogers J; Jain MK Biochem 1991, 30, 7283–7297. [DOI] [PubMed] [Google Scholar]
- 43.Mathis R; Hubert P; Dellacherie E. J Chromat 1989, 474, 396–399. [Google Scholar]
- 44.Ling TGI; Mattiasson B. J Chromat 1983, 254, 83–89. [Google Scholar]
- 45.Gaertner HF; Puigserver AJ Enzyme Microb Technol 1992, 14, 150–155. [DOI] [PubMed] [Google Scholar]
- 46.Prasuhn DE; Deschamps JR; Susumu K; Stewart MA; Boeneman K; Blanco-Canosa JB; Dawson PE; Medintz IL Small 2009, 6, 555–564. [DOI] [PubMed] [Google Scholar]
- 47.Nayak S; Yeo WS; Mrksich M. Langmuir 2007, 23, 5578–5583. [DOI] [PMC free article] [PubMed] [Google Scholar]
- 48.Li J; Nayak S; Mrksich M. J Phys Chem B 2010, 114, 15113–15118. [DOI] [PMC free article] [PubMed] [Google Scholar]
- 49.Prigodich AE; Alhasan AH; Mirkin CA J Am Chem Soc 2011, 133, 2120–2123. [DOI] [PMC free article] [PubMed] [Google Scholar]
- 50.You CC; De M; Han G; Rotello VM J Am Chem Soc 2005, 127, 12873–12881. [DOI] [PubMed] [Google Scholar]
- 51.Shi L; DePaoli V; Rosenzweig N; Rosenzweig Z. J. Am. Chem. Soc 2006, 128, 10378–10379. [DOI] [PubMed] [Google Scholar]
- 52.Xia Z; Xing Y; So MK; Koh AL; Sinclair R; Rao J. Anal. Chem 2008, 80, 8649–8655. [DOI] [PMC free article] [PubMed] [Google Scholar]
Associated Data
This section collects any data citations, data availability statements, or supplementary materials included in this article.


