Abstract
The taste quality of oolong tea generated from leaves of Camellia sinensis L. cultivated in the same mountain area is positively correlated to the cultivation altitude, partly due to the inverse correlation with the astringency of the tea infusion. The astringency of oolong tea mostly results from the presence of polyphenolic compounds, mainly catechins and their derivatives. Four catechins, (−)-epicatechin (EC) and (−)-epigallocatechin (EGC) together with their gallate derivatives (with relatively high astringency), (−)-EC gallate (ECG) and (−)-EGC gallate (EGCG), were detected as major compounds in oolong tea. The degrees of catechin galloylation, designated as ECG/(EC + ECG) and EGCG/(EGC + EGCG), in both oolong tea infusions and their fresh tea leaves, were found to be inversely correlated to the cultivation altitude at 200 m, 800 m, and 1300 m. A similar inverse correlation was observed when seven more oolong tea infusions and seven more fresh leaves harvested at altitude ranging from 170 m to 1600 m were recruited for the analyses. Moreover, catechin contents in oolong tea infusions were also found to be inversely correlated to the cultivation altitude. It is proposed that catechin content and the degree of its galloylation account for, at least partly, the inverse correlation between the astringency of oolong tea and the cultivation altitude.
Keywords: Astringency, Catechin, Cultivation altitude, Galloylation, Oolong tea
1. Introduction
Various teas have been consumed in the world for thousands of years, and many compounds in tea infusions have been identified with beneficial health functions [1–3]. They are mainly classified into green tea (unfermented), oolong tea (semi-fermented), and black tea (fully fermented) according to the degree of fermentation during their preparations, where the term “fermentation” refers to natural browning reactions induced by oxidative enzymes in the cells of tea leaves [4]. Oolong tea possessing a taste and color somewhere between green and black teas is the most popular tea in Taiwan [5,6]. The final fermentation degree of oolong tea is empirically controlled by experts during the semi-fermentation process, and usually ranges from 20% to 80%, depending on the demand of customers [7,8]. The taste quality of oolong tea infusion depends on several properties, such as smell of volatile fragrance, sensation of sweet or umami, and intensity of astringency.
Saliva contains diverse types of proteins that participate in the protection of the oral tissues against microorganisms and the lubricity of oral cavity [9]. Astringency perception, the complicated mouth-feel of rough, drying, puckering, shrinking, and tightening, is induced by polyphenolic compounds (tannins) mostly found in fruits and beverages of plant sources, such as red wines and teas [10]. The astringent taste results from the interaction of tannins with a specialized type of salivary proteins termed proline-rich proteins; the tannin-protein complexes consequently aggregate and precipitate, leading to the loss of lubricity in the oral cavity, and thus inducing the rough drying sensation in the mouth [11].
The astringency of tea is attributed to the presence of polyphenolic compounds, such as flavan-3-ols (catechins), flavon-3-ol glycosides, theaflavins, and thearubigins [12,13]. Among these polyphenolic compounds, two major types of catechins, (−)-epicatechin (EC) and (−)-epigallocatechin (EGC) together with their gallate derivatives, (−)-EC gallate (ECG) and (−)-EGC gallate (EGCG) comprise approximately 80% of total polyphenolic compounds in the infusion of green or oolong tea, and thus are assumed to be the major constituents responsible for the astringency of tea [14]. In comparison with their parent catechins (EC and EGC), the gallate derivatives (ECG and EGCG) are found to possess relatively reduced solubility and increased astringency [12,15]. In other words, a higher degree of catechin galloylation in tea leaves tends to trigger a stronger astringency of their corresponding tea infusions.
The quality of oolong tea generated from leaves of Camellia sinensis L. cultivated in the same mountain area of Center Taiwan is positively correlated to the cultivation altitude. Empirically, the astringency of tea infusion is inversely correlated to the cultivation altitude, i.e., the higher the altitude the tea plants are cultivated at, the less astringency the infusion of their consequent oolong tea is perceived. We wonder if the inverse correlation between tea astringency and cultivation altitude may result from, at least partly, the degree of catechin galloylation as well as the total catechin content in oolong tea. To test this speculation, catechin contents and the degrees of its galloylation in both oolong tea infusions and fresh tea leaves cultivated at altitudes ranging from 170 m to 1600 m were examined.
2. Methods
2.1. Chemicals and materials
(−)-EC, (−)-EGC, (−)-EC gallate (ECG), and (−)-EGC gallate (EGCG) [high performance liquid chromatography (HPLC) ≥98%] were purchased from QualiFlex Co. (Taipei, Taiwan). Caffeine (≥99%) was obtained from Merck KGaA (Darmstadt, Germany). Acetic acid (99.7%) was purchased from J. T Baker (Mallinckrodt Baker, Inc., Phillipsburg, NJ, USA). Acetonitrile (HPLC grade) was obtained from Thermo Fisher Scientific (Waltham, MA, USA). Water was purified by a Millipore clear water purification system (Millipore Direct-Q, Millipore, Bedford, MA, USA).
All of the fresh tea leaves and oolong tea granules were obtained from the same tea plant cultivar, Camellia sinensis L., Chin-Shin oolong, grown at different altitudes in the same mountain area of Center Taiwan in November 2012 and December 2012. Both fresh tea leaves (with young green shoots used for the preparation of oolong tea) and their consequent oolong tea granules were obtained from three tea farms at altitudes of 200 m, 800 m, and 1300 m, respectively. In addition, seven more fresh leaves from altitudes of 220 m, 400 m, 1000 m, 1200 m, 1350 m, 1550 m, and 1600 m, as well as seven more oolong tea granules from altitudes of 170 m, 850 m, 900 m, 950 m, 1100 m, 1500 m, and 1600 m were collected for the following analysis.
2.2. Preparation of the extract of fresh tea leaves and infusion of oolong tea granules
Fresh tea leaves (young green shoots) of approximately 10 g were ground in liquid nitrogen and then extracted with 30 mL of water at 90 °C for 30 minutes [16]. The extract was filtered by filter paper, and the extraction was repeated twice. The three extracts were combined and powderized by the Labconco FreeZone 6 Plus Lyophilizer (Kansas City, MO, USA). For the HPLC analysis, 10 mg of the extract powder was dissolved in 1 mL of water and filtered through a 0.45 μm polyvinylidene difluoride (PVDF) membrane filter (Pall Corporation, Glen Cove, NY, USA). Tea infusions were prepared by adding 100 mL of boiling water to 5 g of oolong tea granules [8]. After 6 minutes, the brew was filtered through the PVDF membrane filter, and used for the HPLC analysis.
2.3. HPLC analysis
Fresh leaf extracts and oolong tea infusions were analyzed on a liquid chromatography system coupled to a Model 600E photodiode array detector (Waters Corporation, Milford, MA, USA) and performed using a Mightysil RP-18 GP column, 250 mm × 4.6 mm i.d., 5 μm (Kanto Chemical Co., Tokyo, Japan). The mobile phase consisted of (A) water containing 0.5% acetic acid and (B) acetonitrile. The program for gradient elution which started at 95% solvent A and 5% solvent B, increased linearly to 70% A and 30% B in 100 minutes [5]. In all experiments, the column was kept at room temperature, the flow rate was 1 mL/minute, and the injection volumes were 10 μL for the fresh leaf extracts and 15 μL for the oolong tea infusions, respectively. The UV absorbance detection wavelength was set at 280 nm.
2.4. Identification and quantitation of catechins
The four major catechins, EC, EGC, ECG, and EGCG, as well as caffeine in the HPLC analysis of tea samples were identified according to the same procedure as described previously [16]. To establish linear standard regression equations of the four catechins, standard solutions (5 μL each) of a serial dilution of known catechin concentrations, EC (0.02–0.80 mM), ECG (0.01–0.40 mM), EGC (0.20–8.00 mM), and EGCG (0.10–6.00 mM), were loaded onto HPLC and the cover areas of the peaks were recorded. The contents of the four catechins in the HPLC analysis of tea samples were quantitated by using the linear standard regression equations. Data were expressed as mean ± SE of three replicates, and the analysis of variance (two-way analysis of variance) was performed on Microsoft Excel 2007. Differences were considered statistically significant at p < 0.05 and p < 0.01.
3. Results
3.1. Comparison of catechins in oolong tea infusions and their corresponding fresh tea leaves cultivated at three different altitudes
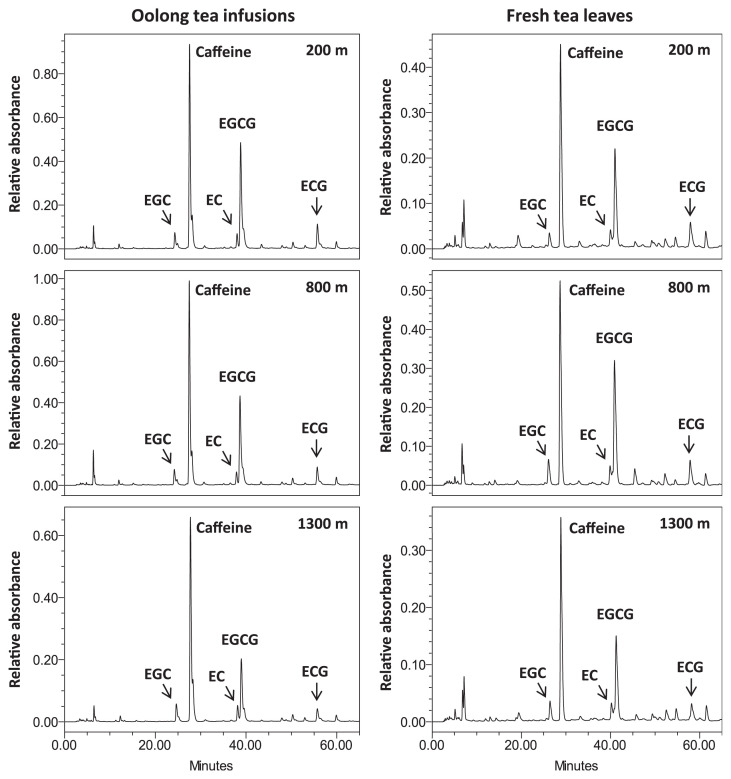
In the past 2 decades, the same tea plant cultivar, Camellia sinensis L., Chin-Shin oolong, has been cultivated at different altitudes ranging from 150 m to 1600 m in the same mountain area of central Taiwan, and used to generate oolong tea granules under almost the same preparation processes, although tea leaves harvested from relatively low altitudes tend to be prepared under a slightly higher degree of fermentation. Thus, the fresh tea leaves and their corresponding oolong tea granules in this mountain area provide adequate sources to evaluate the effects of cultivation altitude on the characteristics of oolong tea. To explore the fluctuation of catechin contents in oolong teas generated at different cultivation altitudes, three oolong tea infusions, together with their corresponding fresh tea leaves, cultivated at altitudes of 200 m, 800 m, and 1300 m were collected and analyzed. Regardless of cultivation altitude, similar patterns were observed for the six HPLC profiles, showing that four catechins, EC, ECG, EGC, and EGCG, comprised the major phenolic compounds in both oolong tea infusions and fresh tea leaves, although the relative contents of these four catechins varied substantially in these samples (Fig. 1). In agreement with previous reports [5,14,17,18], these four catechins represent approximately 80% of total polyphenolic compounds in the oolong tea infusions, as well as in the fresh tea leaves.
Fig. 1.
Liquid chromatography profiles (0–65 minutes) of oolong tea infusions and fresh tea leaves cultivated at altitudes of 200 m, 800 m, and 1300 m at 280 nm. Caffeine and the four major catechins, (−)-epicatechin (EC), (−)-epigallocatechin (EGC), (−)-EC gallate (ECG), and (−)-EGC gallate (EGCG) are indicated.
3.2. The degree of catechin galloylation in oolong teas
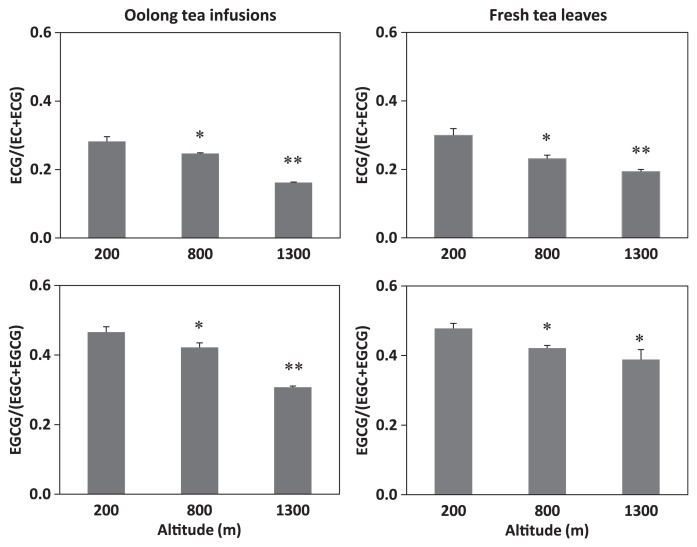
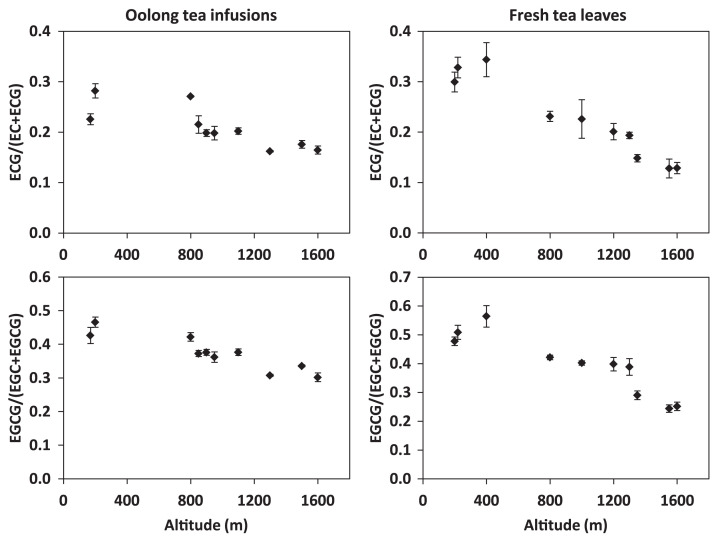
To examine the degree of catechin galloylation in both oolong tea infusions and their corresponding fresh tea leaves cultivated at altitude of 200 m, 800 m, and 1300 m, values of ECG/(EC + ECG) and EGCG/(EGC + EGCG) were calculated. The calculations showed that the degree of catechin galloylation in both tea infusions and leaves was inversely correlated to the cultivation altitude (Fig. 2). To further verify this inverse correlation, seven more oolong tea infusions and seven more fresh tea leaves harvested at altitudes ranging from 170 m to 1600 m were recruited for the analyses. The results showed that the trend of inverse correlation between the degree of catechin galloylation and cultivation altitude was fundamentally observed in the 10 oolong tea infusions, as well as in the 10 fresh tea leaves (Fig. 3). It seems that the degree of catechin galloylation in oolong tea leaves cultivated at a lower altitude is higher than that in oolong tea leaves cultivated at a higher altitude.
Fig. 2.
Degree of catechin galloylation in oolong tea infusions and their corresponding fresh tea leaves cultivated at altitudes of 200 m, 800 m, and 1300 m. Degree of catechin galloylation was calculated as (−)-epicatechin gallate (ECG)/(EC + ECG) and (−)-epigallocatechin gallate (EGCG)/(EGC + EGCG). Data are presented as mean ± standard error of the mean of three replicates. *p < 0.05, **p < 0.01 versus altitude of 200 m.
Fig. 3.
Degree of catechin galloylation in 10 oolong tea infusions and 10 fresh tea leaves cultivated at altitudes ranging from 170 m to 1600 m. Degree of catechin galloylation was calculated as (−)-epicatechin gallate (ECG)/(EC + ECG) and (−)-epigallocatechin gallate (EGCG)/(EGC + EGCG). Data are presented as mean ± standard error of three replicates.
3.3. Catechin contents in oolong teas
As the total content of catechins might affect the astringency of tea, the contents of the four catechins, EC, ECG, EGC, and EGCG in the 10 oolong tea infusions were analyzed. The data showed that the overall trends of contents of the four catechins in oolong teas, particularly of EGCG, were inclined to decrease when the cultivation altitude was elevated; consequently, the total content of catechins in oolong tea is apparently inversely correlated to cultivation altitude (Table 1).
Table 1.
Catechin [(−)-epicatechin (EC), (−)-epigallocatechin (EGC), (−)-EC gallate (ECG), and (−)-EGC gallate (EGCG)] contents in oolong tea infusions of different cultivation altitudes.
| Catechins (mM) | Altitude (m) | |||||||||
|---|---|---|---|---|---|---|---|---|---|---|
|
| ||||||||||
| 170 | 200 | 800 | 850 | 900 | 950 | 1100 | 1300 | 1500 | 1600 | |
| EC | 0.49 ± 0.12 | 0.45 ± 0.08 | 0.36 ± 0.04 | 0.30 ± 0.02 | 0.34 ± 0.03 | 0.32 ± 0.10 | 0.34 ± 0.05 | 0.37 ± 0.01 | 0.35 ± 0.02 | 0.28 ± 0.07 |
| ECG | 0.15 ± 0.04 | 0.18 ± 0.03 | 0.12 ± 0.01 | 0.08 ± 0.01 | 0.09 ± 0.01 | 0.08 ± 0.03 | 0.09 ± 0.01 | 0.07 ± 0.01 | 0.07 ± 0.01 | 0.05 ± 0.01 |
| EGC | 2.56 ± 0.29 | 2.3 ± 0.34 | 2.21 ± 0.37 | 2.03 ± 0.18 | 2.00 ± 0.24 | 1.91 ± 0.50 | 1.93 ± 0.14 | 1.90 ± 0.08 | 1.95 ± 0.06 | 1.57 ± 0.33 |
| EGCG | 1.92 ± 0.41 | 2.01 ± 0.30 | 1.61 ± 0.24 | 1.21 ± 0.10 | 1.20 ± 0.11 | 1.08 ± 0.27 | 1.17 ± 0.12 | 0.85 ± 0.04 | 0.99 ± 0.02 | 0.67 ± 0.10 |
| Total | 5.12 ± 0.86 | 4.93 ± 0.74 | 4.30 ± 0.66 | 3.62 ± 0.27 | 3.64 ± 0.38 | 3.39 ± 0.88 | 3.53 ± 0.31 | 3.19 ± 0.14 | 3.36 ± 0.10 | 2.58 ± 0.51 |
Data are mean ± standard error of three replicates.
4. Discussion
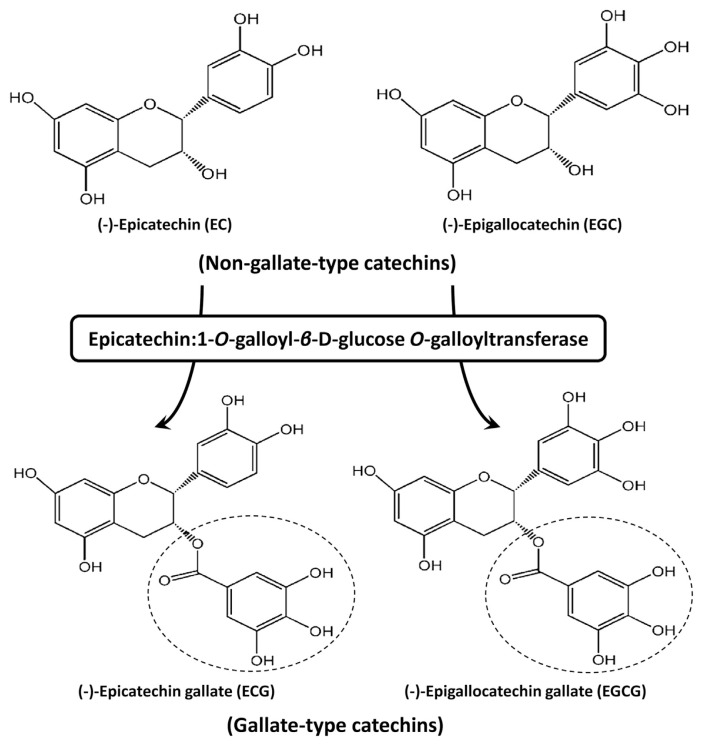
Catechins are biosynthesized through the flavonoid pathway, and several enzymes, such as leucoanthocyanidin reductase (LAR, EC 1.17.1.3) and anthocyanidin reductase (ANR, EC 1.17.1.3), play a key role in their formation [19]. According to Table 1, the total catechin contents were inclined to decrease when the cultivation altitude was elevated. Nongallate-type catechins are converted from leucoanthocyanidins and anthocyanidins by LAR and ANR, respectively [20]. Gallate-type catechins seem to be formed by esterification with gallic acid (firstly converted to β-glucogallin by galloyl-1-O-β-D-glucosyltransferase prior to reaction) to nongallate-type catechins, presumably via a specialized enzymatic reaction catalyzed by EC:1-O-galloyl-β-D-glucose O-galloyltransferase (ECGT) [21,22]. According to this biosynthetic pathway, ECG and EGCG are putatively derived from galloylation of EC and EGC (Fig. 4). Therefore, the relative contents of nongallate-type catechins (EC and EGC) and gallate-type catechins (ECG and EGCG) in oolong tea leaves are possibly dependent on the degree of catechin galloylation controlled by the activity of the specialized enzyme, ECGT, as well as the kinetic transformation of total catechin contents.
Fig. 4.
Chemical structures of (−)-epicatechin (EC), (−)-EC gallate (ECG), (−)-epigallocatechin (EGC), and (−)-EGC gallate (EGCG) and the putative galloylation catalyzed by the specialized enzyme, epicatechin:1-O-galloyl-β-D-glucose O-galloyltransferase. Gallate-type catechins (ECG and EGCG) are derived from nongallate-type catechins (EC and EGC) via esterification with gallic acid (indicated by broken circles in the structures of ECG and EGCG).
It has been determined in vitro that a high level of the enzymatic activity of ECGT was detected over a broad range of 20–50°C, with the optimum temperature at 30°C [19]. In November and December in the mountain areas of central Taiwan, the high and low temperatures in the day and night time are around 25–30°C and 15–20°C, respectively, at an altitude of 200 m, 20–25°C and 10–15°C, respectively, at an altitude of 800 m, and 10–20°C and 5–10°C, respectively, at an altitude of 1600 m. Taken together, it is likely that the enzymatic activity of ECGT in oolong tea leaves cultivated in the mountain areas of Central Taiwan declines along with the elevation of cultivation altitude in this period of time. The putative attenuation of ECGT activity in oolong tea leaves, along with the elevation of cultivation altitude, seems to be in agreement with the inverse correlation between the degree of catechin galloylation and cultivation altitude observed in this study.
It has been generally accepted and supported by experimental examination that astringency results from the interaction of tannins and salivary proteins, leading to the precipitation of tannin-protein complexes in the oral cavity [23–25]. As expected, the strength of interaction and precipitation of tannin-protein complexes, proportional to the intensity of astringency, tends to positively depend on the concentration of tannins as observed in several assessments in vitro [26–28]. Therefore, a lower content of catechins in oolong tea seems to result in a lower perception of astringency. It is likely that the inverse correlation between catechin content in oolong tea and cultivation altitude observed in this study may partly account for the empirical tasting for the inverse correlation between tea astringency and cultivation altitude.
It has been noticed that a higher degree of galloylation of catechin contents in oolong tea leads to a stronger astringency perception [15]. Similarly, an enhanced astringency sensation (with increased rudeness, coarseness, drying, and chalkiness) was perceived with an increased degree of galloylation in a formal sensory descriptive analysis study [29]. Thus, a lower degree of catechin galloylation in oolong tea tends to cause a lower astringency perception. Presumably, the inverse correlation between the degree of catechin galloylation in oolong tea and cultivation altitude observed in this study may also partly account for the inverse correlation between tea astringency and cultivation altitude.
Acknowledgments
The work was supported by a grant from the National Science Council, Taiwan, R.O.C. (NSC 100-3114-B-005-001 to J.T.C.T.).
Funding Statement
The work was supported by a grant from the National Science Council, Taiwan, R.O.C. (NSC 100-3114-B-005-001 to J.T.C.T.).
Footnotes
Conflicts of interest
All authors declare no conflicts of interest.
REFERENCES
- 1. Yukihiko H. Elucidation of physiological functions of tea catechins and their practical applications. J Food Drug Anal. 2012;20:296–300. [Google Scholar]
- 2. Chung SY, Huanyu J, Fei G, et al. Cancer preventive activities of tea polyphenols. J Food Drug Anal. 2012;20:318–22. [Google Scholar]
- 3. Tsutomu N, Takeshi I, Yoshinori U, et al. Interaction of tea catechins with phospholipids – roles in their tastes and biological activities. J Food Drug Anal. 2012;20:305–8. [Google Scholar]
- 4. Higdon JV, Frei B. Tea catechins and polyphenols: health effects, metabolism, and antioxidant functions. Crit Rev Food Sci Nutr. 2003;43:89–143. doi: 10.1080/10408690390826464. [DOI] [PubMed] [Google Scholar]
- 5. Lee VSY, Dou J, Chen RJY, et al. Massive accumulation of gallic acid and unique occurrence of myricetin, quercetin and kaempferol in preparing old oolong tea. J Agric Food Chem. 2008;56:7950–6. doi: 10.1021/jf801688b. [DOI] [PubMed] [Google Scholar]
- 6. Kuo PC, Lai YY, Chen YJ, et al. Changes in volatile compounds upon aging and drying in oolong tea production. J Sci Food Agric. 2011;56:293–301. doi: 10.1002/jsfa.4184. [DOI] [PubMed] [Google Scholar]
- 7. Haslam E. Thoughts on thearubigins. Phytochemistry. 2003;64:61–73. doi: 10.1016/s0031-9422(03)00355-8. [DOI] [PubMed] [Google Scholar]
- 8. Chen YJ, Kuo PC, Yang ML, et al. Effects of baking and aging on the changes of phenolic and volatile compounds in the preparation of old Tieguanyin oolong teas. Food Res Int. 2013;53:732–43. [Google Scholar]
- 9. Nieuw Amerongen AV, Veerman EC. Current therapies for xerostomia and salivary gland hypofunction associated with cancer therapies. Support Care Cancer. 2003;11:226–31. doi: 10.1007/s00520-002-0409-5. [DOI] [PubMed] [Google Scholar]
- 10. Soares S, Vitorino R, Osório H, et al. Reactivity of human salivary proteins families toward food polyphenols. J Agric Food Chem. 2011;59:5535–47. doi: 10.1021/jf104975d. [DOI] [PubMed] [Google Scholar]
- 11. Ferruzzi MG, Bordenave N, Hamaker BR. Does flavor impact function? Potential consequences of polyphenol-protein interactions in delivery and bioactivity of flavan-3-ols from foods. Physiol Behav. 2012;107:591–7. doi: 10.1016/j.physbeh.2012.02.020. [DOI] [PubMed] [Google Scholar]
- 12. Scharbert S, Holzmann N, Hofmann T. Identification of the astringent taste compounds in black tea infusions by combining instrumental analysis and human bioresponse. J Agric Food Chem. 2004;52:3498–508. doi: 10.1021/jf049802u. [DOI] [PubMed] [Google Scholar]
- 13. Scharbert S, Hofmann T. Molecular definition of black tea taste by means of quantitative studies, taste reconstitution, and omission experiments. J Agric Food Chem. 2005;53:5377–84. doi: 10.1021/jf050294d. [DOI] [PubMed] [Google Scholar]
- 14.Zhen YS. Tea – bioactivity and therapeutic potential. London: Taylor and Francis; 2002. pp. 57–88. [Google Scholar]
- 15. Hayashi N, Chen R, Hiraoka M, et al. Beta-cyclodextrin/surface plasmon resonance detection system for sensing bitter-astringent taste intensity of green tea catechins. J Agric Food Chem. 2010;58:8351–6. doi: 10.1021/jf1012693. [DOI] [PubMed] [Google Scholar]
- 16. Dou J, Lee VS, Tzen JTC, et al. Identification and comparison of phenolic compounds in the preparation of oolong tea manufactured by semifermentation and drying processes. J Agric Food Chem. 2007;55:7462–8. doi: 10.1021/jf0718603. [DOI] [PubMed] [Google Scholar]
- 17. Wang Y, Ho CT. Polyphenolic chemistry of tea and coffee: a century of progress. J Agric Food Chem. 2009;57:8109–14. doi: 10.1021/jf804025c. [DOI] [PubMed] [Google Scholar]
- 18. Ashihara H, Deng WW, Mullen W, et al. Distribution and biosynthesis of flavan-3-ols in Camellia sinensis seedlings and expression of genes encoding biosynthetic enzymes. Phytochemistry. 2010;71:559–66. doi: 10.1016/j.phytochem.2010.01.010. [DOI] [PubMed] [Google Scholar]
- 19. Tounekti T, Joubert E, Hernandez I, et al. Improving the polyphenol content of tea. Crit Rev Plant Sci. 2013;32:192–215. [Google Scholar]
- 20. Rani A, Singh K, Ahuja PS, et al. Molecular regulation of catechins biosynthesis in tea [Camellia sinensis (L.) O. Kuntze] Gene. 2012;495:205–10. doi: 10.1016/j.gene.2011.12.029. [DOI] [PubMed] [Google Scholar]
- 21. Saijo R. Pathway of gallic acid biosynthesis and its esterification with catechins in young tea shoots. Agric Biol Chem. 1983;47:455–60. [Google Scholar]
- 22. Liu YJ, Gao LP, Liu L, et al. Purification and characterization of a novel galloyltransferase involved in catechin galloylation in the tea plant (Camellia sinensis) J Biol Chem. 2012;287:44406–17. doi: 10.1074/jbc.M112.403071. [DOI] [PMC free article] [PubMed] [Google Scholar]
- 23. Bajec MR, Pickering GJ. Astringency: mechanisms and perception. Crit Rev Food Sci Nutr. 2008;48:858–75. doi: 10.1080/10408390701724223. [DOI] [PubMed] [Google Scholar]
- 24. Schwarz B, Hofmann T. Is there a direct relationship between oral astringency and human salivary protein binding? Eur Food Res Technol. 2008;227:1693–8. [Google Scholar]
- 25. Dinnella C, Recchia A, Vincenzi S, et al. Temporary modification of salivary protein profile and individual responses to repeated phenolic astringent stimuli. Chem Senses. 2010;35:75–85. doi: 10.1093/chemse/bjp084. [DOI] [PubMed] [Google Scholar]
- 26. Cala O, Pinaud N, Simon C, et al. NMR and molecular modeling of wine tannins binding to saliva proteins: revisiting astringency from molecular and colloidal prospects. FASEB J. 2010;24:4281–90. doi: 10.1096/fj.10-158741. [DOI] [PubMed] [Google Scholar]
- 27. Soares S, Sousa A, Mateus N, et al. Effect of condensed tannins addition on the astringency of red wines. Chem Senses. 2012;37:191–8. doi: 10.1093/chemse/bjr092. [DOI] [PubMed] [Google Scholar]
- 28. Canon F, Paté F, Cheynier V, et al. Aggregation of the salivary proline-rich protein IB5 in the presence of the tannin EGCG. Langmuir. 2013;29:1926–37. doi: 10.1021/la3041715. [DOI] [PubMed] [Google Scholar]
- 29. Vidal S, Francis L, Guyot S, et al. The mouth-feel properties of grape and apple proanthocyanidins in a wine-like medium. J Sci Food Agric. 2003;83:564–73. [Google Scholar]


