

Abstract
Air liquid interface (ALI) exposure systems are gaining interest, and studies suggest enhanced response of lung cells exposed to particles at ALI as compared to submerged exposure, although the results have been somewhat inconsistent. Previous studies have used monocultures and measured particle deposition using assumptions including consistent particle deposition, particle density, and shape. This study exposed co-cultures of A549 and differentiated THP-1 cells to flame-generated particles using three exposure methods: ALI, pseudo-ALI, and submerged. The dose at ALI was measured directly, reducing the need for assumptions about particle properties and deposition. For all exposure methods an enhanced pro-inflammatory response (TNFα) and Cytochrome P450 (CYP1A1) gene expression, compared to their corresponding negative controls, was observed. ALI exposure induced a significantly greater TNFα response compared to submerged exposure. The submerged exposures exhibited greater induction of CYP1A1 than other exposure methods, although not statistically significant. Some of the factors behind the observed difference in responses for the three exposure methods include differences in physicochemical properties of particles in suspending media, delivered dose, and potential contribution of gas-phase species to cellular response in ALI exposure. However, given the difficulty and expense of ALI exposures, submerged exposure may still provide relevant information for particulate exposures.
Keywords: Cell uptake, electrostatic deposition, pro-inflammatory marker, exposure method, CYP1A1 gene expression, mass dose
Introduction
Combustion particles contribute significantly to urban particulate matter and pose serious health threats, including associations with cardiovascular disease, lung cancer, chronic and acute pulmonary disease, and premature death.[1] Ambient air pollution caused 4.2 million premature deaths worldwide in 2016.[2] Based on WHO reports, in 2019, 99% of the population in the word lived in areas that failed to meet health guidelines.[2]
Research has focused on understanding the links between combustion particle physiochemical properties and biological responses, and in vitro studies have employed different cellular models and exposure methods to explore these effects.[3,4] These in vitro studies have linked combustion particle exposure to increased pro-inflammatory markers, DNA damage, and oxidative stress.[5–8] The traditional in vitro exposure (submerged in vitro) requires particles in suspension. Combustion particles, such as diesel-exhaust particles, are hydrophobic and pose challenges when attempting to expose cells to particle suspensions. For example, studies commonly add a known mass of combustion particles in aqueous media,[9–11] but hydrophobic combustion particles can float, sink, and stick to the walls of vials or plates, leading to inaccurate estimates of particle concentration.[12] Furthermore, particles must travel through the media layer to the cells, and the particle suspension concentration differs from the delivered dose. These factors make determining the delivered dose in submerged exposure systems challenging.
Air liquid interface (ALI) systems can provide a more realistic method for in vitro exposure studies. At ALI, particles are deposited directly from the aerosol phase onto the cells, and particle deposition forces include diffusion, electrostatic, sedimentation, thermophoretic, and condensational growth.[13–18] Direct deposition eliminates the particle collection-resuspension process, which is essential for submerged exposures and is known to change particle physicochemical properties substantially.[19] However, ALI exposures are time consuming and expensive relative to submerged studies. For example, they require inserts for cell growth and a specialized chamber to deposit particles onto the cells. The number of ALI replicates also tends to be limited, as most exposure chambers allow only 12- or 6-well plates. Furthermore, each exposure experiment requires 30 min – four hours to deposit the particles, limiting the size of the experimental matrix (doses and replicates). The protocols for cell growth, maintenance, and exposure, are also not fully optimized, and different researchers follow different protocols, introducing variability when attempting to compare the results of different ALI studies.[20] Accurately measuring particle dose at ALI has also been challenging. The deposited mass is typically estimated by indirect methods,[21,22] which require assumptions about consistent particle deposition rates, particle density and morphology. These uncertainties in dosimetry contribute to difficulties in comparing the results of different studies.[20]
Some studies use pseudo-ALI exposures to understand the toxicological effects of particulate exposures.[23–25] With pseudo-ALI exposures, cells are grown on inserts, and concentrated suspensions of particles are added to the apical side of the insert. These studies tend to be less expensive and time-consuming than ALI but more expensive than submerged exposure. However, to best of our knowledge, no studies have compared pseudo-ALI exposure to submerged and ALI exposure.
Studies comparing ALI to submerged exposure of lung cells to different nanoparticles have reported variable results. For example, at the same mass dose exposure of ZnO nanoparticles to A549 cells, Lenz et al.[13] reported significantly higher IL-8 secretion in submerged exposure than in ALI. However, Loven et al.[26] reported higher IL-8 secretion by A549 cells when exposed to the same mass of ZnO nanoparticle at ALI, rather than submerged exposure. For ambient air pollutant exposure, Volcken et al.[16] reported an enhanced IL-8, HOX-1, and COX-2 mRNA expression profile after 1 hr exposure of normal human bronchial epithelial cells (NHBE) at ALI, at doses much less than for submerged exposure (2 μg/cm2 at ALI versus 7–65 μg/cm2 at submerged). On the other hand, at the same mass dose exposure, Ghio et al.[27] reported diminished response (IL-8, IL-6, HOX-1, COX2 mRNA expression) of NHBE grown under ALI conditions and exposed at pseudo-ALI compared to submerged exposure. The reasons for the apparent difference in response between ALI and submerged culture studies are not well understood.
Two studies of combustion particles suggest an enhanced response for ALI exposures. Holder et al.[22] reported enhanced IL-8 secretion at ALI in immortalized human bronchial epithelial cells at mass dose several orders of magnitude lower than submerged exposure. Stoehr et al.[28] also reported a similar finding in A549 cells. These studies estimated the rate of mass deposition using deposition efficiency, which required counting particle on TEM grids and subsequently comparing with total particle deposited (as measured by scanning mobility analyzer at inlet and outlet of exposure chamber and ignoring particle losses in the ALI system), and used assumptions regarding particle density, shape factor, and slip correction factors. Also, the deposition efficiency was measured prior to the cellular exposure experiments, and the studies assumed that it remained constant during exposure experiments. These studies also used shorter time intervals to measure their biological endpoints, and these time intervals may have been inefficient for the particles to reach the cells during submerged exposures. For example, Stoehr et al.[28] limited the post exposure time to 30 min, whereas Holder et al.[22] replaced the suspension with clear media 6 hours after treatment. Holder et al. also collected particles from an exhaust sample line for submerged exposure but used fresh diesel exhaust for the ALI exposure.[22] Different combustion particle collection methods affect particle properties and subsequent biological responses.[19] All of these factors lead to challenges in comparing the results of previous studies.
This study aims to build on previous studies by comparing three different exposure methods (submerged, pseudo-ALI, and ALI) using improved dosimetry estimates, sufficient exposure times, consistent flame-generated particles, and co-cultures of A549 (human lung cells) and differentiated THP-1 (human macrophages). The cellular viability, secretion of pro-inflammatory marker (TNFα), and xenobiotic metabolism (cytochrome P450 subfamily A1, CYP1A1 mRNA expression) were compared as indicators of differences between the three different exposure methods.
Methods
Particles were generated by combustion of a jet-fuel surrogate at constant combustion conditions. Particles were either deposited directly onto the co-cultures for ALI exposure or collected onto filters for submerged and pseudo-ALI exposures. The co-cultures were grown on standing inserts and evaluated for differences in viability, pro-inflammatory markers, and xenobiotic metabolism.
Cell lines and co-cultures
THP-1 cells were purchased from American Type Culture Collection (AT CC, Manassas, VA, USA) and maintained in complete growth medium (RPMI, Roswell Park Memorial Institute medium 1640) with L-glutamine, 25 mM HEPES buffer, 0.05 mM 2-mercaptoethanol (Bio-Rad, Inc. Hercules, CA, USA) and 10% FBS (Fetal Bovine Serum; GE Healthcare Bio-Sciences Corp., MA, USA). A549 cells were obtained from AT CC and maintained in DMEM (Dulbecco’s Modified Eagle Medium, Life Technologies Corporation, NY, USA) with L-glutamine, 4.5 g/L D-glucose, 25 mM HEPES Buffer, and 10% FBS. Cell cultures were incubated at 37 °C in 5% CO2, and 95% humidified air. Both cell lines were kept in the logarithmic phase of growth throughout all experiments.
THP-1 were differentiated into pulmonary macrophage-like cells using phorbol 12-myristate 13-acetate (PMA, Sigma Aldrich, St. Louis, MO).[29] THP-1 cells with a concentration of 860 K-1000K cells/mL were suspended in the media with 0.5 μg/mL PMA, and 9 mL of the suspension was seeded in T25K flask. After 90 min, as described by Kasurinen et al.,[30] the floating cells were aspirated, and 7 mL of phosphate buffer solution (PBS; PBS tablet, VWR Life Science, PA, USA) was added into the flask. The flask was gently tapped to resuspend the cells, transferred to a 50 mL vial, followed by centrifugation at 1.2 K xg for 6 min. The cells were washed twice with PBS before resuspending in DMEM (with FBS). These differentiated THP-1 cells were subsequently seeded onto A549 cells in a co-culture, as discussed in the next paragraph.
The co-cultures of A549 and differentiated THP-1 cells were selected for this study because they have been reported to be more sensitive than monocultures to particulate matter exposure.[31] Co-cultures were seeded onto standing-type inserts (Millicell Cell Culture Insert, 30 mm, hydrophilic PTFE, 0.4 μm; seeding area of 4.2 cm2 form MilliporeSigma, MA, USA). The inserts were coated with collagen on apical side (10 μg/cm2, PureCol®, CA, USA) before seeding. The seeding protocol followed that detailed by Kasurinen et al.[30] Before seeding, 1 mL of complete culture media was added to wells of a six-well plate. The inserts were placed in the wells containing media and allowed to become completely wet from the basolateral side. Approximately 240 K A549 cells (57.2 K cells/cm2) were seeded onto the apical side of the insert in 0.5 mL DMEM with FBS. Four hours after seeding the A549 cells, 48 K differentiated THP-1 cells (11.4 K cells/cm2) were seeded onto the A549 in 0.1 mL DMEM with FBS. Forty hours after seeding, the apical media of the co-culture (around 80% confluent) was removed and exposed to the particle in aerosol or suspensions.
Particle generation and collection
A surrogate of the jet-fuel was combusted at an equivalence ratio of 1.8 using a flat-flame burner. More details about the fuel component and the setup can be found in the Appendix (Section A.1). Particles were sampled at the height of 15 cm above the burner using an eductor (#30, mini eductor, Fox venturi Products, NJ, USA). For ALI exposure, the sampled particles were diluted with particle-free air (inline microfiber filter (Parker Hannifin, OH, USA)) and passed through a diffusion dryer before sending them into the exposure chamber (Fig. A1, Appendix). For submerged and pseudo-ALI exposure, the particles were passed through a diffusion dryer before collecting on 0.45 μm (pore size) Teflon filters (Whatman Ltd). The particles were gently scraped from the Teflon filters to obtain a dry powder. Suspensions with known concentrations were prepared by weighing (AE 240 balance, Mattler-Toledo, LLC, USA; accuracy: ± 0.1 mg) of the dry powder and suspended in DMEM media without FBS in sterile 15 mL vials. A stock suspension with a mass concentration of 252 μg/mL was prepared in DMEM media without FBS. The stock suspension was diluted in DMEM without FBS accordingly.
Particle exposure
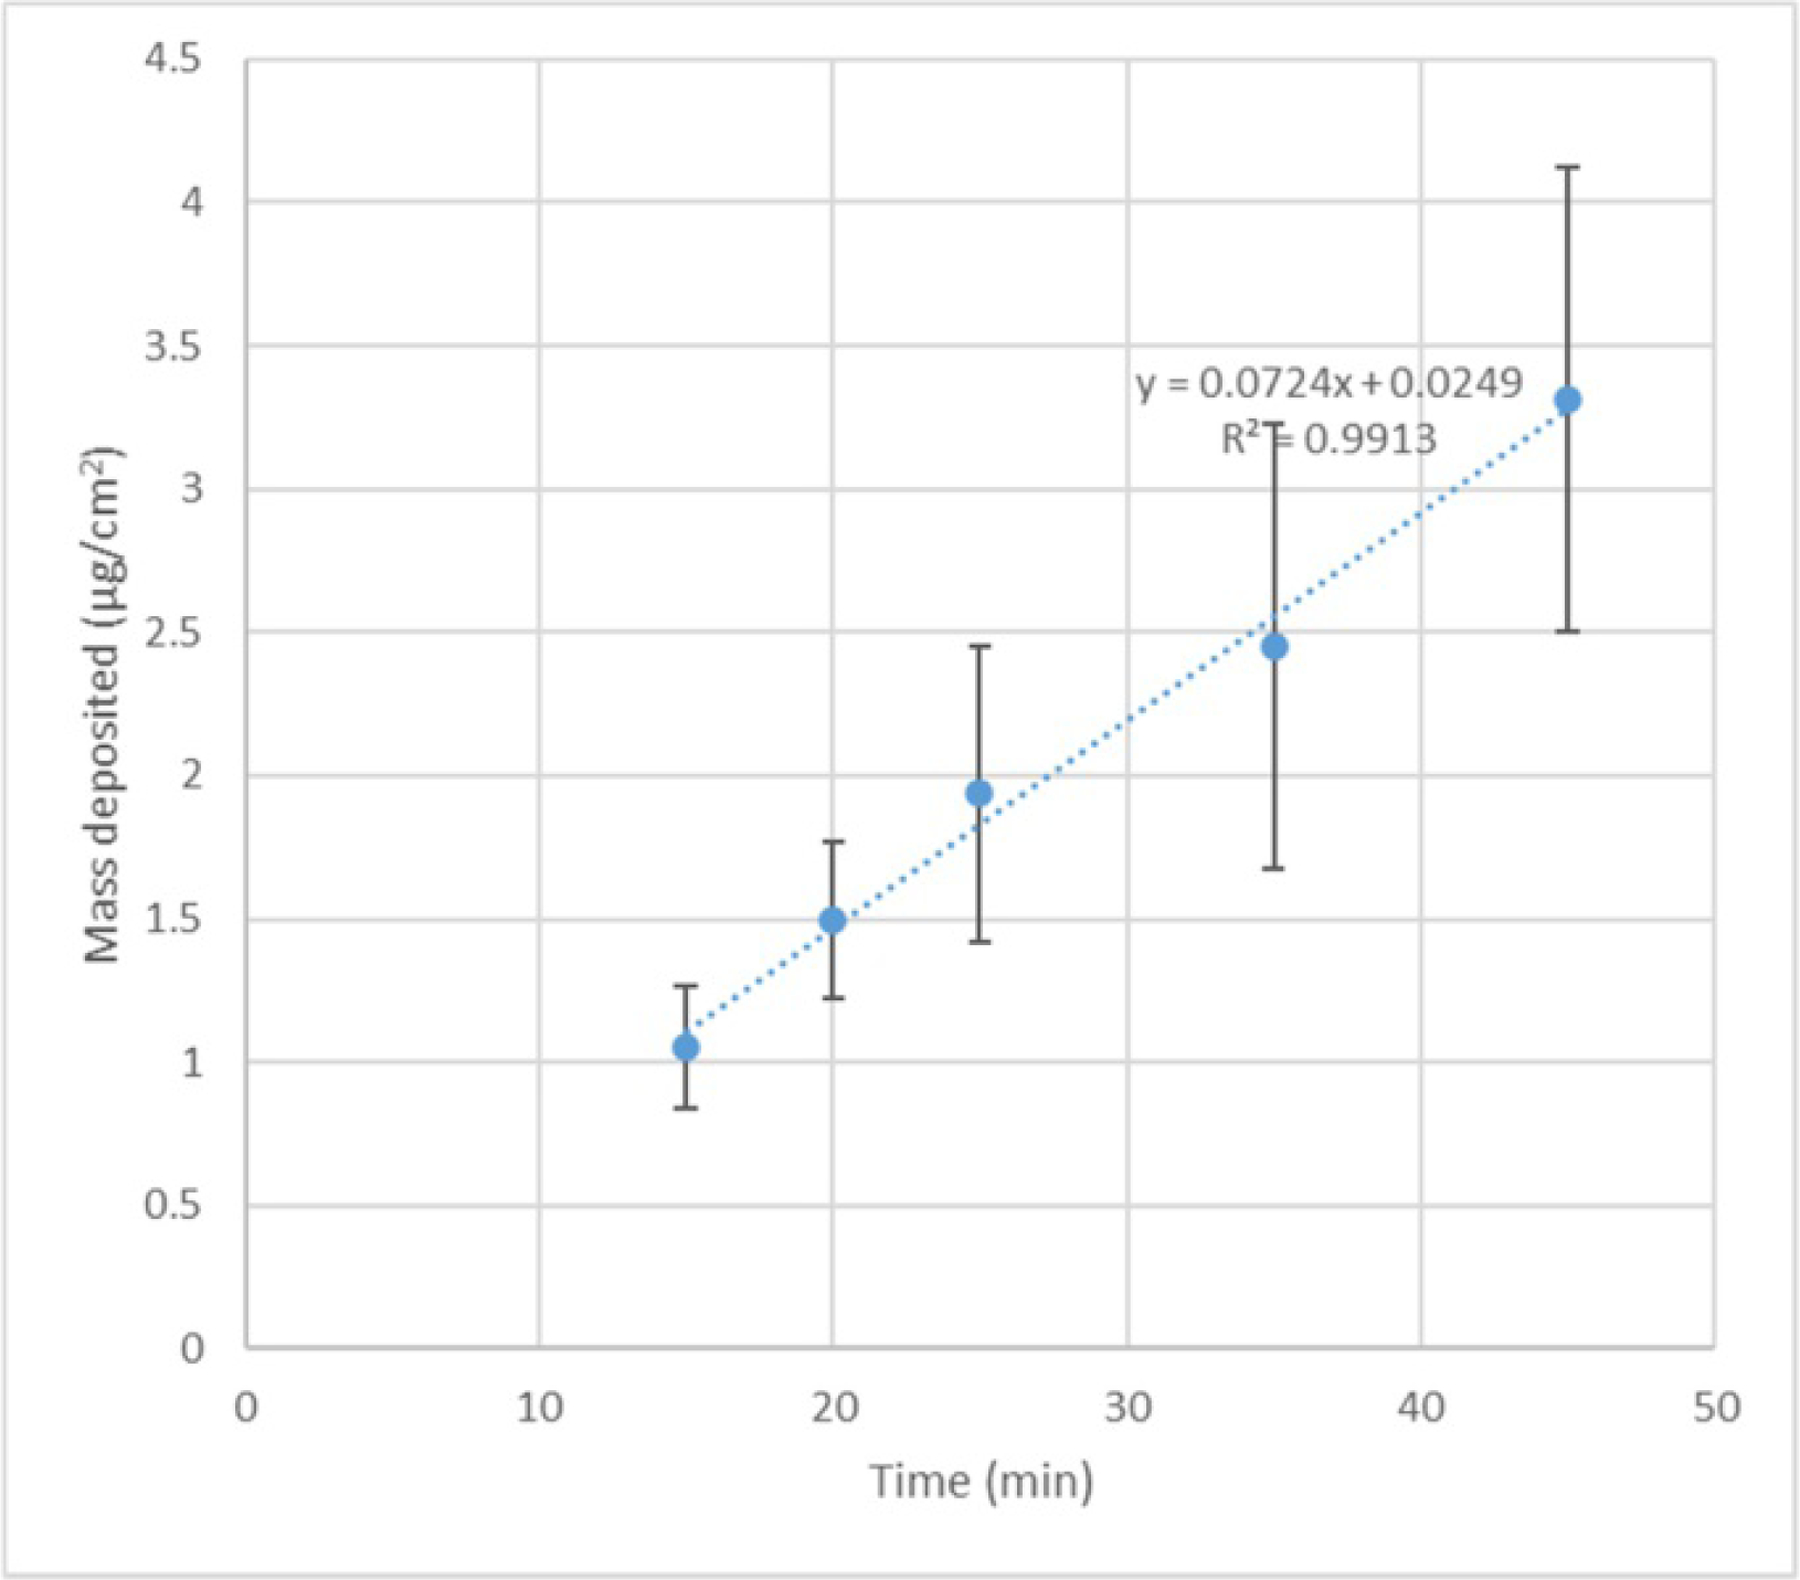
In this study, the exposure system deposits particles using an electrostatic field. More details about the exposure system can be found in the Appendix (Section A.2). For ALI exposures, following the manufacturer protocol, the apical media was removed from the co-cultures, and the inserts were moved to DMEM media without FBS (basolateral side) in a six-well exposure plate (aluminum, MedTec Biolab, NC, USA). The co-cultures were then allowed to rest (inside incubator) at ALI for 2 hours before exposure. The particles were deposited onto the co-cultures for 30 or 60 min at doses of ~2 μg/cm2 and ~4 μg/cm2, respectively. The time required to deposit the known mass was optimized by collecting particles for different time durations and measuring the deposited mass (Fig. A4, Appendix). The method used to estimate dose (deposited mass) is detailed in next section. The mass deposited was also measured after the end of each exposure experiment. The ALI control was an exposure of particle-free air (room air passed through an inline microfiber filter (Parker Hannifin, OH, USA) for either 30 or 60 min, which corresponded to the time required for particle doses of ~2 μg/cm2 and ~4 μg/cm2, respectively. The electric field was turned on during particle-free air exposures. After exposures in the ALI chambers, the inserts with cells were moved to a normal six-well plate containing 1 mL of fresh DMEM with FBS (basolateral) and moved to an incubator for 24 hrs (as outlined in the manufacturer’s protocol).
For pseudo-ALI exposures, the apical media was removed, and the co-cultures (on inserts) were moved to a new six-well plate containing 1 mL of DMEM with FBS (basolateral side). A total of 100 μL of the combustion particle suspension (prepared in DMEM without FBS) with a mass concentration of 252 μg/mL and 84 μg/mL was added to the apical of the inserts to expose the cells to 6 and 2 μg/cm2 of particles, respectively. The controls for pseudo-ALI exposure were obtained by placing 100 μL of DMEM without FBS on the apical side. After adding particle or control treatments, cells were moved to the incubator for 24 hours.
For submerged exposures, the apical media was removed, and the co-cultures (on inserts) were moved to a new six-well plate containing 1 mL of DMEM with FBS (basolateral). A total of 500 μL of suspension with mass concentrations 50.4 and 16.8 μg/mL were added to the apical side of the inserts to expose the cells to 6 and 2 μg/cm2 of particles, respectively. The controls for submerged exposures were obtained by placing 500 μL of DMEM without FBS on the apical side of the insert. After adding particle or control treatments, the cells were moved to the incubator for 24 hours.
All experiments were performed thrice, except the ALI exposure for 4 μg/cm2, which was performed twice (due to technical difficulties in ALI chamber). For submerged and pseudo-ALI, 2–3 inserts were exposed for each dose and control. For ALI exposure, 4 inserts were exposed to each dose or control. Co-cultures were also treated with the maximum concentration of particles used in this study (6 μg/cm2 for submerged and pseudo-ALI, and 4 μg/cm2 for ALI) to determine the cellular viability (Section A.4, Appendix).
Estimation of dose/deposited mass at ALI
For ALI exposure, the mass was measured for each deposition run. For a single exposure, only four of the six wells contained inserts with cells, while the remaining two wells contained empty inserts. On empty inserts, aluminum circles (diameter of 21 mm, cut from aluminum sample pans (Mettler Toledo, OH, USA)) were placed on top of the insert, and a glass slide (AmScope, CA, USA) was placed on top of the aluminum circle. The well with inserts and glass slides contained the same volume of media (basolateral) as other wells with the cells. The aluminum circle prevented any contact between the glass slide and media and avoided wetting of the slide with media. After exposure, the glass slides were gently lifted using a fine-tipped tweezer, moved to wells of a 12-well plate, and 0.5 mL of ethanol was added and sonicated for 5–10 sec to suspend the particles. Quickly, 50 μL of the suspensions were transferred to a 96-well plate in triplicate and read for absorbance at 450 nm using a plate reader (BioTek, Synergy HTX, VT, USA). The absorbance value was compared to the calibration curve (Fig. 1, details in the next paragraph) to obtain the concentration of each suspension (μg/mL). The total mass per area was estimated using: concentration of the suspension (μg/mL) multiplied by 0.5 mL divided by the area of the slide (cm2). Since the mass was estimated after the exposure had ended, a slight variation (± 0.3 μg/cm2) in the deposition for different experiments was observed.
Figure 1.
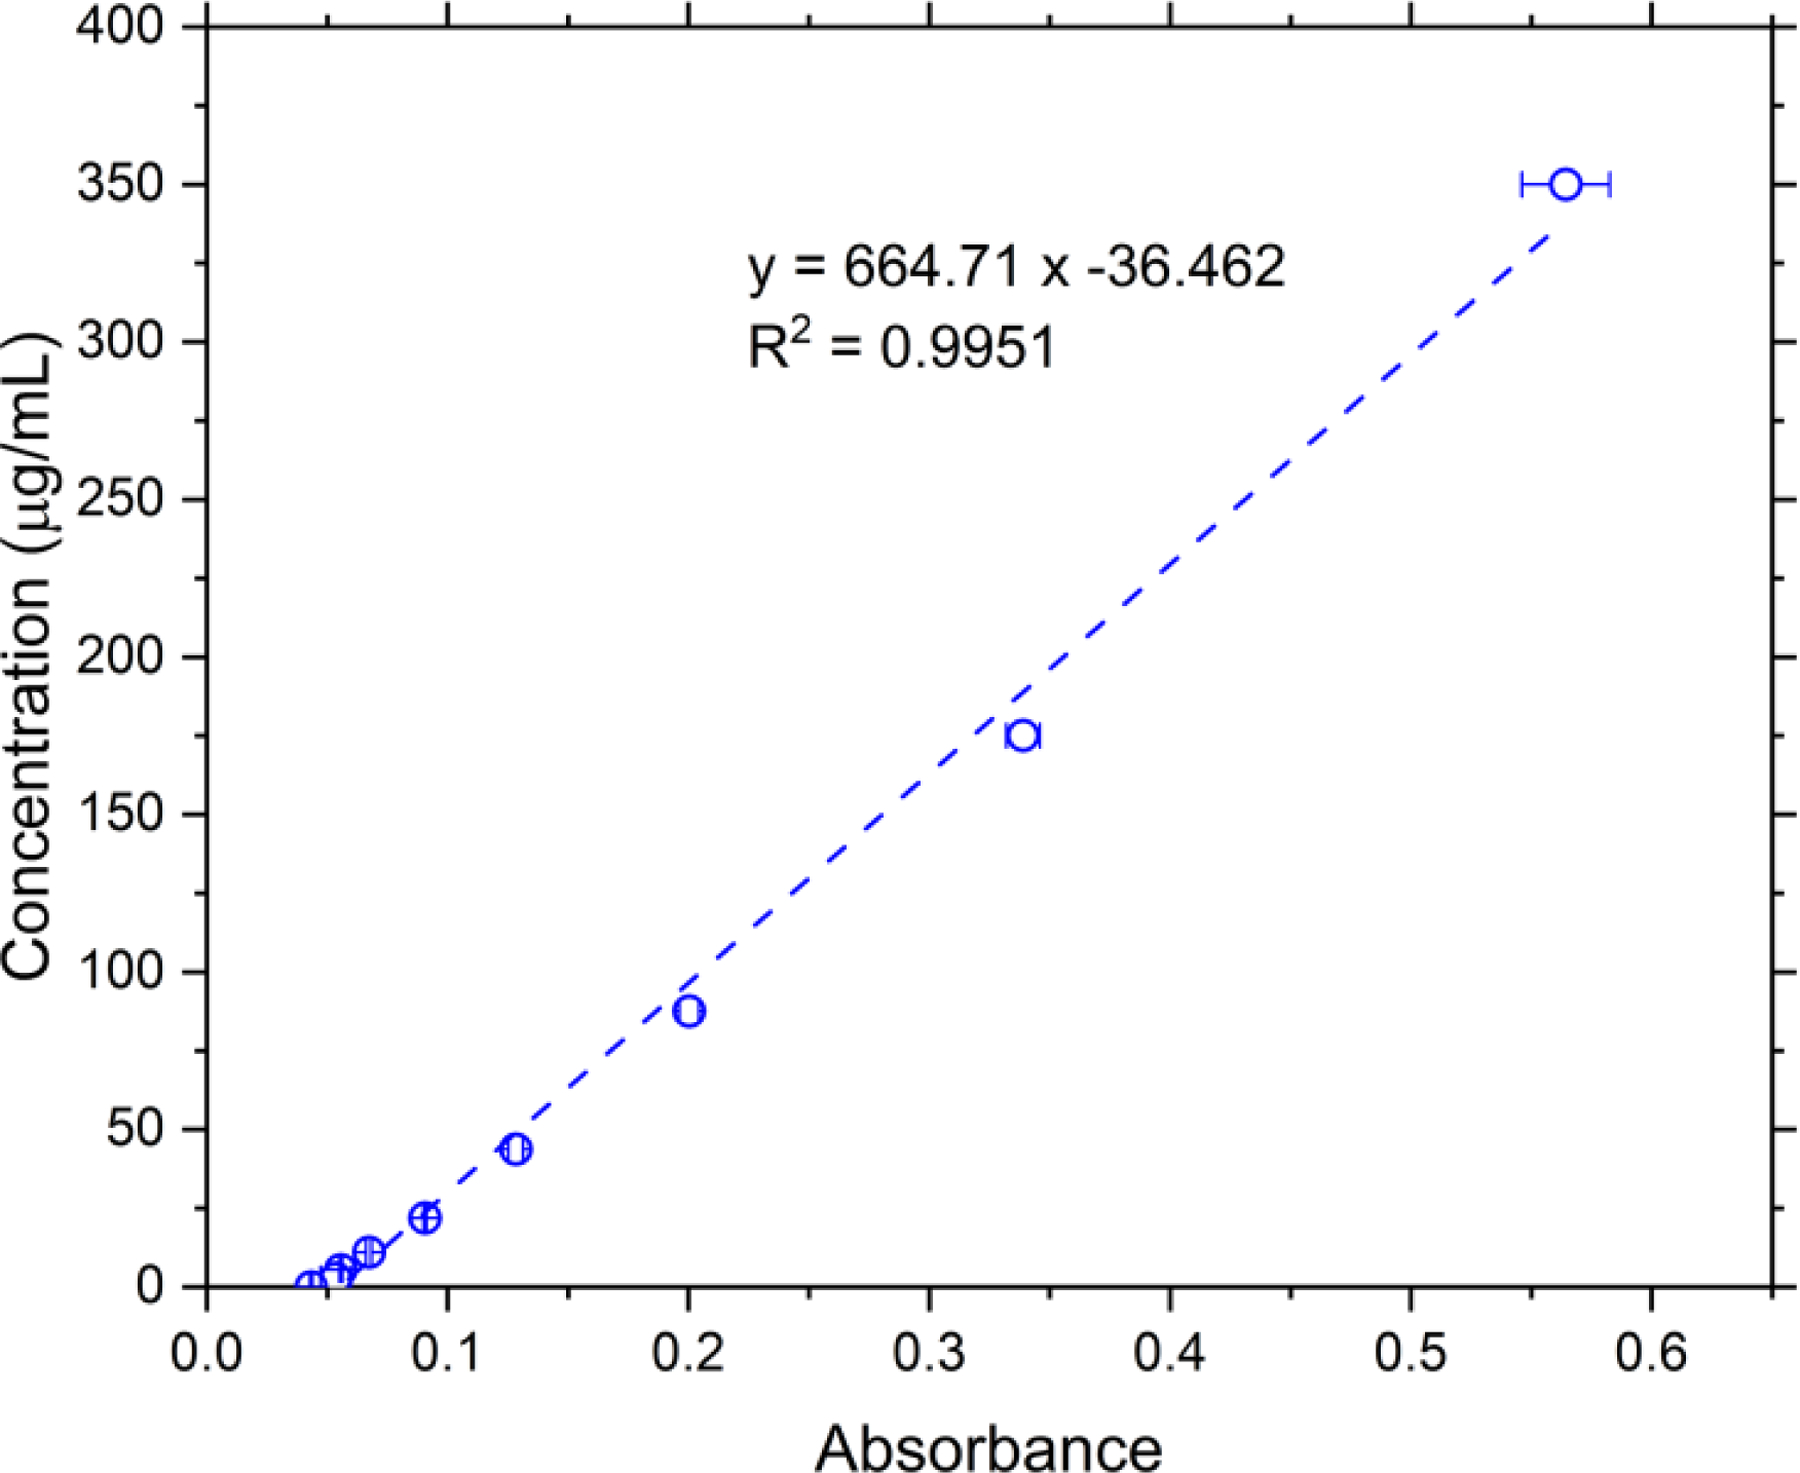
Calibration curve for mass concentration of particles suspension in ethanol and corresponding absorbance at 450 nm. Error bars indicates standard deviation in the absorbance measurement (n = 3).
A calibration curve between the mass concentration of particles in ethanol and the absorbance at 450 nm was created for determining the mass dose. The particles (details in section on Particle generation and collection) were collected after the diffusion dryer (Fig. A1) onto a filter with a pore size of 0.45 μm (Whatman Limited, GE Healthcare, IL, USA). The collected particles were gently scraped from the filter and collected as dry powder. A known amount of dry powder was weighed, and ethanol was added to prepare suspensions with a concentration of 350 μg/mL. Unlike DI water, the hydrophobic combustion particles suspend relatively well in ethanol. The 350 μg/mL stock was serially diluted to obtain suspensions with concentrations of 175, 87.5, 43.75, 21.875, 10.938, 5.469, and 2.734 μg/mL. A 50 μL aliquot of each suspension was placed in triplicate into a 96-well plate, and absorbance was measured at 450 nm. The absorbance was plotted against the known concentrations, and a linear curve was fitted to obtain the calibration curve (Fig. 1).
Biological endpoints
At 24 hrs post-exposure, the cells were evaluated for cell viability, secretion of the pro-inflammatory marker (TNFα), and AhR-dependent induction of xenobiotic metabolism (CYP1A1 mRNA gene expression).
TNFα protein expression analysis by ELISA
For the ALI and pseudo-ALI exposures, the basolateral media was collected and centrifuged at 10 K xg for 10 min before saving the supernatant at −80 °C. For submerged exposures, both the basolateral and apical media (mixed in same vial) were transferred to vials (first set of vials), centrifuged at 1.2 K xg before transferring the supernatant to a second set of labeled vials. The second set was centrifuged at 10 K xg for 10 min before saving the supernatant at −80 °C. The first set of vials with the pellet was saved and used for cell harvesting. The presence of the pro-inflammatory markers (TNFα) was measured using ELISA (R&D Systems, Minneapolis, MN, USA), according to the manufacturer’s protocols.
CYP1A1 gene expression analysis by q-PCR
After saving the media for ELISA (basolateral for ALI and pseudo-ALI; and both basolateral and apical for submerged), 0.3 mL of TRYPLE (Gibco, Thermo Fischer Scientific, MA, USA) was added to detach the cells from the inserts. After incubating for 3 min, 0.7 mL of cold PBS was added onto the apical side. The cells were resuspended using gentle pipetting and transferred to 1.5 mL vials (fresh for the ALI and pseudo-ALI; the first set of vials with the pellet for submerged), which were then centrifuged for 5 min at 1.2 K xg. The supernatant was removed, and the cell pellet was frozen at −80 °C.
The cells pellets were thawed on ice, and the total RNA was extracted and purified using RNeasy Plus Kits (Qiagen, MD, USA), following the manufacturer’s protocol. Using 0.5 μL, the total content and quality of RNA for each sample was measured using a NanoDrop Microvolume Spectrophotometer (Thermo Fischer Scientific, MA, USA). A total of 1 μg of RNA from each sample was reverse transcribed to cDNA using QuantiTech Reverse Transcriptase kit (Qiagen, MD, USA), following the manufacturer’s protocol. The quantitative polymerase chain reaction (qPCR, Applied Biosystems 7900 Real-Time PCR, Thermo Fischer Scientific) was run using RT2 SYBR® Green qPCR master mix (Qiagen, MD, USA) and primers for CYP1A1 (F: TAGACACTGAT CTGGCTGCAG, R: GGGAAGGCTCCAT CAGCAT C) and glyceraldehyde 3-phosphate dehydrogenase (GAPDH) (F: AGCCACAT CGCTCAGACAC, R: GCCCAATACGACCAAAT CC), as a reference gene. The Livak ΔΔCt method was used to normalize the product copy numbers of the exposed samples compared to controls.[32]
Cell uptake study using transmission electron microscopy (TEM)
After removing the basolateral media (24 hours upon exposure), the cells were detached using TRYPLE. After 3 min incubation, 0.7 mL of DMEM with FBS was added, and the cells were resuspended. The suspension was transferred to a vial and centrifuged at 1.2 K xg for 5 min. The supernatant was removed, and 0.7 mL fixation buffer (formaldehyde glutaraldehyde 2.5%, Electron Microscopy Sciences, PA, USA) was added, and the suspension was vortexed for 5 min. The suspension was left to rest at room temperature for 15–30 min, followed by storage at 2–8 °C. The fixed samples were cut and prepared for TEM analysis. The TEM samples were imaged with transmission electron microscopy (FEI TECNAI T-12, Thermo Fischer Scientific, MA, USA), and they were evaluated qualitatively for differences in uptake.
Particle characteristics
The particle size distribution (PSD) in the aerosol phase was determined at the outlet of the exposure chamber using a scanning mobility particle sizer (SMPS, TSI 3080, TSI Inc., Shoreview, MN, USA) with a long-differential mobility analyzer (TSI model 3081, TSI Inc., Shoreview, MN, USA) and ultra-fine condensation particle counter (TSI model 3025 A, TSI Inc., Shoreview, MN, USA). The measurements were collected when the electric field was in both the on and off conditions to determine if the electric field caused any size-preferential deposition. No humidifier was used when measuring the PSD to avoid the effect of humidity on the SMPS readings.
For the suspensions (in DMEM without FBS) of the different particle concentrations used in the study, the mean hydrodynamic radius was measured using dynamic light scattering (DLS; Nanostar, Wyatt, CA, USA) and processed for mean hydrodynamic radius using Wyatt’s DYNAMICS 7.8.0.26 software (Wyatt Technology Corporation, CA, USA). The total VOC content was measured at the inlet of the ALI using a volatile organic compound (VOC) probe (Model 984, TSI Inc., Shoreview, MN, USA) for control and particle exposure conditions. The VOC content of the room air was also measured.
Data analysis
One-way analysis of variance (ANOVA) with astatsa.com online software and Tukey’s honest significant difference (HSD) post-hoc test was used to compare the difference between the samples mean at significant levels of p < 0.01 and p < 0.05.
Results
Physical and chemical characteristics
PSDs can aid in confirming particle deposition on the ALI system. Figure 2 compares the PSD at the outlet of exposure chamber for conditions with the electric field off and on, and it shows that the total number concentration decreased from 6.0E5 #/cm3 to 1.5E5 #/cm3 when the electric field was turned on, providing evidence for deposition in the exposure chamber associated with the application of the electric field. Application of the electric field also decreased the mean mobility diameter from 276.9 ± 1.2 nm (field off) to 181.7 ± 10.9 nm (field on). The smaller mean particle size associated with the electric field is likely due to the lower number concentrations at the chamber outlet and the corresponding reduction in particle agglomeration.
Figure 2.

Particle size distribution measured by the SMPS at the outlet of the ALI chamber with the electric field on and off. The error bars represent standard deviation (n = 7).
From Table 1, the DLS measurements revealed that the mean hydrodynamic radius for the suspension used in submerged exposures was lower than those used for the pseudo-ALI exposures. These lower concentrations can lead to less particle agglomeration. The most concentrated suspensions (used for dosing 6 μg/cm2 in pseudo-ALI) agglomerated quickly, increasing the radius from 536.8 nm to 1328.4 nm in 5 min. Previous studies have reported rapid agglomeration of particles when suspended in cellular media.[33]
Table 1.
Hydrodynamic radius as measure by DLS for the particle suspensions in DMEM (without serum) prepared for dosing in submerged and pseudo-ALI exposures.
| Exposure method | Concentration of suspension in µg/mL (dose in µg/cm2) | Hydrodynamic radius in nm (Standard Deviation) |
|---|---|---|
| Submerged | 50.4 (6) | 428.7 (29.3) |
| Submerged | 16.8 (2) | 267.5 (16.2) |
| Pseudo-ALI | 252 (6) | 536.8 (37.9) |
| Pseudo-ALI | 84 (2) | 439.6 (50.8) |
This study’s flame-generated combustion particles contained polycyclic aromatic hydrocarbons (PAHs) (Fig. A5, Kaur et al.[19]). These PAHs are typically found in vehicle-exhaust particulate matter,[34] and our finding supports the atmospheric relevance of the flame-generated particles. The diluted flame-generated particles along with combustion exhaust (which included VOCs) flow to the ALI system. The total VOC content in room air, and at the inlet of the ALI for control and particle exposure conditions was 170 ppb, 70 ppb, and 100 ppb, respectively. The filtered room air was diluted with zero air for control exposure conditions, explaining 70 ppb concentration for the air control relative to room air. For the flame on condition, dilution with zero air reduced the concentration of VOCs from flame to 100 ppb compared to room air.
Biological endpoints
For the maximum dose tested, i.e., 6 μg/cm2 for submerged and pseudo-ALI, and 4 μg/cm2 for ALI, the cells exhibited viability of more than 95% (Fig. A6). Uptake of particles was observed by both the cell types (predominantly by the macrophages). The presence of the particles inside the endosomal vesicles in the exposed cells was confirmed by TEM (Fig. 3).
Figure 3.

TEM images illustrating the endosomal vesicles in the THP-1 macrophage-like cells after exposure to (a) air, and particles at (b) ALI, (c) Submerged, and (d) pseudo-ALI exposures. The arrow indicates the presence of particles inside the endosomal vesicles.
Exposure to combustion particles caused an increase in the secretion of the pro-inflammatory marker TNFα (Fig. 4) and in CYP1A1 gene expression (Fig. 5), with respect to the control, irrespective of the exposure method. Comparing the submerged and ALI exposure methods, the mean TNFα fold increase relative to the control was significantly greater for the 2 μg/cm2 dose (p < 0.01). The fold increase in the TNFα for a dose of 4 μg/cm2 at ALI was significantly higher than the submerged exposure dosed with 6 μg/cm2 (significant at p < 0.05). The aim of this study was to compare the three exposure methods, and the tested doses were not sufficiently different (2, 4, and 6 μg/cm2) to provide a dose response.
Figure 4.

Secretion of TNFα cytokine by co-cultures 24 hr after exposure to particles under ALI, pseudo-ALI, and submerged conditions at dose of 2, 4, and 6 μg/cm2 (represented by numbers 2, 4, and 6 in the graph). Marked pairs are significant at levels of ** p < 0.01 and * p < 0.05. Each experiment was run in triplicate, except 4 μg/cm2, which was run twice. Each experiment included two wells per dose, except for ALI which included 4 wells per dose. ELISA was performed in duplicate for each well giving n = 12 for submerged and pseudo-ALI; n = 16 for ALI at dose of 4 μg/cm2 and n = 22 for ALI-at dose of 2 μg/cm2.
Figure 5.

Induction of CYP1A1 gene expression, 24 hr after exposure to particles under ALI (2 and 4 μg/cm2), pseudo-ALI, and submerged conditions (2 and 6 μg/cm2). The number 2, 4, and 6 represents the dose in μg/cm2. For all exposure methods, from two different experiment runs, two wells per dose were run in duplicate (n = 8).
Discussion
This study compared three different in vitro methods (submerged, pseudo-ALI, and ALI) for exposing co-cultures of A549 and differentiated THP-1 cells exposed to combustion-derived particles. The particle dose was measured directly at the ALI, which avoided the use of assumptions about consistent deposition, density, and shape. This study used co-cultures grown on inserts for all exposure methods. The co-cultures begin to mimic the complex in vivo physiological responses, and previous studies have reported that co-cultures can more sensitive to particulate matter exposure than monoculture.[31]
Since the cellular viability for all exposure methods and doses was more than 95%, including the ALI controls, the ALI exposure conditions did not appear to affect cell viability adversely. The maximum exposure time at ALI for this study was 1 hour, which is less than some previous studies using the electrostatic-based ALI systems.[16,17] Zavala et al.[17] reported approximately 100% viability for A549 cells for 4 hour exposure using the same exposure chamber and similar temperature and relative humidity conditions. Volckens et al.[16] also reported good viability for primary human bronchial epithelial cells after 3 hour exposure using an electrostatic aerosol in vitro exposure system.
The uptake of particles can trigger selected cellular responses. The uptake observed for all exposure methods (Fig. 3) might be one of the reasons for the secretion of pro-inflammatory markers and upregulation of CYP1A1 relative to the controls. The significantly higher secretion of pro-inflammatory markers for ALI compared to submerged exposure observed in this study (Fig. 4) has also been observed in previous studies exposing diesel exhaust particles to lung cells.[10, 22, 28] One of the reasons for this higher pro-inflammatory response for ALI is likely related to the difference and timing of the delivered dose. The secretion of pro-inflammatory markers is dose-dependent.[35,36] Higher doses can lead to greater uptake, which leads to enhanced cellular response. For submerged exposure conditions, the concentration of combustion particles administered to the cells is likely lower than the prepared concentration due to the hydrophobic nature of combustion particles. This hydrophobic nature causes particle losses to the walls of vials used to prepare the particle suspensions, agglomeration of particles, and particles to float on the top of the media.[12] In submerged cultures, particles require some time to reach and interact with the cells, and some of the particles may not reach the cells (losses to insert wall) at all. These factors cause the delivered dose of combustion-derived particulate matter to be lower than the administered dose, and it is difficult to estimate the delivered dose in submerged exposures.[37] Consequently, the actual post-exposure time (time between particle-cell contact and response reading) is lower for submerged exposure than ALI. Further quantitative, dose- and time-dependent experiments are needed to evaluate the rate of uptake and downstream cellular response.
The change in physicochemical properties caused during particle collection and resuspension can affect the cellular response as well.[19] For example, soluble PAHs can cause suppression of inflammatory markers,[38,39] and this may be a factor in the lower inflammatory response observed during submerged exposure. The soluble chemical components, including PAHs, can contribute as much as 35% of the total administered mass dose.[19] Furthermore, the protein/corona and other substances in media can coat the surface of the particles, altering the particle surface properties and subsequently altering any interaction with cells.[33, 40] We attempted to limit protein interactions in this study by preparing the treatments in serum free DMEM. In addition, the resuspension of combustion particles in media causes agglomeration of the particles, resulting in less available surface area for cell interaction, which further decreases the cellular response. A higher surface area is associated with higher inflammogenicity for cellular response to nanoparticles.[41–43] In the case of ALI exposure, in addition to the particle phase, the gas phase species may also interact with the cellular surface, which may enhance the overall cellular response.[28] The role of particle charge may also be important. The ALI system deposits positively charged particles, which are likely to interact with the negatively charged cell membrane. Furthers studies using an ALI system that can allow deposition of particles with different polarities (negative and positive) and comparison between the cellular responses are needed to understand the effect of particle charge.
Although this difference was not statistically significant, a somewhat higher CYP1A1 response was observed for the submerged exposure compared to the other two exposure methods (Fig. 5). These differences may be due to the timing of exposure-response and potentially the specific particle-associated PAHs diffusing from the particles and interacting with the cells. For diesel exhaust particles, Hawley et al., reported the peak of IL-8 and CYP1A1 mRNA induction in human bronchial epithelial cells after 3 hours of exposure.[44] The time course of mRNA gene expression tends to follow a Gaussian distribution.[44] The harvest of cells for ALI exposure is usually done after 1–4 hours of exposure.[16] The harvest time frame used in this study was set to 24 hours for consistency. It is likely that after 24 hours, for ALI exposure, the values captured corresponded to the tail of the distribution, where it is near max for submerged. If the ALI samples were collected within 1–4 hours, it is possible that the upregulation of CYP1A1 gene expression for ALI compared to submerged exposure would have been greater. Further studies with cell harvesting at different time points for all three methods are needed to optimize exposure time.
Interestingly, the differences between pseudo-ALI and the other two exposure methods were not significantly different (Figs. 4 and 5). Pseudo-ALI uses suspensions as submerged but at a higher concentration and smaller volume (100 μL). The loses of particles to the wall of inserts is lower than for submerged exposure, and particles reach cells more quickly due to the minimal layer of liquid, causing a response in pseudo-ALI higher than submerged. Compared to ALI, pseudo-ALI does not have contributions from gas-phase species, but the high-concentration particle suspensions tend to agglomerate, leaving less surface area for cellular interaction. These factors likely explain the lower response of pseudo-ALI compared to ALI exposure
The differences observed due to exposure method (ALI vs. submerged) may have contributions from different cell behavior under submerged and ALI conditions. After exposure, the cells exposed at ALI remain at ALI for 24 hrs, where for the pseudo and submerged exposure, the liquid layer (suspension of particle in media) covers the cells. A549 cells grow differently at submerged and ALI conditions. Under submerged conditions, the A549s form a monolayer, where at ALI, multilayers are possible, which may cause higher protein levels.[45] Another difference between cells grown at submerged and ALI conditions is that submerged cells are grown under hypoxic conditions.[27, 46] Hypoxia has been associated with increased release of cytokines.[46] The A549 cells are also known to release surfactant when at ALI, which may form a protective barrier, possibly affecting the cell-particle interaction.[47] Given the difference in the behavior of cells under different culture conditions, making a direct comparison between the ALI and submerged exposure is complicated. However, for each exposure method, an increase in response relative to respective controls was observed. Similar trends of increased responses in all three exposure methods indicate that particle toxicity can be observed irrespective of the exposure method.
Conclusions
In summary, this study identified differences in cellular response associated with differences in exposure method for co-cultures of A549 and differentiated THP-1 cells treated with combustion-derived particles. Significantly higher TNFα release was observed for the ALI exposure, as compared to the submerged and pseudo-ALI exposures (all samples compared to their corresponding controls). The differences in the CYP1A1 gene expression were not significantly different, although submerged exposure had higher values. The different particle physicochemical properties and actual particle interaction times may be responsible for some of these differences. Although the magnitude of responses was different for the different exposure methods, an elevated pro-inflammatory and CYP1A1 response was observed compared to the controls, suggesting a similar cell signaling pathway irrespective of the exposure method. Although ALI provides a more realistic in vitro exposure method, it is an expensive option, and depending on the exposure chamber design, the number of replicates can be limited. In addition, the effect of depositing charge-fractionated particles on toxicity requires evaluation. Consequently, submerged exposure may still provide relevant information for particulate exposures.
Supplementary Material
Acknowledgments
The authors acknowledge the use of the University of Utah shared facilities of the Micron Microscopy Suite and the University of Utah USTAR shared facilities supported in part by the MRSEC Program of the NSF under Award (No. DMR-1121252).
MRSEC
NSF 10.13039/100000001 DMR-1121252
National Institute of Environmental Health Sciences 10.13039/100000066
National Institutes of Health 10.13039/100000002 5K25ES027504-02, R01ES024681, ES017431, ES027015, 660-D64122, 5P30CA042014-24
This research was supported by grants from the National Institute of Environmental Health Sciences, National Institutes of Health (5K25ES027504-02, R01ES024681, ES017431, and ES027015). This work was also supported by a Merit Research Grant from the Department of Veterans Affairs (660-D64122). This work was also supported by the University of Utah Flow Cytometry Facility and the National Cancer Institute through Award Number 5P30CA042014-24.
Appendix A
A.1. Particle generation and sampling
A jet-fuel surrogate blend of six-pure components, including n-octane, n-hexadecane, n-dodecane, xylene, tetralin, and decalin, was burned using a flat-flame burner at an equivalence ratio of 1.8 (fuel/air) to generate particles (Fig. A1). A 100 mL syringe (KDS stainless steel syringe, KD Scientific Inc., MA, USA) was used in a syringe pump (KDS 410, KD Scientific Inc., MA, USA) to delivers the fuel at a flow rate of 45 mL/hr. For optimal performance, 80% of the capacity of pump was used, i.e., avoiding filling and emptying fully A custom-made vaporizer converts the liquid fuel to vapor, which is then mixed with air before sending it to the burner. A GC-MS of liquid fuel and the vaporized fuel was compared to verify that the compositions remain unaffected during vaporization (Table A1).
Figure A1.

Schematic of the experimental set-up for generating combustion particles.
Figure A2.

Simplified schematic of CelTox sampler.
Figure A3.

Calibration curve for mass concentration of particles suspension in ethanol and corresponding absorbance at 450 nm.
Figure A4.
The duration of deposition vs. deposited mass (μg/cm2). The error bar represents the standard deviation (n = 6–8).
Figure A5.
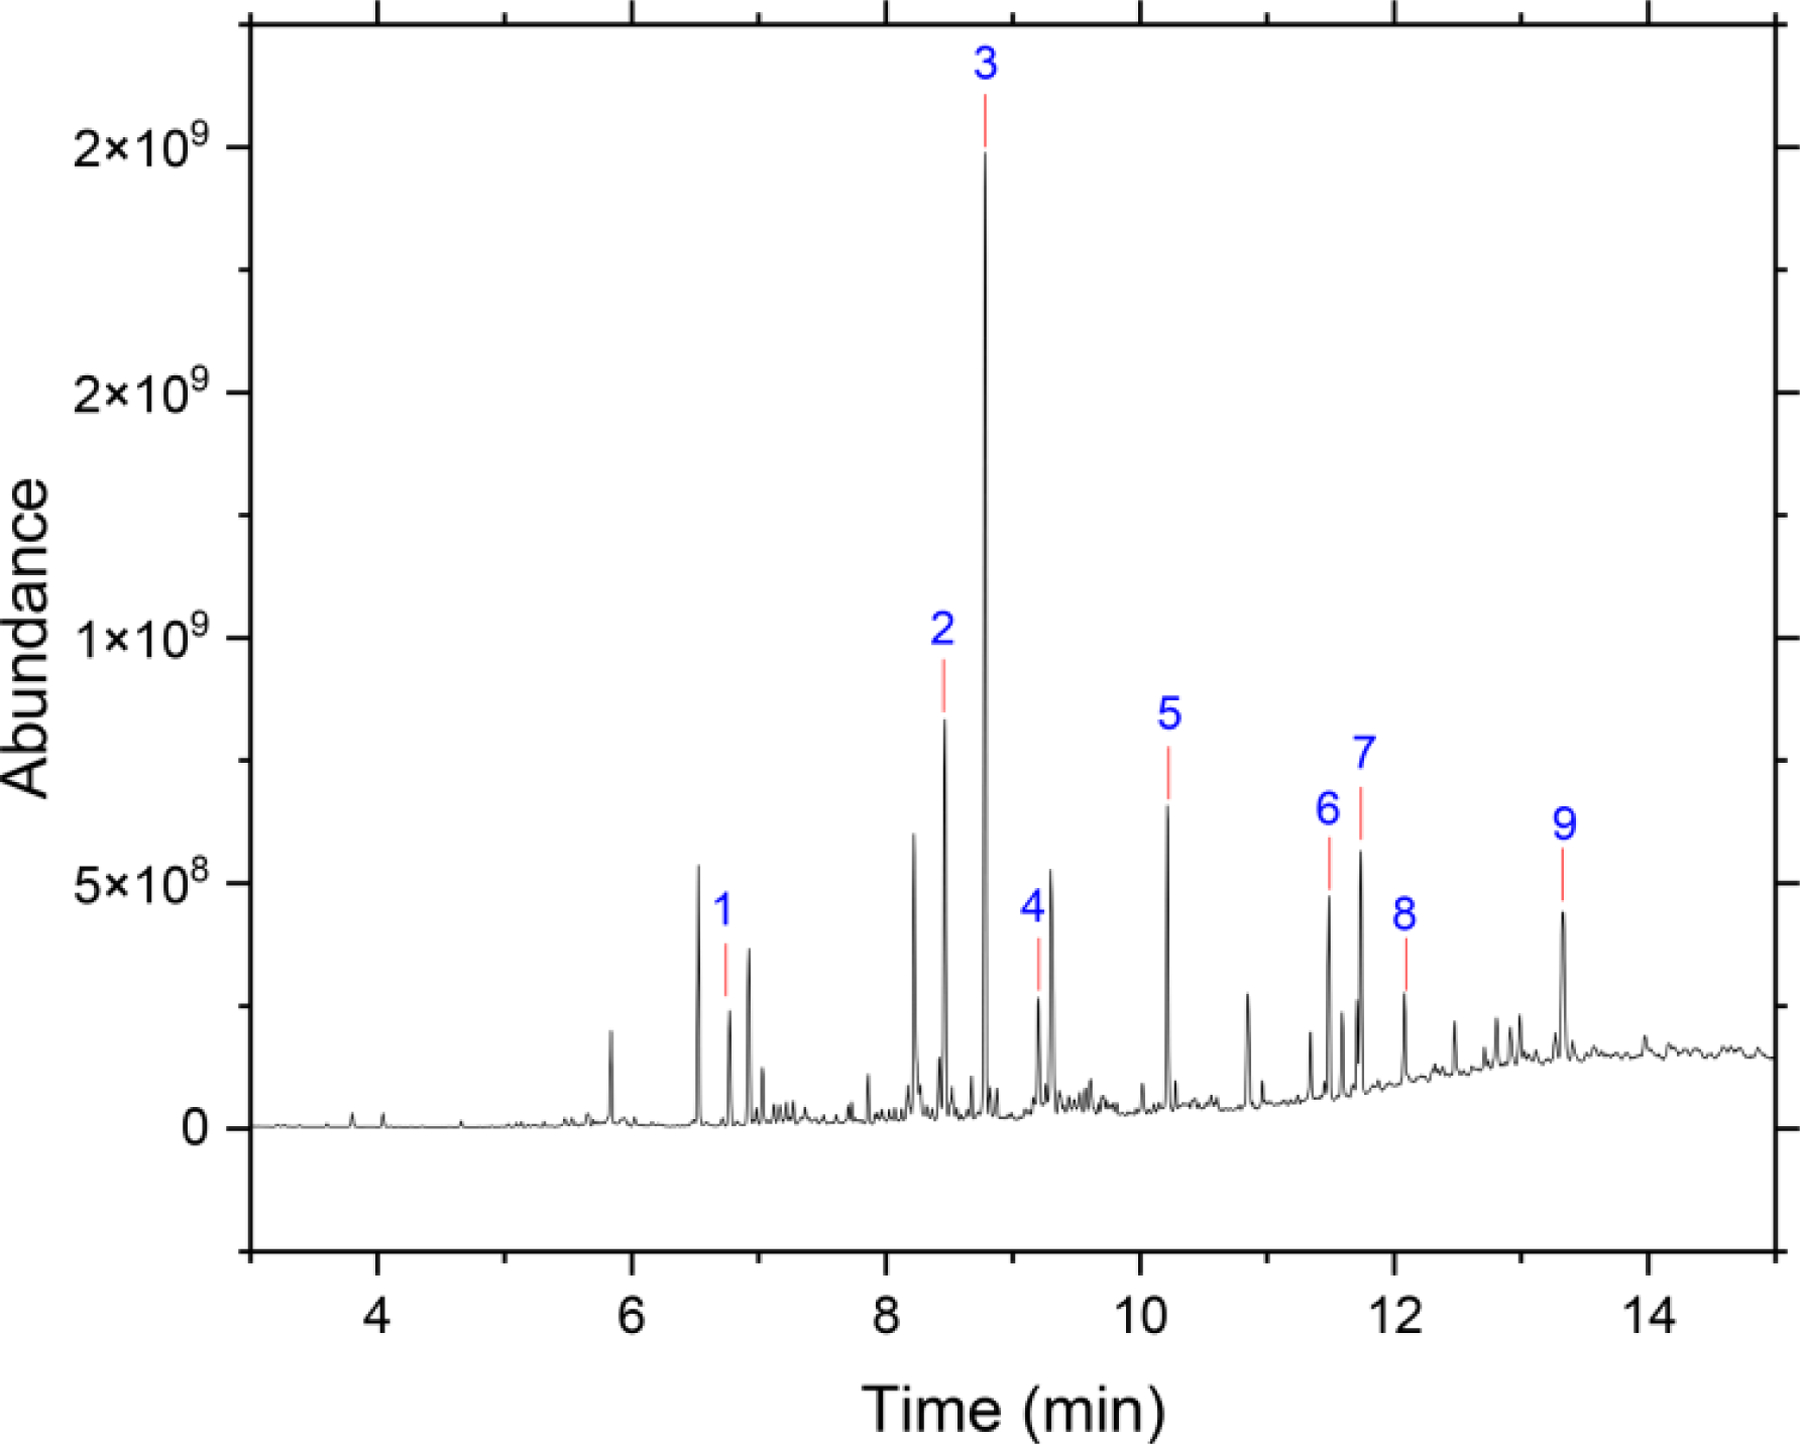
GC-MS chromatogram for the extract of filter-collected particles in hexane. The number indicates the following compounds: 1-naphthalene, 2-biphenylene, 3-hexadecane,4-fluorene, 5-phenanthrene, 6-fluoranthene, 7-pyrene, 8-a derivative of dodecane, 9-chrysene.
Figure A6.

Cellular viability of the co-cultures exposed to combustion particles at doses of 6 μg/cm2 for submerged and pseudo-ALI, and 4 μg/cm2 for ALI. The error bars represent standard deviation (n = 4).
Table A1.
Vaporizer performance for the jet-fuel surrogate.
| Before Vaporization | After Vaporization | |||||||
|---|---|---|---|---|---|---|---|---|
| Compound | % mol | Retention time (min) | Peak area (pA*s) | % area | Retention time (min) | Peak area (pA*s) | % area | |
| n-octane | C8H18 | 3 | 36.3 | 2.90E+3 | 2.47 | 36.3 | 4.23E+3 | 2.32 |
| m-xylene | C8H10 | 15 | 43.2 | 1.45E+4 | 12.3 | 43.2 | 2.20E+4 | 12.1 |
| Decalin (trans-decalin) (trans-Decahydronaphthalene) | C10H18 | 27 | 59.2 | 2.96E+4 | 25.2 | 59.3 | 4.39E+4 | 24.1 |
| Tetralin (1,2,3,4-Tetrahydronaphthalene) | C10H12 | 13 | 64.6 | 1.46E+4 | 12.4 | 64.7 | 2.26E+4 | 12.4 |
| n-dodecane | C12H26 | 30 | 67.5 | 4.02E+4 | 34.2 | 67.6 | 6.40E+4 | 35.2 |
| n-Hexadecane | C16H34 | 12 | 90.3 | 1.57E+4 | 13.4 | 90.6 | 2.52E+4 | 13.9 |
Quartz tubing (diameter of 85 mm) with holes at 15, 25, and 35 cm (above the burner) was used to reduce the effect of surrounding room air on the flame. Before sampling the particles, the flame was stabilized (includes the time required for the fuel to reach from syringe to burner) for ~10 min (using ~8 mL of fuel). The particles were sampled through an open-ended probe placed 15 cm above the burner, using a suction generated by an eductor (#30, mini eductor, Fox Venturi Products, NJ, USA; Motive air of 2 psig). Additional particle-free air (0.95 LPM) was added to the sampled particles before passing through a dryer (TSI 3062, TSI Inc. MN, USA), followed by the air-liquid exposure chamber (ALI, CelTox sampler, NC, USA; detail in Appendix A.2). A vacuum pump at the outlet of the ALI chamber creates a pressure gradient and allows 2.2 LPM of flow through the ALI chamber (this includes 1.25 LPM of sampled air from eductor and 0.95 LPM of supplemental particle-free air).
A.2. CelTox sampler
Figure A2 shows a simplified schematic of the CelTox sampler. This system uses an oscillating electrostatic field to deposit positively charged particles onto cell-culture inserts. A pump at the exit of the exposure chamber draws air through the temperature-controlled chamber. The bottom surface (including deposition plate) of the chamber is heated to 37 °C. The humidifier connected upstream of the chamber can be heated to introduce a required amount of relative humidity for cell exposure studies. Furthermore, the whole setup (humidifier and the exposure chamber) sits inside an enclosure, with a fan that circulates the hot air around the setup.
The airflow in the system is parallel to the cellular inserts. Consequently, electrostatic precipitation is the driving force for particle deposition (precipitation region). For particles with little or no charge, the system includes a corona charge for enhanced deposition (charging region). This study did not use corona charging to avoid the problem of ozone generation associated with the use of the corona.
A.3. Dosimetry
For ALI exposure, the mass was measured by placing a glass slide onto an empty insert, which later was placed in one of the wells of the six-well plate. Before placing the glass slide, an aluminum circle was placed to cover the membrane of the insert to avoid any contact of the glass slide with media in the basolateral side. The inserts with glass slides contained the same volume of media as other wells with the cells. After exposure, the glass slides were gently lifted using a fine-end tweezer and moved to wells of 12-well plate, and 0.5 mL of ethanol was added and sonicated for 5–10 sec to suspend the particles. Quickly, 50 μL of the suspensions were transferred to a 96-well plate in triplicate and read for absorbance at 450 nm using a plate reader (BioTek, Synergy HTX, VT, USA).
A calibration curve between the mass concentration of particles in ethanol and the absorbance at 450 nm was created for use in dose calculation. The particles were collected after the dryer (Fig. A1) onto a filter with a pore size of 450 nm (Whatman Limited, GE Healthcare, IL, USA). The collected particles were gently scraped and collected as dry powder. A known amount of dry powder was weighed, and ethanol was added to prepare suspensions with a concentration of 350 μg/mL. Unlike DI water, hydrophobic combustion particles suspend relatively well in ethanol. The 350 μg/mL stock was serially diluted to obtain suspensions with concentrations of 175, 87.5, 43.75, 21.875, 10.938, 5.469, and 2.734 μg/mL. A 50 μL aliquot of the suspensions were taken in triplicate in a 96-well plate, and absorbance was measured at 450 nm. The absorbance was plotted against the known concentrations, and a linear curve was fitted to obtain the calibration curve (Fig. A3).
Although the mass was measured for each exposure experiment, the approximate time required to deposit the known mass was optimized using prior exposure studies. Multiple experiments with just inserts with glass slides (4 each run) were conducted. Particles were deposited for different time durations, and the deposited mass was calculated using the calibration curves. The mass was plotted against time, and an expression (Fig. A4) obtained from a linear fit to approximately estimate the time required for a certain mass dose (μg/cm2).
A.4. Cell viability assay
Cell viability was determined using Cell Counting Kit-8 (CCK-8) assay kits (Dojindo Molecular Technologies, Inc., Rockville, MD) according to the manufacturer’s instructions (Fig. A6). For ALI exposures, after collecting the media from the basolateral side for ELISA, 0.6 mL of 10% CCK solution was added onto the apical side of the inserts. For submerged and pseudo-ALI, the media was removed from the basolateral side, but the apical media was not removed. Additional media was added to obtain 0.6 mL media on top. Approximately 65 μL of CCK stock was added to the apical media to obtain a 10% (V/V%) CCK-8 concentration. All the plates were incubated for 40–60 min. The media was later moved to labeled vials and centrifuged for 6 min at 12 K xg to removed particles and any debris that may affect the absorbance readings. A total of 100 μl of supernatant from each sample was moved in a new 96 well plate in triplicate and measured for absorbance at 450 nm using a plate reader (BioTek, Synergy HTX, VT, USA). The cell viability was estimated using the following formula:
| (1) |
* negative control = no particle exposure in submerge and pseudo-ALI and air exposure in ALI.
Footnotes
Competing interest
The authors declare no conflict of interest. Dr. Kelly has a financial Interest in Tetrad Sensor Network Solutions, LLC. None of Tetrad’s technologies were used in this study.
Data availability statement
The author confirms that the data supporting the findings of this study are available within the article and appendix.
References
- 1.Khan JZ; Sun L; Tian Y; Shi G; Feng Y Chemical Characterization and Source Apportionment of PM1 and PM2.5 in Tianjin, China: Impacts of Biomass Burning and Primary Biogenic Sources. J Environ Sci 2021, 99, 196–209. DOI: 10.1016/j.jes.2020.06.027. [DOI] [PubMed] [Google Scholar]
- 2.Ambient (outdoor) Air Pollution https://www.who.int/news-room/fact-sheets/detail/ambient-(outdoor)-air-quality-and-health (accessed Sep. 2021).
- 3.Lewtas J Air Pollution Combustion Emissions: Characterization of Causative Agents and Mechanisms Associated with Cancer, Reproductive, and Cardiovascular Effects. Mutat Res 2007, 636, 95–133. DOI: 10.1016/j.mrrev.2007.08.003. [DOI] [PubMed] [Google Scholar]
- 4.Farina F; Lonati E; Milani C; Massimino L; Ballarini E; Donzelli E; Crippa L; Marmiroli P; Botto L; Corsetto PA; et al. In Vivo Comparative Study on Acute and Sub-Acute Biological Effects Induced by Ultrafine Particles of Different Anthropogenic Sources in BALB/c Mice. IJMS 2019, 20, 2805. DOI: 10.3390/ijms20112805. [DOI] [PMC free article] [PubMed] [Google Scholar]
- 5.Steiner S; Bisig C; Petri-Fink A; Rothen-Rutishauser B Diesel Exhaust: current Knowledge of Adverse Effects and Underlying Cellular Mechanisms the Diesel Engine: Opportunity and Challenge. Arch Toxicol 2016, 90, 1541–1553. DOI: 10.1007/s00204-016-1736-5. [DOI] [PMC free article] [PubMed] [Google Scholar]
- 6.Chuang H-C; Cheng Y-L; Lei Y-C; Chang H-H; Cheng T-J Protective Effects of Pulmonary Epithelial Lining Fluid on Oxidative Stress and DNA Single-Strand Breaks Caused by Ultrafine Carbon Black, Ferrous Sulphate and Organic Extract of Diesel Exhaust Particles. Toxicol Appl Pharmacol 2013, 266, 329–334. DOI: 10.1016/j.taap.2012.12.004. [DOI] [PubMed] [Google Scholar]
- 7.Forchhammer L; Loft S; Roursgaard M; Cao Y; Riddervold IS; Sigsgaard T; Møller P Expression of Adhesion Molecules, Monocyte Interactions and Oxidative Stress in Human Endothelial Cells Exposed to Wood Smoke and Diesel Exhaust Particulate Matter. Toxicol Lett 2012, 209, 121–128. DOI: 10.1016/j.toxlet.2011.12.003. [DOI] [PubMed] [Google Scholar]
- 8.Steiner S; Czerwinski J; Comte P; Popovicheva O; Kireeva E; Müller L; Heeb N; Mayer A; Fink A; Rothen-Rutishauser B Rothen-Rutishauser, B. Comparison of the Toxicity of Diesel Exhaust Produced by Bio- and Fossil Diesel Combustion in Human Lung Cells in Vitro. Atmos. Environ 2013, 81, 380–388. DOI: 10.1016/j.atmosenv.2013.08.059. [DOI] [Google Scholar]
- 9.Jaramillo IC; Sturrock A; Ghiassi H; Woller DJ; Deering-Rice CE; Lighty JS; Paine R; Reilly C; Kelly KE Effects of Fuel Components and Combustion Particle Physicochemical Properties on Toxicological Responses of Lung Cells. J Environ Sci Health A Tox Hazard Subst Environ Eng 2018, 53, 295–309. DOI: 10.1080/10934529.2017.1400793. [DOI] [PMC free article] [PubMed] [Google Scholar]
- 10.Lichtveld KM; Ebersviller SM; Sexton KG; Vizuete W; Jaspers I; Jeffries HE In Vitro Exposures in Diesel Exhaust Atmospheres: Resuspension of PM from Filters versus Direct Deposition of PM from Air. Environ Sci Technol 2012, 46, 9062–9070. DOI: 10.1021/es301431s. [DOI] [PMC free article] [PubMed] [Google Scholar]
- 11.Fox JR; Cox DP; Drury BE; Gould TR; Kavanagh TJ; Paulsen MH; Sheppard L; Simpson CD; Stewart JA; Larson TV; Kaufman JD Chemical Characterization and in Vitro Toxicity of Diesel Exhaust Particulate Matter Generated under Varying Conditions. Air Qual Atmos Health 2015, 8, 507–519. DOI: 10.1007/s11869-014-0301-8. [DOI] [PMC free article] [PubMed] [Google Scholar]
- 12.Kaur K; Mohammadpour R; Jaramillo I; Ghandehari H; Reilly C; Paine R; Kelly K Application of a Quartz Crystal Microbalance to Measure the Mass Concentration of Combustion Particle Suspensions. J. Aerosol Sci 2019, 137, 105445. DOI: 10.1016/j.jaerosci.2019.105445. [DOI] [PMC free article] [PubMed] [Google Scholar]
- 13.Lenz AG; Karg E; Lentner B; Dittrich V; Brandenberger C; Rothen-Rutishauser B; Schulz H; Ferron GA; Schmid O A Dose-Controlled System for Air-Liquid Interface Cell Exposure and Application to Zinc Oxide Nanoparticles. Part. Fibre Toxicol 2009, 6, 32. DOI: 10.1186/1743-8977-6-32. [DOI] [PMC free article] [PubMed] [Google Scholar]
- 14.Ihalainen M; Jalava P; Ihantola T; Kasurinen S; Uski O; Sippula O; Hartikainen A; Tissari J; Kuuspalo K; Lähde A; et al. Design and Validation of an Air-Liquid Interface (ALI) Exposure Device Based on Thermophoresis. Aerosol Sci. Technol 2019, 53, 133–145. DOI: 10.1080/02786826.2018.1556775. [DOI] [Google Scholar]
- 15.Aufderheide M; Halter B; Möhle N; Hochrainer D The CULTEX RFS: A Comprehensive Technical Approach for the in Vitro Exposure of Airway Epithelial Cells to the Particulate Matter at the Air-Liquid Interface. Biomed Res. Int 2013, 2013, 1–15. DOI: 10.1155/2013/734137. [DOI] [PMC free article] [PubMed] [Google Scholar]
- 16.Volckens J; Dailey L; Walters G; Devlin RB; Devlin R Direct Particle-to-Cell Deposition of Coarse Ambient Particulate Matter Increases the Production of Inflammatory Mediators from Cultured Human Airway Epithelial Cells. Environ Sci Technol 2009, 43, 4595–4599. DOI: 10.1021/es900698a. [DOI] [PMC free article] [PubMed] [Google Scholar]
- 17.Zavala J; Lichtveld K; Ebersviller S; Carson JL; Walters GW; Jaspers I; Jeffries HE; Sexton KG; Vizuete W The Gillings Sampler-An Electrostatic Air Sampler as an Alternative Method for Aerosol In Vitro Exposure Studies. Chem Biol Interact 2014, 220, 158–168. DOI: 10.1016/j.cbi.2014.06.026. [DOI] [PMC free article] [PubMed] [Google Scholar]
- 18.Tilly TB; Ward RX; Luthra JK; Robinson SE; Eiguren-Fernandez A; Lewis GS; Salisbury RL; Lednicky JA; Sabo-Attwood TL; Hussain SM; Wu C-Y Condensational Particle Growth Device for Reliable Cell Exposure at the Air–Liquid Interface to Nanoparticles. Aerosol Sci. Technol 2019, 53, 1415–1428. DOI: 10.1080/02786826.2019.1659938. [DOI] [PMC free article] [PubMed] [Google Scholar]
- 19.Kaur K; Jaramillo IC; Mohammadpour R; Sturrock A; Ghandehari H; Reilly C; Paine R; Kelly KE Effect of Collection Methods on Combustion Particle Physicochemical Properties and Their Biological Response in a Human Macrophage-like Cell Line. J Environ Sci Health A Tox Hazard Subst Environ Eng 2019, 54, 1170–1185. DOI: 10.1080/10934529.2019.1632626. [DOI] [PMC free article] [PubMed] [Google Scholar]
- 20.Secondo LE; Liu NJ; Lewinski NA Methodological Considerations When Conducting in Vitro, Air-Liquid Interface Exposures to Engineered Nanoparticle Aerosols. Crit Rev Toxicol 2017, 47, 225–262. DOI: 10.1080/10408444.2016.1223015. [DOI] [PubMed] [Google Scholar]
- 21.Maikawa CL; Zimmerman N; Rais K; Shah M; Hawley B; Pant P; Jeong C-H; Delgado-Saborit JM; Volckens J; Evans G; et al. Murine Precision-Cut Lung Slices Exhibit Acute Responses following Exposure to Gasoline Direct Injection Engine Emissions. Sci. Total Environ 2016, 568, 1102–1109. DOI: 10.1016/j.scitotenv.2016.06.173. [DOI] [PubMed] [Google Scholar]
- 22.Holder AL; Lucas D; Goth-Goldstein R; Koshland CP Cellular Response to Diesel Exhaust Particles Strongly Depends on the Exposure Method. Toxicol Sci 2008, 103, 108–115. DOI: 10.1093/toxsci/kfn014. [DOI] [PubMed] [Google Scholar]
- 23.Tomašek I; Horwell CJ; Damby DE; Barošová H; Geers C; Petri-Fink A; Rothen-Rutishauser B; Clift MJD Combined Exposure of Diesel Exhaust Particles and Respirable Soufrière Hills Volcanic Ash Causes a (Pro-)Inflammatory Response in an in Vitro Multicellular Epithelial Tissue Barrier Model. Part Fibre Toxicol 2016, 13, 67. DOI: 10.1186/s12989-016-0178-9. [DOI] [PMC free article] [PubMed] [Google Scholar]
- 24.Barosova H; Chortarea S; Peikertova P; Clift MJD; Petri-Fink A; Kukutschova J; Rothen-Rutishauser B Biological Response of an in Vitro Human 3D Lung Cell Model Exposed to Brake Wear Debris Varies Based on Brake Pad Formulation. Arch Toxicol 2018, 92, 2339–2351. DOI: 10.1007/s00204-018-2218-8. [DOI] [PMC free article] [PubMed] [Google Scholar]
- 25.Endes C; Schmid O; Kinnear C; Mueller S; Camarero-Espinosa S; Vanhecke D; Foster EJ; Petri-Fink A; Rothen-Rutishauser B; Weder C; Clift MJ An in Vitro Testing Strategy towards Mimicking the Inhalation of High Aspect Ratio Nanoparticles. Part. Fibre Toxicol 2014, 11, 40. DOI: 10.1186/s12989-014-0040x. [DOI] [PMC free article] [PubMed] [Google Scholar]
- 26.Lovén K; Dobric J; Bölükbas DA; Kåredal M; Tas S; Rissler J; Wagner DE; Isaxon C Toxicological Effects of Zinc Oxide Nanoparticle Exposure: An In Vitro Comparison between Dry Aerosol air-Liquid Interface and Submerged Exposure Systems. Nanotoxicology 2021, 15, 494–510. DOI: 10.1080/17435390.2021.1884301. [DOI] [PubMed] [Google Scholar]
- 27.Ghio AJ; Dailey LA; Soukup JM; Stonehuerner J; Richards JH; Devlin RB Growth of Human Bronchial Epithelial Cells at an Air-Liquid Interface Alters the Response to Particle Exposure. Part Fibre Toxicol 2013, 10, 25. DOI: 10.1186/1743-8977-10-25. [DOI] [PMC free article] [PubMed] [Google Scholar]
- 28.Stoehr LC; Madl P; Boyles MSP; Zauner R; Wimmer M; Wiegand H; Andosch A; Kasper G; Pesch M; Lütz-Meindl U; et al. Enhanced Deposition by Electrostatic Field-Assistance Aggravating Diesel Exhaust Aerosol Toxicity for Human Lung Cells. Environ Sci Technol 2015, 49, 8721–8730. DOI: 10.1021/acs.est.5b02503. [DOI] [PubMed] [Google Scholar]
- 29.Daigneault M; Preston J. a.; Marriott HM; Whyte MKB; Dockrell DH The Identification of Markers of Macrophage Differentiation in PMA-Stimulated THP-1 Cells and Monocyte-Derived Macrophages. PLoS One 2010, 5, e8668. DOI: 10.1371/journal.pone.0008668. [DOI] [PMC free article] [PubMed] [Google Scholar]
- 30.Kasurinen S; Happo MS; Rönkkö TJ; Orasche J; Jokiniemi J; Kortelainen M; Tissari J; Zimmermann R; Hirvonen M-R; Jalava PI Differences between co-Cultures and Monocultures in Testing the Toxicity of Particulate Matter Derived from Log Wood and Pellet Combustion. PLoS One 2018, 13, e0192453. DOI: 10.1371/journal.pone.0192453. [DOI] [PMC free article] [PubMed] [Google Scholar]
- 31.Wang G; Zhang X; Liu X; Zheng J; Chen R; Kan H Ambient Fine Particulate Matter Induce Toxicity in Lung Epithelial-Endothelial co-Culture Models. Toxicol Lett 2019, 301, 133–145. DOI: 10.1016/j.toxlet.2018.11.010. [DOI] [PubMed] [Google Scholar]
- 32.Livak KJ; Schmittgen TD Analysis of Relative Gene Expression Data Using Real-Time Quantitative PCR and the 2(-Delta Delta C(T)) Method. Methods 2001, 25, 402–408. DOI: 10.1006/meth.2001.1262. [DOI] [PubMed] [Google Scholar]
- 33.Murdock RC; Braydich-Stolle L; Schrand AM; Schlager JJ; Hussain SM Characterization of Nanomaterial Dispersion in Solution Prior to in Vitro Exposure Using Dynamic Light Scattering Technique. Toxicol Sci 2008, 101, 239–253. DOI: 10.1093/toxsci/kfm240. [DOI] [PubMed] [Google Scholar]
- 34.Dhital NB; Wang S-X; Lee C-H; Su J; Tsai M-Y; Jhou Y-J; Yang H-H Effects of Driving Behavior on Real-World Emissions of Particulate Matter, Gaseous Pollutants and Particle-Bound PAHs for Diesel Trucks. Environ. Pollut 2021, 286, 117292. DOI: 10.1016/j.envpol.2021.117292. [DOI] [PubMed] [Google Scholar]
- 35.Kocbach A; Namork E; Schwarze PE Pro-Inflammatory Potential of Wood Smoke and Traffic-Derived Particles in a Monocytic Cell Line. Toxicology. 2008, 247, 123–132. DOI: 10.1016/j.tox.2008.02.014. [DOI] [PubMed] [Google Scholar]
- 36.Jalava PI; Salonen RO; Nuutinen K; Pennanen AS; Happo MS; Tissari J; Frey A; Hillamo R; Jokiniemi J; Hirvonen M Effect of Combustion Condition on Cytotoxic and Inflammatory Activity of Residential Wood Combustion Particles. Atmos. Environ 2010, 44, 1691–1698. DOI: 10.1016/j.atmosenv.2009.12.034. [DOI] [Google Scholar]
- 37.Schmid O; Cassee FR On the Pivotal Role of Dose for Particle Toxicology and Risk Assessment: exposure is a Poor Surrogate for Delivered Dose. Part Fibre Toxicol 2017, 14, 52. DOI: 10.1186/s12989-017-0233-1. [DOI] [PMC free article] [PubMed] [Google Scholar]
- 38.Manzano-León N; Serrano-Lomelin J; Sánchez BN; Quintana-Belmares R; Vega E; Vázquez-López I; Rojas-Bracho L; López-Villegas MT; Vadillo-Ortega F; Vizcaya-Ruiz A; et al. TNFα and IL-6 Responses to Particulate Matter in Vitro: Variation according to PM Size, Season, and Polycyclic Aromatic Hydrocarbon and Soil Content. Environ Health Perspect 2016, 124, 406–412. DOI: 10.1289/ehp.1409287. [DOI] [PMC free article] [PubMed] [Google Scholar]
- 39.Jalava PI; Hirvonen M-R; Sillanpää M; Pennanen AS; Happo MS; Hillamo R; Cassee FR; Gerlofs-Nijland M; Borm PJA; Schins RPF; et al. Associations of Urban Air Particulate Composition with Inflammatory and Cytotoxic Responses in RAW 246.7 Cell Line. Inhal Toxicol 2009, 21, 994–1006. DOI: 10.1080/08958370802695710. [DOI] [PubMed] [Google Scholar]
- 40.Drasler B; Sayre P; Steinhäuser KG; Petri-Fink A; Rothen-Rutishauser B Rothen-Rutishauser, B. In Vitro Approaches to Assess the Hazard of Nanomaterials. NanoImpact 2017, 8, 99–116. DOI: 10.1016/j.impact.2017.08.002. [DOI] [Google Scholar]
- 41.Monteiller C; Tran L; MacNee W; Faux S; Jones A; Miller B; Donaldson K The Pro-Inflammatory Effects of Low-Toxicity Low-Solubility Particles, Nanoparticles and Fine Particles, on Epithelial Cells in Vitro: The Role of Surface Area. Occup Environ Med 2007, 64, 609–615. DOI: 10.1136/oem.2005.024802. [DOI] [PMC free article] [PubMed] [Google Scholar]
- 42.Stoeger T; Reinhard C; Takenaka S; Schroeppel A; Karg E; Ritter B; Heyder J; Schulz H Instillation of Six Different Ultrafine Carbon Particles Indicates a Surface Area Threshold Dose for Acute Lung Inflammation in Mice. Environ. Health Perspect 2006, 114, 328–333. DOI: 10.1289/ehp.8266. [DOI] [PMC free article] [PubMed] [Google Scholar]
- 43.Schmid O; Stoeger T Surface Area is the Biologically Most Effective Dose Metric for Acute Nanoparticle Toxicity in the Lung. J. Aerosol Sci 2016, 99, 133–143. DOI: 10.1016/j.jaerosci.2015.12.006. [DOI] [Google Scholar]
- 44.Hawley B; McKenna D; Marchese A; Volckens J Time Course of Bronchial Cell Inflammation following Exposure to Diesel Particulate Matter Using a Modified EAVES. Toxicol Vitro 2014, 28, 829–837. DOI: 10.1016/j.tiv.2014.03.001. [DOI] [PubMed] [Google Scholar]
- 45.Hilton G; Barosova H; Petri-Fink A; Rothen-Rutishauser B; Bereman M Leveraging Proteomics to Compare Submerged versus Air-Liquid Interface Carbon Nanotube Exposure to a 3D Lung Cell Model. Toxicol Vitro 2019, 54, 58–66. DOI: 10.1016/j.tiv.2018.09.010. [DOI] [PubMed] [Google Scholar]
- 46.Wang G; Zhang X; Liu X; Zheng J Co-Culture of Human Alveolar Epithelial (A549) and Macrophage (THP-1) Cells to Study the Potential Toxicity of Ambient PM2.5: A Comparison of Growth under ALI and Submerged Conditions. Toxicol Res 2020, 9, 636–651. DOI: 10.1093/toxres/tfaa072. [DOI] [PMC free article] [PubMed] [Google Scholar]
- 47.Blank F; Rothen-Rutishauser BM; Schurch S; Gehr P An Optimized in Vitro Model of the Respiratory Tract Wall to Study Particle Cell Interactions. J Aerosol Med 2006, 19, 392–405. DOI: 10.1089/jam.2006.19.392. [DOI] [PubMed] [Google Scholar]
Associated Data
This section collects any data citations, data availability statements, or supplementary materials included in this article.
Supplementary Materials
Data Availability Statement
The author confirms that the data supporting the findings of this study are available within the article and appendix.