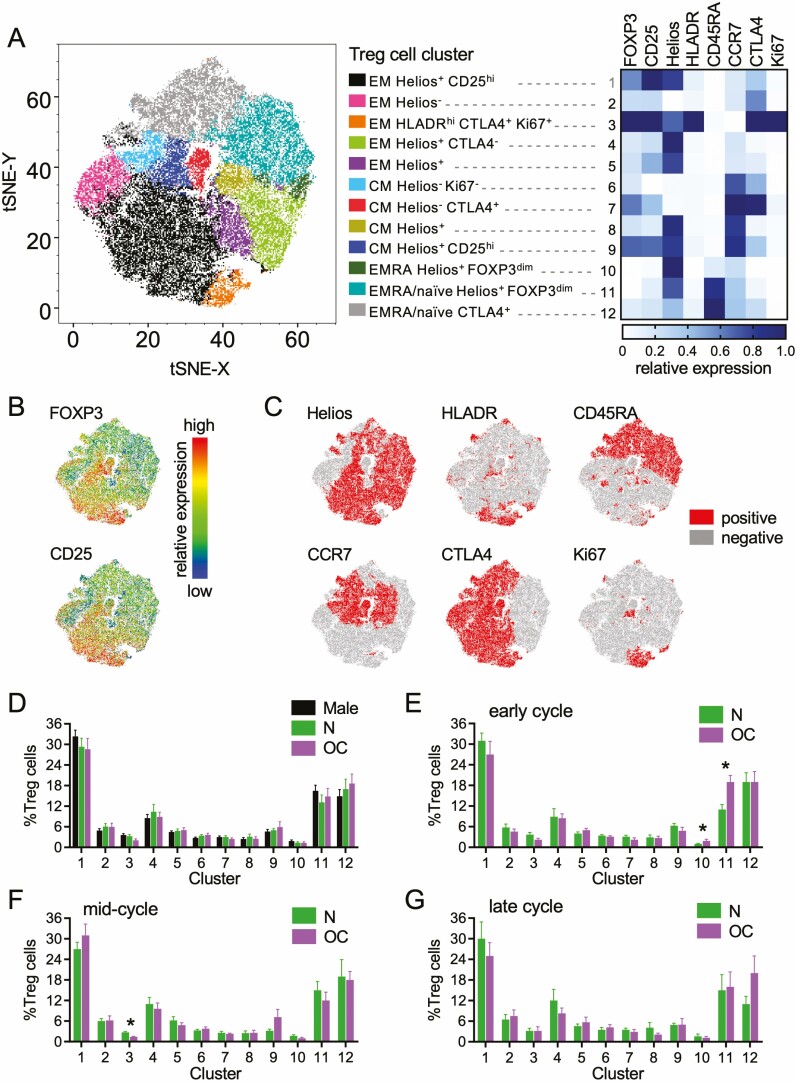
Figure 9.
Plasma 17β-estradiol (A) and progesterone (B) levels in naturally cycling women and women taking oral contraception. Peripheral blood was drawn at early-, mid-, and late-cycle stages from naturally cycling women (N), women using oral contraception (OC), and men. Data for flow cytometry phenotyping of CD3+CD4+FOXP3+CD25+CD127− Treg cells was concatenated into a single file and transformed by the t-distributed stochastic neighbor embedding (tSNE) algorithm. X-shift identified 12 unique cell clusters and the relative expression intensity of each marker within each cluster was calculated using FlowJo software and is shown on a heat map (A). Heat map tSNE plots show the relative expression of FOXP3 and CD25 within the Treg cells (B) and the Treg cells positive for Helios, HLADR, CD45RA, CCR7, CTLA4, and Ki67 within the tSNE plot are shown (C). The proportion that each cluster contributes to total Treg cells was calculated, and estimated marginal means were generated for men and the N, and OC groups (D). The mean ± SE of the mean proportion of each cluster for N and OC groups at the early- (E), mid- (F), and late-cycle (G) stages were calculated. The effects of participant group, OC use, and cycle phase on Treg cell clusters were assessed by 1-way analysis of variance (ANOVA; n = 8-15 participants/group). The effects of participant group, OC use, and cycle phase on Treg cell clusters were assessed by 1-way ANOVA and post hoc Tukey t-test (n = 8-15 participants/group; *P < 0.05).

