Abstract
Grapefruit (Citrus paradisii) and shaddock (Citrus maxima) juices are used in folk medicine for the management of hypertension and other cardiovascular diseases, but the mechanism of action by which they exert their therapeutic action is unclear. The aim of this study was to investigate the effect of grapefruit and shaddock juices on angiotensin-1-converting enzyme (ACE) activity in vitro and the hypocholesterolemic properties of the juices in rats fed a high-cholesterol diet. Grapefruit juice had higher total phenol and flavonoid contents than shaddock juice, while both juices inhibited ACE activity in a dose-dependent manner. Furthermore, administration of the juices to rats fed a high-cholesterol diet caused a significant reduction in plasma total cholesterol, triglyceride, and low-density lipoprotein–cholesterol levels and an increase in high-density lipoprotein–cholesterol levels. The inhibition of ACE activity in vitro and in vivo hypocholesterolemic effect of the juices could explain the use of the juices in the management of cardiovascular diseases.
Keywords: Angiotensin-I-converting enzyme, Grapefruit, Hypocholesterolemia, Shaddock
1. Introduction
Cardiovascular diseases (CVDs) are regarded as the number one cause of death worldwide due to the fact that more people die yearly from CVDs than from any other cause, with >80% of CVD deaths taking place in low- and middle-income countries [1]. Of these worldwide deaths, an estimated 78% were due to coronary heart disease and stroke [2]. CVDs are projected to remain the single leading cause of death worldwide, with 23.3 million sufferers expected by 2030 [3]. The development of hypertension and other CVDs have been strongly linked with hypercholesterolemia [4–6].
Citrus fruit species are one of the most popularly consumed fruits in the world today and they are usually consumed as fresh produce or juice [7]. The major bioactive compounds in citrus juices are flavonoids, which occur in different structural forms in a diversity of plants [8]. These flavonoids include the polymethoxylated flavones, nobiletin and tangeretin and the flavanones, hesperetin, and naringenin [9]. Flavonoids have been associated with reduced risk of certain chronic diseases and the prevention of certain CVDs. [9]. Angiotensin-I-converting enzyme (ACE) is a dipeptidyl carboxypeptidase that catalyses the in vivo conversion of angiotensin I (DRVYIHPFHL), found circulating in the plasma into the potent vasopressor angiotensin II by removal of the C-terminal His–Leu [10]. The objectives of this project were to investigate the hypocholesterolemic effect of two common citrus fruit juices: grapefruit (Citrus paradisii) and shaddock (Citrus aurantifolia).
2. Methods
2.1. Sample collection and preparation
Two citrus fruits, grapefruit (C. paradisii) and shaddock (C. aurantifolia) were purchased from Main Market, Akure, Nigeria (Latitude 07° 14IN, Longitude 05° 11IE). The citrus fruits were washed and the juice extracted by manual squeezing. Reagents used include 1,10-phenanthroline, gallic acid, and Folin–Ciocalteau’s reagent, which were procured from Sigma–Aldrich (St. Louis, MO, USA), methanol, sodium carbonate, ethyl acetate, hydrochloric acid, Tris–HCl, aluminum chloride, and potassium acetate were sourced from BDH Chemicals (Poole, Dorset, UK). All the kits used for bioassay were sourced from Randox Laboratories Ltd. (Crumlin, Antrim, UK). The water was glass distilled.
2.2. Determination of total phenol content
The total phenol content was determined according to the method of Singleton et al [11]. Appropriate dilutions of the juices were oxidized with 2.5 mL 10% Folin–Ciocalteau’s reagent (v/v) and neutralized by 2.0 mL of 7.5% sodium carbonate. The reaction mixture was incubated for 40 minutes at 45°C and the absorbance was measured at 765 nm in the spectrophotometer. The total phenol content was subsequently calculated as gallic acid equivalent.
2.3. Determination of total flavonoid content
The total flavonoid content was determined using a slightly modified method reported by Meda et al [12]. Briefly, 0.5 mL of appropriately diluted samples were mixed with 0.5 mL methanol, 50 μL 10% AlCl3, 50 μL 1M potassium acetate, and 1.4 mL water, and allowed to incubate at room temperature for 30 minutes. The absorbance of the reaction mixture was subsequently measured at 415 nm and the total flavonoid content calculated as quercetin equivalent.
2.4. ACE inhibition assay
The ACE inhibition was done using a slightly modified method of Cushman and Cheung [13]. Juice dilutions (0–50 μL) and 50 μL ACE (EC 3.4.15.1) solution were incubated at 37°C for 15 minutes. The enzymatic reaction was initiated by adding 150 μL of 8.33 mM of the substrate Bz–Gly–His–Leu in 125 mM Tris–HCl buffer (pH 8.3) to the mixture. After incubation for 30 minutes at 37°C, the reaction was arrested by adding 250 μL 1M HCl. The Gly–His bond was then cleaved and the Bz–Gly produced by the reaction was extracted with 1.5 mL ethyl acetate. Thereafter, the mixture was centrifuged at 1000g to separate the ethyl acetate layer; then 1 mL of the ethyl acetate layer was transferred to a clean test tube and evaporated. The residue was redissolved in distilled water and its absorbance was measured at 228 nm. Captopril in the therapeutic dose range was used as a positive control.
2.5. Animals
Approval was obtained from the relevant departmental ethics committee responsible for the use of laboratory animals. The handling and use of the animals were in accordance with the National Institutes for Health Guide for the Care and Use of Laboratory Animals. Adult male Wistar rats weighing 80–130 g were purchased from the breeding colony of the Department of Biochemistry, University of Ilorin, Ilorin, Nigeria. The rats were maintained at 25°C on a 12-hour light/dark cycle with free access to food and water. They were acclimatized under these conditions for 2 weeks prior to the commencement of the experiments.
2.6. High cholesterol fed (hypercholesterolemia rat model) bioassay
After 2 weeks of acclimatization, the rats were randomly divided into nine groups of six animals each. Group I was fed basal diet, Group II was fed basal diet containing 2% cholesterol (positive control), Group III was fed basal diet containing 2% cholesterol with 0.3 mg/kg simvastatin, and Groups IV–IX were administered citrus juices of varying concentrations (0.5–2.0 mL) while being constantly fed basal diet plus 2% cholesterol. The experiment lasted for 21 days, during which the daily feed intake and weight gain were monitored throughout the experiment that lasted for 21 days, after which the animals were decapitated by cervical dislocation after an overnight fast. The blood was rapidly collected by direct heart puncture and the plasma was prepared. Total cholesterol, high-density lipoprotein (HDL)–cholesterol, triglyceride, and low-density lipoprotein (LDL)–cholesterol were determined using commercially available kits (Randox Laboratories).
2.7. Preparation of plasma
At the end of the feeding trial, whole blood of the sacrificed rats was collected into EDTA bottles and centrifuged at 800g for 10 minutes to separate the plasma. The plasma was then decanted into plain sample bottles and stored in a refrigerator before analysis.
2.8. Determination of plasma triglyceride concentration
The triglyceride concentration was determined using a colorimetric method as described by Tietz [14]. Briefly, 10 μL of the sample was mixed with 1 mL PIPES reagent (40 mM phosphate buffer, 5.5 mM 4-chlorophenol, and 17.5 mM Mg2+) and enzyme reagent (4-aminophenazone, ATP, lipase, glycerol kinase, glycerol-3-phosphate oxidase, and peroxidase). Thereafter, the mixture was incubated for 5 minutes at 37°C and the absorbance at 546 nm was taken against reagent blank within 1 hour. The triglyceride concentration was subsequently calculated against the standard.
2.9. Determination of plasma total cholesterol concentration
One milliliter of the reacting mixture containing 4-amino-antipyrine, phenol, peroxidase, cholesterol esterase, cholesterol oxidase and 80 mM PIPES buffer, pH 6.8, was mixed with 10 μL plasma and incubated for 5 minutes at 37°C. The absorbance at 546 nm was then taken against the reagent blank within 1 hour. The concentration of cholesterol in the sample was subsequently calculated against a standard.
2.10. Determination of plasma HDL–cholesterol concentration
The precipitation was carried out according to the method of Lopes-Virella et al [15] as described in the kit manufacturer’s manual (Randox Laboratories). Briefly, 200 μL plasma was mixed with 500 μL precipitant (0.55 mM phosphotungstic acid and 25 mM magnesium chloride) and allowed to sit for 10 minutes at room temperature. The mixture was centrifuged for 10 minutes at 800g. Thereafter, the clear supernatant was separated off and subjected to the same procedure for the determination of cholesterol, as described above.
2.11. Determination of plasma LDL–cholesterol concentration
The LDL–cholesterol concentration of the plasma samples was determined according to the equation of Friedewald et al [16].
| (1) |
2.12. Determination of artherogenic index
Artherogenic index was calculated as the ratio of LDL–cholesterol to HDL–cholesterol.
2.13. Data analysis
The results of the replicates were expressed as mean ± standard deviation. One-way analysis of variance and the least significance difference were carried out. Significance was accepted at p ≤ 0.05.
3. Results
3.1. Total phenol and flavonoid contents
Table 1 shows that the total phenolic and flavonoid contents of the juices reported as gallic acid equivalent revealed that grapefruit juice had significantly (p < 0.05) higher total phenolic and flavonoid contents than shaddock juice.
Table 1.
Total phenol and flavonoid contents, EC50 values of ACE inhibition of grapefruit and shaddock juices.
| Grapefruit | Shaddock | |
|---|---|---|
| Total phenol (mg GAE/L) | 134.7 ± 2.8a | 100.3 ± 2.8b |
| Total flavonoid (mg QE/L) | 35.0 ± 0.3a | 29.7 ± 0.4b |
| ACE activity inhibition (mL/L) | 2.51 ± 0.05b | 2.24 ± 0.06a |
Data are presented as mean ± standard deviation, n = 3. Data with the same superscript number on the same row are not significantly (p < 0.05) different.
ACE = angiotensin-I-converting enzyme; EC50 = half maximal effective concentration; GAE = gallic acid equivalent; QE = quercetin equivalent.
3.2. Effect of citrus fruit juices on ACE activity
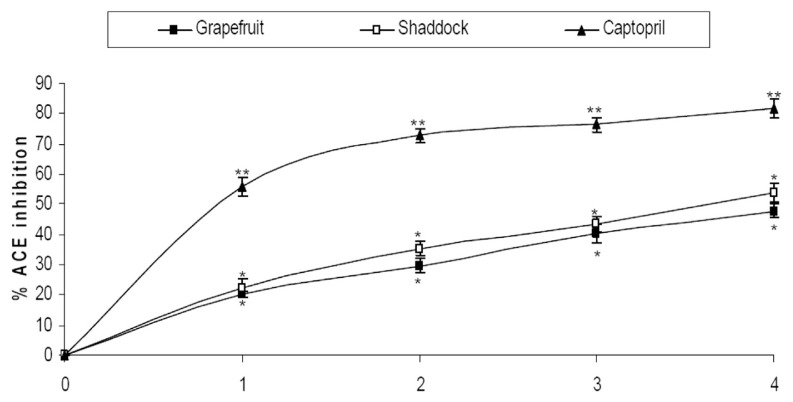
The interaction of the citrus fruit juices with ACE is presented in Fig. 1 and it reveals that the juices inhibited ACE activity in a dose-dependent manner. Shaddock juice had a significantly higher (p < 0.05) inhibitory effect on ACE activity than grapefruit juice (Table 1). However, the juices had lower inhibition of the enzyme activity than captopril.
Fig. 1.
Interaction of citrus fruit juices with ACE. The citrus juices concentrations for the points are 0, 0.5 mL/L, 1.5 mL/L, 2.0 mL/L, and 2.5 mL/L. The captopril concentrations for the points are 0, 5.0 mg/L, 10.0 mg/L, 25.0 mg/L, and 50.0 mg/L. Points with same annotation (*,**,***) along the plot are not significantly different. ACE = angiotensin-I converting enzyme.
3.3. Lipid profiles
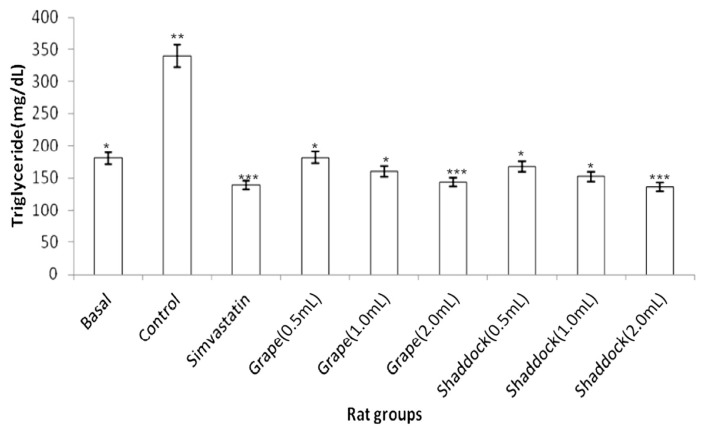
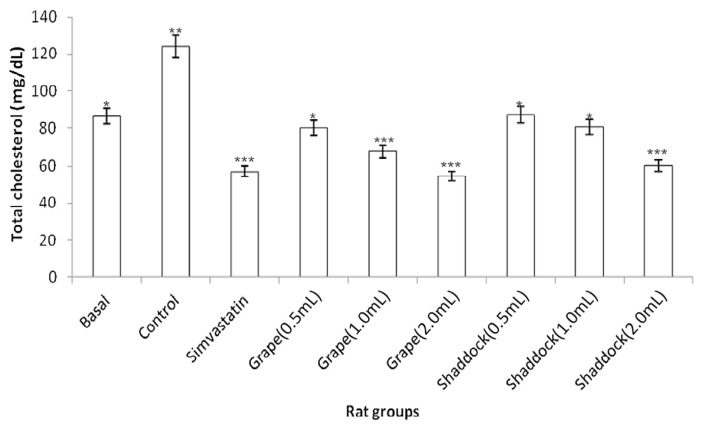
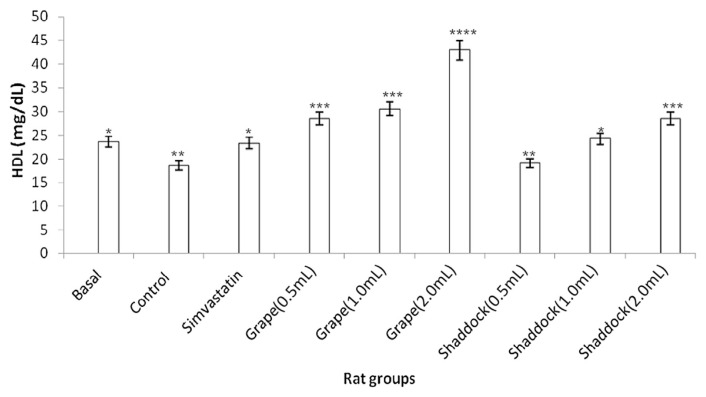
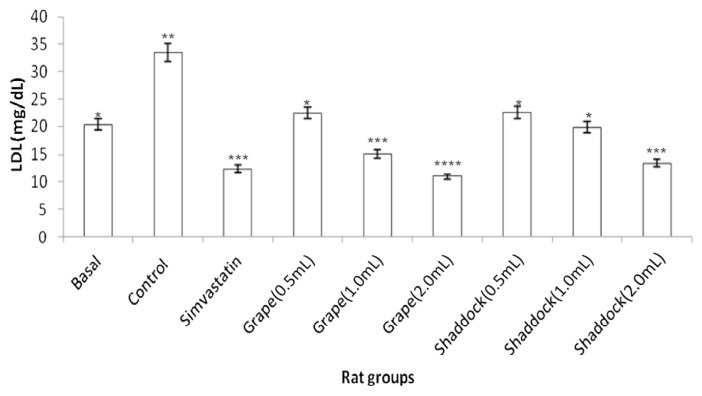
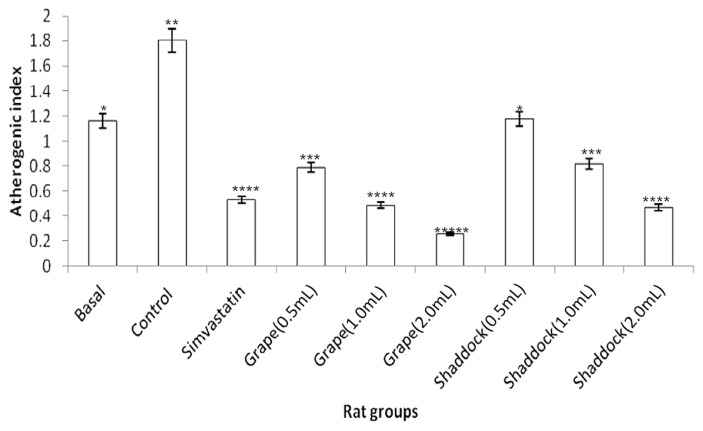
In rats fed a high-cholesterol diet, triglyceride levels decreased with increased quantities of citrus fruit juices when compared to the controls (Fig. 2): grapefruit (181.11 mg/dL vs. 143.15 mg/dL) and shaddock (167.91 mg/dL vs. 136.21 mg/dL). The total cholesterol levels in the rats fed a high-cholesterol diet with citrus fruit juices are shown in Fig. 3. There was a decrease in total cholesterol with increased quantities of citrus fruit juices when compared to the controls: grapefruit (80.34 mg/dL vs. 54.51 mg/dL) and shaddock (87.32 mg/dL vs. 60.32 mg/dL). The effect of citrus fruit juices on plasma HDL–cholesterol level is presented in Fig. 4. There was a significant increase (p < 0.05) in plasma HDL–cholesterol in all the citrus fruit juice groups in relation to the control group. The effect of the citrus fruit juices on plasma LDL–cholesterol level is presented in Fig. 5. There was a significant decrease (p < 0.05) in plasma LDL–cholesterol in all the citrus fruit juice groups in relation to the control group. The effect of the citrus fruit juices on plasma atherogenic index is presented in Fig. 6. There was a significant decrease (p < 0.05) in atherogenic index in the rats administered citrus fruit juice compared with the control group. Table 2 shows that there was no significant difference in the average food intake in all the groups, while there were variations among the groups for percentage weight gain.
Fig. 2.
Effect of citrus fruit juice administration on plasma triglyceride level in rats fed a high-cholesterol diet. Basal = normal control rats fed basal diet; Control = rats fed a high-cholesterol diet (positive control); Simvastatin = rats fed a high-cholesterol diet receiving simvastatin orally; Grape (0.5 mL) = rats fed high-cholesterol diet administered 0.5 mL grapefruit juice; Grape (1.0 mL) = rats fed high-cholesterol diet administered 1.0 mL grapefruit juice; Grape (2.0 mL) = rats fed high-cholesterol diet administered 2.0 mL grapefruit juice; Shaddock (0.5 mL) = rats fed high-cholesterol diet administered 0.5 mL shaddock juice; Shaddock (1.0 mL) = rats fed high-cholesterol diet administered 1.0 mL shaddock juice; and Shaddock (2.0 mL) = rats fed high-cholesterol diet administered 2.0 mL shaddock juice. Bars with same annotation (*,**,***) are not significantly different.
Fig. 3.
Effect of citrus fruit juice on plasma cholesterol level in rats fed a high-cholesterol diet. Basal = normal control rats fed basal diet; Control = rats fed a high-cholesterol diet (positive control); Simvastatin = rats fed a high-cholesterol diet receiving simvastatin orally; Grape (0.5 mL) = rats fed high-cholesterol diet administered 0.5 mL grapefruit juice; Grape (1.0 mL) = rats fed high-cholesterol diet administered 1.0 mL grapefruit juice; Grape (2.0 mL) = rats fed high-cholesterol diet administered 2.0 mL grapefruit juice; Shaddock (0.5 mL) = rats fed high-cholesterol diet administered 0.5 mL shaddock juice; Shaddock (1.0 mL) = high-cholesterol diet administered 1.0 mL shaddock juice; and Shaddock (2.0 mL) = rats fed high-cholesterol diet administered 2.0 mL shaddock juice. Bars with same annotation (*,**,***) are not significantly different.
Fig. 4.
Effect of citrus fruit juice on plasma HDL level in rats fed a high-cholesterol diet. Basal = normal control rats fed basal diet; Control = rats fed a high-cholesterol diet (positive control); Simvastatin = rats fed a high-cholesterol diet receiving simvastatin orally; Grape (0.5 mL) = rats fed high-cholesterol diet administered 0.5 mL grapefruit juice; Grape (1.0 mL) = rats fed high-cholesterol diet administered 1.0 mL grapefruit juice; Grape (2.0 mL) = rats fed high-cholesterol diet administered 2.0 mL grapefruit juice; Shaddock (0.5 mL) = rats fed high-cholesterol diet administered 0.5 mL shaddock juice; Shaddock (1.0 mL) = rats fed high-cholesterol diet administered 1.0 mL shaddock juice; and Shaddock (2.0 mL) – = rats fed high-cholesterol diet administered 2.0 mL shaddock juice. Bars with same annotation (*,**,***) are not significantly different.
Fig. 5.
Effect of citrus fruit juice on plasma LDL level in rats fed a high-cholesterol diet. Basal = normal control rats fed basal diet; Control = rats fed a high-cholesterol diet (positive control); Simvastatin = rats fed a high-cholesterol diet receiving simvastatin orally; Grape (0.5 mL) = rats fed high-cholesterol diet administered 0.5 mL grapefruit juice; Grape (1.0 mL) = rats fed high-cholesterol diet administered 1.0 mL grapefruit juice; Grape (2.0 mL) = rats fed high-cholesterol diet administered 2.0 mL grapefruit juice; Shaddock (0.5 mL) = rats fed high-cholesterol diet administered 0.5 mL shaddock juice; Shaddock (1.0 mL) = rats fed high-cholesterol diet administered 1.0 mL shaddock juice; and Shaddock (2.0 mL) = rats fed high-cholesterol diet administered 2.0 mL shaddock juice. Bars with same annotation (*,**,***) are not significantly different.
Fig. 6.
Effect of citrus fruit juice on atherogenic index in rats fed HCD. Basal = normal control rats fed basal diet; Control = rats fed a HCD (positive control); Simvastatin = rats fed a HCD receiving simvastatin orally; Grape (0.5 mL) = rats fed HCD administered 0.5 mL grapefruit juice; Grape (1.0 mL) = rats fed HCD administered 1.0 mL grapefruit juice; Grape (2.0 mL) = rats fed HCD administered 2.0 mL grapefruit juice; Shaddock (0.5 mL) = rats fed HCD administered 0.5 mL shaddock juice; Shaddock (1.0 mL) = rats fed HCD administered 1.0 mL shaddock juice; and Shaddock (2.0 mL) = rats fed HCD administered 2.0 mL shaddock juice. Bars with same annotation (*,**,***) are not significantly different.
Table 2.
Average food intakes and weight gain of HPC rats administered citrus fruit juices.
| Groupsa | Diet treatments | Food intake (g/rat/d) | Weight gain (%) |
|---|---|---|---|
| I | Normal control rats (basal) | 9.8 ± 0.2a | 7.6 ± 0.4a |
| II | HPC control rats (basal) | 9.9 ± 0.1a | 21.9 ± 1.2b |
| III | HPC control rats + simvastatin | 9.8 ± 0.2a | 5.6 ± 0.4c |
| IV | HPC control rats + 0.5 mL grapefruit | 9.8 ± 0.1a | 14.2 ± 0.9d |
| V | HPC control rats + 1.0 mL grapefruit | 9.8 ± 0.1a | 9.2 ± 0.6e |
| VI | HPC control rats + 2.0 mL grapefruit | 9.9 ± 0.1a | 15.7 ± 0.8d |
| VII | HPC control rats + 0.5 mL shaddock | 9.9 ± 0.1a | 12.9 ± 1.1d |
| VIII | HPC control rats + 1.0 mL shaddock | 9.8 ± 0.2a | 8.4 ± 0.6a |
| IX | HPC control rats + 2.0 mL shaddock | 9.7 ± 0.1a | 6.5 ± 0.7c |
HPC = hypercholesterolemic positive control, HCD = high-cholesterol diet. Data with the same superscript number on the same column are not significantly (p < 0.05) different.
Group I – normal control rats fed basal diet; Group II – rats fed a HCD (positive control); Group III – rats fed a HCD receiving simvastatin orally; Group IV – rats fed HCD administered 0.5 mL grapefruit juice; Group V – rats fed HCD administered 1.0 mL grapefruit juice; Group VI – rats fed HCD administered 2.0 mL grapefruit juice; Group VII – rats fed HCD administered 0.5 mL shaddock juice; Group VIII – rats fed HCD administered 1.0 mL shaddock juice; and Group IX – rats fed HCD administered 2.0 mL shaddock juice.
4. Discussion
Evidence from population studies shows that a higher flavonoid intake may reduce the risk of CVD [17]. The citrus fruit juices were both found to inhibit ACE activity in vitro, which could indicate their probable use in the management/treatment of hypertension and heart failure. A lot of evidence exists in the literature linking hypertension to CVDs [18]. It is a critical enzyme required in the rennin–angiotensin system, which regulates blood pressure, fluid and electrolyte homeostasis, renal and vascular function, and myocardial remodeling [19]. This ACE inhibition by the juices could be due to their phenolic content as flavonoids; a class of polyphenols that has been shown to inhibit ACE activity [20]. However, the discrepancy observed in the flavonoid content and enzyme inhibitory activity could be due to the variation in the flavonoids responsible for the activity of both juices.
Both juices caused a reduction in plasma triglyceride levels in a dose-dependent manner, and this could have been due to the ability of the citrus flavonoids to inhibit hepatic apolipoprotein (apo)B secretion [21]. This causes a defect of translocation of apoB100 into the lumen of the endoplasmic reticulum, increasing the amount of apoB100 degraded within the hepatic cells [22]. This triglyceride-reducing effect is important because an elevated plasma triglyceride concentration has long been linked to the prevalence of small, dense LDL particles that are known to promote atherosclerosis and other CVDs [23]. The citrus juices also caused a reduction in cholesterol levels in the rats fed a high-cholesterol diet, and other researchers have also observed the cholesterol-reducing ability of citrus juices and naringin, a major flavonone found in citrus juices [24]. The suggested mechanism is that the citrus fruit juices possess the ability to increase the bile flow and concentration of biliary bile cholesterol and biliary bile acids, thereby enhancing excretion of the excess cholesterol present in the hypercholesterolemic rats [25]. In patients diagnosed with coronary heart disease, lower levels of the large HDL particles and higher levels of the small and dense LDL particles have been observed in comparison with patients without coronary heart disease [26]. Also, the major lipid abnormality present in patients with known coronary heart disease is a low level of plasma HDL cholesterol [27]. Both citrus fruit juices increased plasma HDL levels and reduced LDL levels, which could explain the observed differences in their hypocholesterolemic activity, as well as their artherogenic indices. The mechanism proposed for this is that the flavonoids in the citrus juice act as cellular signaling molecules regulating the signal transduction pathways of the sterol regulatory element binding proteins [28]. The sterol regulatory element binding proteins activated by the flavonoids then activate the LDL receptor gene that increases the cellular levels of the LDL receptor [29]. The net effect of this is to reduce LDL levels in circulation and raise HDL levels. The effect of the citrus juices on weight gain as shown in Table 2 agrees with previous studies by Kurowska et al., [17] where orange juice were shown to elevate plasma HDL levels and reduce LDL levels and reduce weight gain.
In conclusion, the inhibition of a key enzyme linked with hypertension (ACE), together with the hypocholesterolemic effect of the juices observed on their administration to rats fed a high-cholesterol diet could be part of the mechanism by which the juices manage and/or prevent CVDs.
REFERENCES
- 1.World Health Organization. Global status report on noncommunicable diseases 2010. Geneva: WHO; 2011. [Google Scholar]
- 2.World Health Organization. Global atlas on cardiovascular disease prevention and control. Geneva: WHO; 2011. [Google Scholar]
- 3. Mathers CD, Loncar D. Projections of global mortality and burden of disease from 2002 to 2030. PLoS Med. 2006;3:e442. doi: 10.1371/journal.pmed.0030442. [DOI] [PMC free article] [PubMed] [Google Scholar]
- 4. De Backer G, Ambrosioni E, Borch-Johnsen K. European guidelines on cardiovascular disease prevention in clinical practice. Third Joint Task Force of European and Other Societies on Cardiovascular Disease Prevention in Clinical Practice. Eur Heart J. 2003;24:1601–10. doi: 10.1016/s0195-668x(03)00347-6. [DOI] [PubMed] [Google Scholar]
- 5. Austin MA, Carolyn MH, Zimmern RL, et al. Familial hypercholesterolemia and coronary heart disease: a HuGE association review. Am J Epidemiol. 2004;160:421–9. doi: 10.1093/aje/kwh237. [DOI] [PubMed] [Google Scholar]
- 6. Lim SS, Vos T, Flaxman AD, et al. A comparative risk assessment of burden of disease and injury attributable to 67 risk factors and risk factor clusters in 21 regions, 1990–2010: a systematic analysis for the Global Burden of Disease Study 2010. Lancet. 2012;380:2224–60. doi: 10.1016/S0140-6736(12)61766-8. [DOI] [PMC free article] [PubMed] [Google Scholar]
- 7. Mabberley DJ. A classification for edible Citrus (Rutaceae) Telopea. 1997;7:167–72. [Google Scholar]
- 8.Harborne JB. The flavonoids: advances in research since 1986. New York: Chapman & Hall; 1994. [Google Scholar]
- 9.Horowitz RM, Gentili B. Flavonoid constituents of citrus. In: Nagy S, Shaw PE, Veldhuis MK, editors. Citrus science and technology. Westport (CT): Avi Publishing; 1977. pp. 397–426. [Google Scholar]
- 10. Acharya KR, Sturrock ED, Riordan JF, et al. ACE revisited: a new target for structure-based drug design. Nature Rev Drug Discov. 2003;2:891–902. doi: 10.1038/nrd1227. [DOI] [PMC free article] [PubMed] [Google Scholar]
- 11. Singleton VL, Orthofor R, Lamuela-Raventos RM. Analysis of total phenols and other oxidation substrates and antioxidants by means of Folin–Ciocalteau reagent. Methods Enzymol. 1999;299:152–78. [Google Scholar]
- 12. Meda A, Lamien CE, Romito M, et al. Determination of the total phenolic, flavonoid and proline contents in Burkina Faso honey, as well as their radical scavenging activity. Food Chem. 2005;91:571–7. [Google Scholar]
- 13. Cushman DW, Cheung HS. Spectrophotometric assay and properties of the angiotensin I-converting enzyme of rabbit lung. Biochem Pharmacol. 1971;20:1637–48. doi: 10.1016/0006-2952(71)90292-9. [DOI] [PubMed] [Google Scholar]
- 14.Tietz NW. Fundamentals of clinical chemistry. Philadelphia: W.B. Saunders; 1982. pp. 562–698. [Google Scholar]
- 15. Lopes-Virella MF, Stone P, Ellis S, et al. Cholesterol determination in high-density lipoproteins separated by three different methods. Clin Chem. 1977;23:882–4. [PubMed] [Google Scholar]
- 16. Friedewald WT, Levy RI, Fredrickson DS. Estimation of the concentration of low-density lipoprotein cholesterol in plasma, without use of the preparative ultracentrifuge. Clin Chem. 1972;18:499–502. [PubMed] [Google Scholar]
- 17. Kurowska EM, Spence JD, Jordan J, Wetmore S, Freeman DJ, Piche LA, Serratore P. HDL-cholesterol-raising effect of orange juice in subjects with hypercholesterolemia. AM J CLin Nutr. 2000;72(50):1095–100. doi: 10.1093/ajcn/72.5.1095. [DOI] [PubMed] [Google Scholar]
- 18. Sowers JR, Frolich ED. Insulin and insulin resistance: impact on blood pressure and cardiovascular disease. Med Clin North Am. 2004;88:63–82. doi: 10.1016/s0025-7125(03)00128-7. [DOI] [PubMed] [Google Scholar]
- 19. Turner AJ, Hooper NM. The angiotensin-converting enzyme gene family: genomics and pharmacology. Trends Pharmacol Sci. 2002;23:177–83. doi: 10.1016/s0165-6147(00)01994-5. [DOI] [PubMed] [Google Scholar]
- 20. Montenegro MF, Pessa LR, Tanus-Santos JE. Isoflavone genistein inhibits the angiotensin-converting enzyme and alters the vascular responses to angiotensin I and bradykinin. Eur J Pharmacol. 2009;607:173–7. doi: 10.1016/j.ejphar.2009.02.015. [DOI] [PubMed] [Google Scholar]
- 21. Lin Y, Vermeer MA, Bos W, et al. Molecular structures of citrus flavonoids determine their effects on lipid metabolism in HepG2 cells by primarily suppressing ApoB secretion. J Agric Food Chem. 2011;59:4496–503. doi: 10.1021/jf1044475. [DOI] [PubMed] [Google Scholar]
- 22. Mohammadi A, Macri J, Newton R, et al. Effect of atorvastatin on the intracellular stability and secretion of apolipoprotein B in HepG2 cells. Arterioscler Thromb Vasc Biol. 1998;18:783–93. doi: 10.1161/01.atv.18.5.783. [DOI] [PubMed] [Google Scholar]
- 23. Havel RJ. Triglyceride-rich lipoproteins and atherosclerosis: new perspectives. Am J Clin Nutr. 1994;59:795–9. doi: 10.1093/ajcn/59.4.795. [DOI] [PubMed] [Google Scholar]
- 24. Gorinstein S, Leontowicz H, Leontowicz M, et al. Changes in plasma lipid and antioxidant activity in rats as a result of naringin and red grapefruit supplementation. J Agric Food Chem. 2005;53:3223–8. doi: 10.1021/jf058014h. [DOI] [PubMed] [Google Scholar]
- 25. Schaefer EJ, McNamara JR, Tayler T, et al. Effects of atorvastatin on fasting and postprandial lipoprotein subclasses in coronary heart disease patients versus control subjects. Am J Cardiol. 2002;90:689–96. doi: 10.1016/s0002-9149(02)02591-2. [DOI] [PubMed] [Google Scholar]
- 26. Genest JJ, McNamara JR, Salem DN, et al. Prevalence of risk factors in men with premature coronary heart disease. Am J Cardiol. 1991;67:1185–9. doi: 10.1016/0002-9149(91)90924-a. [DOI] [PubMed] [Google Scholar]
- 27. Amemiya-Kudo M, Shimano H, Hasty AH, et al. Transcriptional activities of nuclear SREBP-1a, -1c, and -2 to different target promoters of lipogenic and cholesterogenic genes. J Lipid Res. 2002;43:1220–35. [PubMed] [Google Scholar]
- 28. Borradaile NM, de Dreu LE, Barrett PHR, et al. Hepatocyte apoB-containing lipoprotein secretion is decreased by the grapefruit flavonoid, naringenin, via inhibition of MTP-mediated microsomal triglyceride accumulation. Biochemistry. 2003;42:1283–91. doi: 10.1021/bi026731o. [DOI] [PubMed] [Google Scholar]
- 29. Morin B, Nichols LA, Zalasky KM, et al. The citrus flavonoids hesperetin and nobiletin differentially regulate low density lipoprotein receptor gene transcription in HepG2 liver cells. J Nutr. 2008;138:1274–81. doi: 10.1093/jn/138.7.1274. [DOI] [PMC free article] [PubMed] [Google Scholar]


