

Abstract
Schools can approach the task of sorting students to privileged learning opportunities in different ways, potentially creating distinct and durable educational inequality regimes. We test this idea by exploring variation in socioeconomic inequalities in advanced mathematics course-taking across California middle schools during a statewide algebra-for-all initiative. This case provides unique insight into local stratification processes since the state pressured schools to boost advanced course enrollments but provided little guidance about how to do so. We distinguish two critical organizational processes: the provision of different types of opportunities and the allocation of students to opportunities. The former, we argue, creates the potential for inequality; the latter determines what level of inequality is realized. Using panel data for all public middle schools in the state over a decade, we demonstrate a curvilinear association between opportunities and inequality, with disparities highest when opportunities are most differentiated. However, allocations at most schools were less unequal than would be expected under a test-based meritocratic allocation regime. Further, we find substantial school-level variation which is systematically related to organizational characteristics and consistent over time. These patterns provide evidence for local educational inequality regimes.
Sociological debates about the relation between schooling and inequality tend to treat education as a single social institution, rather than a field of semi-autonomous organizations (Fligstein and McAdam 2012). Some view education as an institution that primarily reproduces social inequality, while others argue that schools equalize opportunities relative to disparities experienced prior to and outside of school (Raudenbush and Eschmann 2015). But schools vary considerably. Educators implement routine educational practices that create and reify categorical distinctions in specific local settings (Domina, Penner, and Penner 2017). For example, high school administrators and teachers regularly make decisions about whether to make advanced course offerings available to students, how many seats to make available in these advanced courses, and which students to place in these advanced courses and which to place in regular courses (Kelly and Price 2011; Oakes 1985, 1994). As these sorting processes respond to local conditions, political contestation, student and family preferences, and educators’ judgments, the relationship between education and inequality likely varies across schools.
In this paper, we adapt the notion of inequality regimes, developed in the literature on workplace inequality, to make sense of variation in opportunity inequality across schools. Inequality regimes represent the “loosely interrelated practices, processes, actions, and meanings” that develop within firms and influence the shape and magnitude of inequalities that firms produce (Acker 2006:443). Organizations develop these practices in response to both contextual conditions and internal negotiations (Tomaskovic-Devey and Avent-Holt 2019). We argue that two sets of organizational practices are key components of educational inequality regimes: (1) practices that determine how many desirable educational opportunities schools provide, such as school-level decisions about how many accelerated, regular, and remedial or developmental course sections to offer in a given grade level; and (2) “gatekeeping” practices such as setting grade or test score thresholds for course placements that determine how students are allocated among the available opportunities (Garet and DeLany 1988; Sørensen 1989). The former creates the potential for inequitable opportunities while the latter determines how much inequality is realized. We hypothesize that educational inequality regimes create distinct patterns of potential and realized inequality across schools that are systematically related to organizational conditions and that are durable over time, even in the face of external institutional pressure.
To explore the contours of educational inequality regimes, we consider the empirical case of the socioeconomic gaps in access to advanced middle school mathematics opportunities (algebra or above) during a period in which state and other field-level actors pressured schools to provide more advanced opportunities.1 The California “algebra-for-all” effort reflected a broad set of policy pressures, including public statements and state accountability policy, rather than an explicit mandate. Schools received little direction from the state about how to allocate expanded educational opportunities (Rosin, Barondess, and Leichty 2009). While the proportion of California 8th graders enrolled in algebra nearly doubled during this period, schools responded to pressures to increase algebra enrollments in diverse ways (Domina et al. 2016). By tracing the links between school-level shifts in the provision and allocation of algebra opportunities, our analyses synthesize insights from micro-level studies of school tracking and its consequences and macro-level theories of maintained inequality to advance a meso-level theory of educational inequality.
Using a decade of panel data for all public middle schools in the state, we explore aggregate trends and organizational variation in algebra inequalities throughout expansion. Consistent with previous research, we find a curvilinear association between opportunities and inequality, with disparities peaking when the provision of the opportunities is most differentiated. However, we find that most allocations are less unequal than we would expect if schools used a purely test-based meritocratic allocation logic. Importantly, though, aggregate trends belie distinct and durable educational inequality regimes: there is substantial variation between schools that is systematically related to organizational characteristics and consistent over time. Organizational influences on inequality are not monolithic; some local regimes consistently reproduce opportunity inequalities, while others work against pre-existing disparities.
Educational Inequality Regimes and Algebra-for-All
The concept of an organizational inequality regime draws attention to local institutional arrangements that create, maintain, and potentially subvert social inequality (Acker 2006; Tomaskovic-Devey and Avent-Holt 2019). Since these arrangements develop within organizations in response to local conditions and challenges; key characteristics of inequality regimes vary systematically with organizational size, demographics, resources, and cultural context (Huffman, Cohen, and Pearlman 2010; Smith-Doerr et al. 2019; Tomaskovic-Devey, Hällsten, and Avent-Holt 2015). Because the organizational practices that define inequality regimes must be internally workable, they emerge out of local negotiations and power struggles among organizational state-holders (Vallas and Hill 2012). As such, even similarly situated inequality regimes likely vary in important regards. And since organizational arrangements are often path dependent, inequality regimes tend to be relatively stable over time.
Most work on inequality regimes focuses on the unequal distribution of power, status, and resources within firms and other workplaces (e.g., Cohen and Huffman 2007; Kellogg 2011; Tomaskovic-Devey et al. 2015). In these cases, inequality regimes create and maintain inequalities among workers. While workplace inequalities exist in schools as well, our focus in this paper is on the inequalities that schools create and maintain as they distribute learning opportunities among students. Schools routinely sort students into discrete instructional groups and then differentiate curriculum and instruction across those groups (e.g., Gamoran 1987; Lucas 1999; Oakes 1985; Sørensen 1970; Tyson 2011). This creates greater variation in learning opportunities within U.S. schools than between them (Schmidt et al. 2015). Many believe grouping practices help educators to meet students’ diverse pedagogical needs (Hallinan 1994), but they tend to reinforce inequality by giving students from advantaged groups privileged access to desirable educational opportunities (Oakes 1985, 1994). Tracking is thus deeply implicated in the reproduction of educational inequality, and track placements have important consequences for the instruction to which students are exposed (Carbonaro 2005; Oakes 1985) and their subsequent educational and career trajectories (Carroll et al. 2017; Long, Conger, and Iatarola 2012). Importantly, however, tracking systems – and their consequences for educational inequality – vary across schools along multiple dimensions (Domina et al. 2019; Kelly and Price 2011; Sørensen 1989).
Educational organizations confront two crucial sets of decisions as they construct school tracking systems: (1) provision decisions, including determinations about how many different learning environments to create and how many spots to make available in the desirable high-status learning environments that typically convey advantage, and (2) allocation decisions, including choices about the criteria, measurements, and processes they use to place students into higher- or lower-status environments. These two sets of decisions play distinct yet interrelated roles in the creation of unequal opportunities. Provision decisions shape the potential for unequal access within the school; allocation decisions determine the extent to which potential inequalities are realized.
Of course, schools do not make these decisions in a vacuum. As we discuss in more detail below, many social processes shape provision and allocation decisions, including: family and community socioeconomic resources that support out-of-school learning and shape students’ academic preparation; public resources that determine what specific instructional resources are available; broader policy and normative pressures that shape viable educational options; and interactions between parents and educators that shape how these decisions are ultimately implemented. While each of these social processes play out in every school context, the ways they constrain educational decision-making likely varies considerably from school to school. Since organizations serve distinct constituencies with different sets of resources and constraints, cross-organizational differences in local conditions and logics of action may lead to distinct and durable local experiences of educational inequality.
The distinction between potential and realized inequality is especially salient in the context of expansionary efforts like California’s algebra-for-all effort, in which schools faced pressure to increase the number of opportunities with little guidance about how to distribute them. These policy pressures directly promoted changes in the provision of resources, with implications for potential inequality. It also forced schools to make new allocations for a growing number of advanced opportunities. Differences in local responses to pressures in the institutional environment – which are especially likely to emerge in a relatively loosely-coupled field like educational policy – can reveal contours of organizational inequality regimes (e.g., Kellogg 2011; Tomaskovic-Devey and Avent-Holt 2019). To make sense of how these processes may have evolved, and their implications for socioeconomic inequality, we now turn to the literatures on school tracking and maintained inequalities. While largely discrete, these research traditions provide complementary insights that we integrate into a framework for understanding potential and realized inequality in access to advanced opportunities amid expansion.
Organizational Variation in School Tracking Systems
Decisions about what types of learning opportunities to offer and decisions about how to distribute privileged opportunities are highly contested (Oakes et al. 1997). In this uncertain space, school practices emerge out of “messy human decision-making” processes (Oakes 1994), yielding important cross-school differences in the structure of school tracking systems (Domina et al. 2019; Garet and DeLany 1988; Kelly and Price 2011; Lucas and Berends 2007). As reflected in the pronounced variation in 8th grade Algebra enrollment rates in California middle schools (see Table 1), some schools opt for systems that provide many students with access to high-status learning opportunities while others sharply limit access to high-status classes (Domina et al. 2016; Oakes and Guiton 1995; Rickles 2011). Similarly, schools vary in the criteria that they use to allocate students across differentiated classrooms, with some schools placing students exclusively based on test scores and others providing avenues for teachers, parents, or students to influence course placements (Lewis and Diamond 2015; Lucas 1999; Oakes 1985).
Table 1.
Summary of the Analytic Sample of 8th Grade Cohorts, 2003-2013 (10,800 observations in 1,080 schools and 436 districts)
| Percentile |
Proportion of Variance |
|||||||
|---|---|---|---|---|---|---|---|---|
| Mean | SD | 25th | 50th | 75th | Between-District | Between-School | Within-School | |
| Enrollment | 301.0 | 163.0 | 169 | 298 | 407 | 0.501 | 0.434 | 0.065 |
| % Poor | 49.1 | 25.2 | 28.4 | 49.0 | 70.2 | 0.473 | 0.404 | 0.123 |
| % Asian | 12.1 | 15.3 | 2.5 | 6.3 | 14.5 | 0.551 | 0.413 | 0.037 |
| % Black | 6.6 | 8.8 | 1.4 | 3.4 | 8.3 | 0.481 | 0.448 | 0.071 |
| % Hispanic | 43.2 | 25.7 | 21.1 | 39.1 | 62.9 | 0.629 | 0.327 | 0.045 |
| % White | 35.0 | 25.3 | 11.5 | 31.5 | 56.3 | 0.738 | 0.212 | 0.050 |
| % General Mathematics | 39.6 | 26.7 | 14.5 | 42.5 | 62.2 | 0.345 | 0.149 | 0.506 |
| % Algebra or Higher | 53.2 | 26.1 | 31.5 | 49.5 | 75.9 | 0.364 | 0.145 | 0.491 |
| Prior Math. Ach. (standardized) | 0.043 | 0.762 | −0.457 | −0.015 | 0.492 | 0.320 | 0.493 | 0.187 |
| Nonpoor-poor Prior Ach. Gap | 0.777 | 0.756 | 0.344 | 0.649 | 1.083 | 0.292 | 0.277 | 0.432 |
SD = Standard Deviation
Technical/functional predictors
Since educators typically justify tracking based on the belief that differentiation facilitates teaching and learning (Hallinan 1994; Oakes 1994; Oakes et al. 1997), it is not surprising that technical/functional conditions related to instruction influence the distribution of learning opportunities. Organizational resources for instruction, such as the availability of staff qualified to teach advanced material, are particularly relevant for the provision of opportunities. And consistent with technical/functional explanations of differentiation, students’ prior academic preparation strongly predicts course placements (Dauber, Alexander, and Entwisle 1996; Gamoran 1987; Long et al. 2012). The aggregate prior achievement of the student body is thus an important contextual influence on tracking. Schools enrolling students with higher test scores tend to offer more advanced opportunities (Iatarola, Conger, and Long 2011; Klugman 2013). In addition, schools with greater variation in prior preparation offer more differentiated opportunities. Further, since larger schools are more likely to be attended by a critical mass of students with different instructional experience, they are also be more likely to provide differentiated opportunities (Kelly and Price 2011).
Policy and normative constraints
But the decisions that create tracking systems are not purely technical. Formal state and district policies constrain local decisions about the provision and allocation of educational opportunities. In the current case, California policy-makers implemented a series of policies designed to increase 8th grade Algebra enrollments and reduce racial and socioeconomic inequalities over the study period. This policy push cumulated with a 2010 policy that linked 8th grade Algebra assignments into the measurement of school improvement for accountability purposes (Domina et al. 2016).
Broader institutional and historical trends also create norms that shape local decisions (Arum, Gamoran, and Shavit 2007; Lucas 1999). In some schools, 8th grade Algebra assignments may reflect local norms that conceptualize student achievement as an indicator of fixed student intelligence and position educators as legitimate gatekeepers in an educational process that prioritizes meritocratic promotion. In other cases, educators may conceptualize student readiness more flexibly, prioritize broad access to valued educational opportunities, and/or prefer heterogeneous groupings in learning environments (Rickles 2011; Watanabe 2006).
Student and parent preferences
Furthermore, educators must negotiate with local stakeholders when they implement curricular tracking systems. As Wells and Oakes (1996) document, students who are accustomed to accessing advanced courses often have a strong preference for course placement systems that restrict access to advanced learning environments. These students often hail from families that have the necessary social and economic power to effectively mobilize in order to influence school course assignment practices (Lewis and Diamond 2015). Advantaged student and parent mobilization may explain why schools with more advantaged students often create tracking systems that limit the provision of high-status educational opportunities (Kelly and Price 2011; Kerckhoff, Fogelman, and Manlove 1997; Oakes et al. 1997). Student and parental pressure may also explain why course allocation processes in racially diverse schools often advantage white students, creating relatively large racial gaps in access to high-status courses (Kelly 2009; Lucas and Berends 2007).
Educational Expansion and Persistent Inequalities
School sorting systems are dynamic, and the growth of education as an institution in contemporary societies has driven profound changes (Domina and Saldana 2012; Schofer and Meyer 2005). Advocates view efforts to expand educational opportunity as a lever to promote equity. But sociologists often take a more skeptical view. Sociological research highlights how privileged groups use their social and financial resources to maintain their advantages during periods of expanding opportunity (e.g., Alon 2009; Lareau 2011; Lucas 2001).
One perspective proposes that background advantages persist throughout expansion until the advantaged group is “saturated” in privileged positions, after which further expansion necessarily reduces inequality (Raftery and Hout 1993). Although evidence for this Maximally Maintained Inequality (MMI) prediction is mixed (e.g., Breen et al. 2009), it remains a useful framework for evaluating changing inequalities as opportunities increase. MMI suggests that when an opportunity is rare, access will be exclusive and inequality will flourish; when the opportunity is pervasive, access will broaden and inequality will fall; when the opportunity is universally available there can once again be no inequality (Paterson and Iannelli 2007).
Though often applied to levels of educational attainment, a similar curvilinear association between opportunities and inequality may apply to qualitative distinctions among students in levels of education that are universally available, including advanced course placements (Domina and Saldana 2012; Klugman 2013; Lucas 2001). In the algebra-for-all case, the MMI perspective suggests that inequalities in access to advanced courses will be most pronounced when there are exactly enough seats in 8th grade algebra courses for all advantaged students. Beyond this point, inequalities necessarily decline as the number of seats increases, creating space for less advantaged students in 8th grade algebra classrooms.
Potential and Realized Inequality amid Expanding Opportunities
Research on tracking systems thus describes how processes that drive educational inequality vary across schools, drawing attention to the organizational routines that create within-school inequality and the structural, normative, and political factors that influence those routines. Research in the maintained inequalities tradition, by contrast, highlights the prevalence of background inequalities throughout substantial changes in educational systems. While this tradition rarely explicitly engages with organizational variation, it highlights how local inequalities result from linked decisions about the provision and allocation of opportunities. Together, these perspectives highlight that local educational inequality regimes are shaped both by how new opportunities change the potential for inequality and how organizational allocation processes realize that potential inequality.
To make these provision and allocation decisions concrete, consider a hypothetical queue of students for the seats in a school’s advanced courses, arranged in order of priority for assignment.2 The number of students from the front of this queue placed into advanced opportunities varies with school decisions about how many advanced seats to provide. The order in which students are placed in the queue, meanwhile, varies with school allocation practices.3
Figure 1 portrays the inequality across all levels of Algebra provision resulting from three different allocation systems for a hypothetical school with 40 non-poor and 60 poor students. Panel A represents an allocation system that fully realizes possible socioeconomic inequality by placing advantaged students in front of disadvantaged students in the queue. The resulting inequality in Algebra opportunities represents the potential inequality for each level of provision. Consistent with maintained inequality research (Paterson and Iannelli 2007), this scenario demonstrates that potential inequality is low when opportunities are universal (either none or all in the advanced course) and peaks when the number of seats in the advanced course equals the number of advantaged students.4 Panel B illustrates the results of an allocation system in which students are assigned based on a meritocratic criterion (such as prior achievement scores) on which poor students trail non-poor students by a standard deviation on average. Under this allocation system, advantaged students are better represented at the front of the Algebra queue, which results in meaningful poor-nonpoor gaps for most levels of Algebra provision. In this example, opportunity inequalities are largest when 30-60 percent of students are enrolled in 8th grade Algebra. Panel C, meanwhile, represents the results of an allocation system in which students are sorted into advanced courses at random. In expectation, random selection would lead to no inequality at any level of provision.
Figure 1.
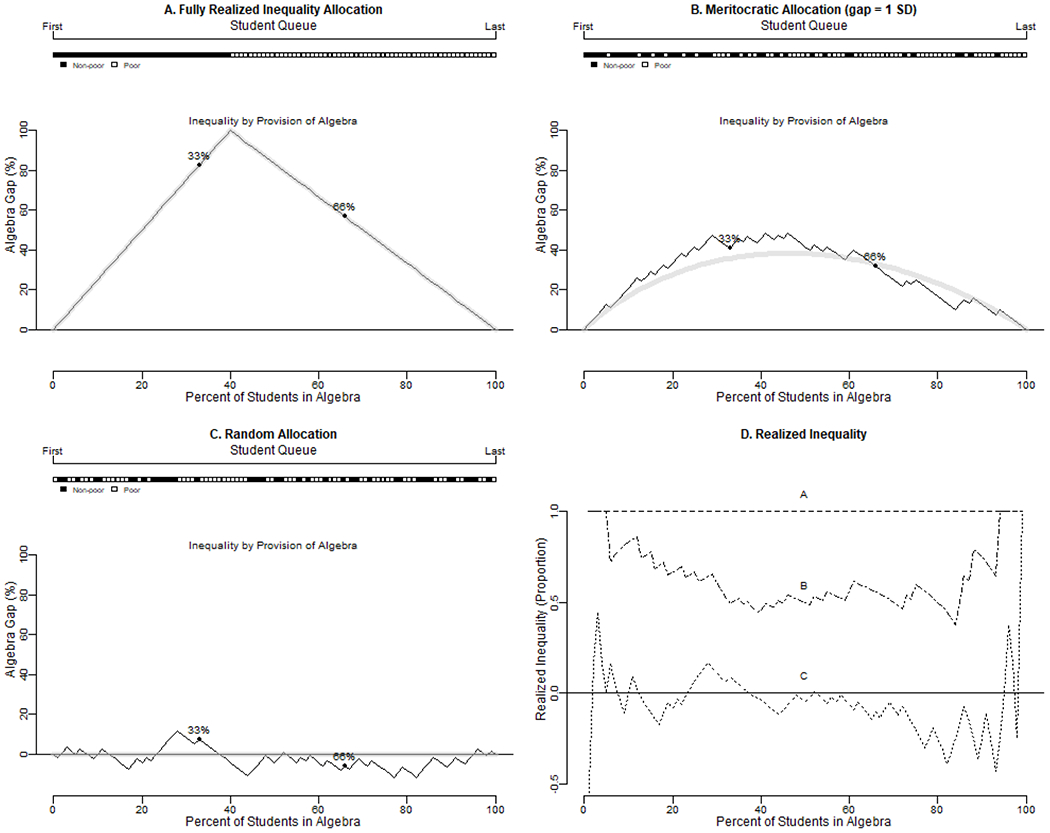
Student Queue for Algebra and Relationship between Opportunities and Inequality for Three Allocation Regimes in a School with 100 Students (40 Nonpoor)
Each square in the queue presented at the top of each panel represents a student; horizontal position (left to right) represents the order they would be placed in Algebra under each allocation regime. Panel A represents the most extreme unequal allocation regime, as all nonpoor students (filled squares) are placed in Algebra before all poor students (non-filled squares).
The black lines plotted in each panel represent the Algebra enrollment gap (on y-axis) for each potential level of Algebra opportunities (on x-axis) that is implied by each allocation regime.
The gray lines (in Panels A-C) represent expected inequalities.
Values for 33% and 66% enrollment are highlighted with points. For instance, in the allocation regime represented by Panel A, when 33 students are enrolled in Algebra, 82.5% (33/40) of nonpoor students are enrolled in Algebra, while no poor students are enrolled. The gap is 82.5%. Point B highlights the value of the disparity for 66% enrollment. In Panel A, this value is 56.7% (40/40 – 26/60).
In summary, organizational decisions about the provision of algebra opportunities are represented by different possible points along the x-axis in Figure 1. These provision decisions determine potential inequality, the upper limit for unequal opportunities shown by the function in Figure 1A. Organizational decisions about how to allocate students are represented by the different possible levels of inequality (along the y-axis) at any particular level of provision. These lead to different levels of realized inequality for the hypothetical allocation regimes in Panels A-C. Realized inequality is intuitively the share of potential inequality (for a given level of provision) that is observed, as represented by the plots in Panel D.5
As the stylized examples in Figure 1 illustrate, local provision and allocation decisions each shape inequalities in access to advanced opportunities. But it can be difficult to disentangle provision and allocation processes in practice. Math course assignments during algebra-for-all in California is a useful case study in this regard, because schools faced external pressure to change their provision processes but relatively little guidance about how to approach allocation. Increases in provisions were widespread, meaning that these changes were not limited to a selective set of schools. These changes also occurred quickly, meaning that essentially the same local actors – operating in the same social contexts with similar student populations – made allocations for different levels of provisions year to year. Algebra inequalities during this period therefore can illuminate both aggregate trends amid expansion and organizational variation indicative of local inequality regimes.
Our analyses investigate the following hypotheses about local socioeconomic inequalities amid algebra-for-all, based on research on organizational inequality regimes, school tracking systems, and maintained inequality:
Hypothesis 1:
We expect that inequality throughout the algebra-for-all period follows differences in potential inequality for different levels of the provision of algebra (see Figure 1A). This implies an inverted u-shaped association in which inequalities increase with initial opportunities, are highest for moderate opportunities, and decrease as opportunities become universal. Similarly, we expect that this relationship reflects stages of inequality throughout expansion (Paterson and Iannelli 2007), which we expect to see both in aggregate trends (as the overall provision of advanced opportunities increases) and in the individual trajectories of schools (when the local number of advanced opportunities increases).
Hypothesis 2:
We expect that realized inequalities in 8th grade Algebra assignments tend to be approximately as large as predicted by a meritocratic allocation based on prior test scores (Figure 1B). Test scores are commonly used to allocate students, consistent with both strong meritocratic norms in education and technical/functional motivations for instructional grouping (Hallinan 1994). But schools use test scores in different ways, and these differences can have important consequences for the distribution of opportunities in schools. To the extent that advantaged families secure higher test scores for privileged educational opportunities (e.g., Alon 2009), test score differences may account for socioeconomic inequalities in placement. However, many reproductionist accounts of schooling suggest that advantaged families also actively intervene for more favorable educational opportunities, implying larger than meritocratic inequalities (e.g., Lucas 2001). Conversely, equalizing influences, such as educators’ orientations to equity, could lead to less than meritocratic inequality. So while we expect schools to vary in the degree of realized inequality (see below), we expect that variation to center around the meritocratic prediction.
The educational inequality regimes perspective suggests that schools exhibit distinct and durable local patterns of inequality. In particular, this perspective implies the following:
Hypothesis 3:
Schools vary considerably in the magnitude of socioeconomic Algebra disparities. We expect such differences to be apparent both in potential inequality, reflecting local responses to the algebra-for-all initiative, and realized inequality, which is not directly implicated by the policy.
Hypothesis 4:
In addition to overall variation, educational inequality regimes imply that organizational conditions predict local disparities. Based on tracking research, we expect that these decisions vary with students’ prior preparation, instructional resources, and sociodemographic composition. In addition, we hypothesize potential inequality, based on provisions, is uniquely affected by instructional resources (capacity for differentiation), while realized inequality is not.
Hypothesis 5:
We expect organizational differences in opportunity disparities to be durable over time. Expansion provides a particularly strong test of this hypothesis, as schools face pressure to change their practices. Nonetheless, because we expect a degree of consistency and path dependence in school norms and processes, we hypothesize that a meaningful share of variation in local inequalities is between schools (as opposed to within-schools over time). We especially expect consistency in the level of realized inequality at schools over time, since allocation decisions were not directly targeted by the algebra-for-all initiative.
Methods
Data
Our analyses draw upon publicly available administrative data from all public schools serving 8th grade students in California from 2002-2003 to 2012-2013. This period encompasses most of California’s “algebra-for-all” era, beginning the year before the state implemented accountability incentives that penalized schools for enrolling 8th graders in pre-algebra or other less advanced math courses and ending the year after the state released schools from these accountability incentives. We assemble key data from the California Standardized Testing and Reporting program records, which are collected as part of mandatory standardized testing and reveal the number of students at each school who sat for different mathematics tests, disaggregated by student demographic characteristics. We augment these primary data with school information on student enrollment and demographic compositions from the Common Core of Data information collected by the National Center for Education Statistics.
The population of interest for our questions is the set of schools serving a sufficiently large group of 8th graders to potentially enroll students in different mathematics courses. We thus consider only schools that enroll an average of at least 50 students annually across the study period (approximately half of all schools ever enrolling an 8th grader during this period), which account for 96% of all enrolled students. From this total sample pool, we restrict our analytic sample to schools that were in operation and enrolled poor and nonpoor students in each year of the panel from the analytic sample,6 and we exclude 47 schools that lack reliable 7th grade achievement measures of prior achievement.7 The resulting analytic sample for poor-nonpoor gaps is a balanced panel of 1080 schools, representing 82% of the total sample pool. Characteristics of the main analytic sample are presented in Table 1 (Supplemental Table S1 documents how these schools compare to omitted schools).
Measures
The central construct for all research questions is the prevalence of advanced-mathematics course-taking within a school in each year, which we operationalize as the proportion of 8th graders who sat for California Standard Tests (CST) in Algebra or a more advanced course. During the study period, students were required by the California Department of Education to take a CST test in grade 8 that reflected the content of their mathematics instruction during the year. Therefore, test type is a standardized indicator of the level of the course each student took during the year and test level data is reported for 97% of enrolled 8th grade students.
We calculate school-level 8th grade Algebra enrollment as the proportion of 8th grade students in Algebra I, Geometry, or Algebra II courses.8 We calculate socioeconomic disparities in Algebra enrollment as the difference in probability of Algebra enrollment for nonpoor versus poor students.9 Poor students are identified by eligibility for the subsidized lunch program, reflecting family income less than 185% of the federal poverty line.10 In supplemental analyses, we consider Hispanic-White and Black-White gaps within the subset of schools for which both groups are represented. Reflecting the high degree of racial segregation in California schools, there are fewer schools with sufficient racial diversity to support these analyses. These supplemental analyses of school racial inequality return substantively similar results, which increases our confidence that the findings are robust to multiple conceptualizations of social background inequality.
Finally, we collect yearly measures of school characteristics from publicly available administrative records. We measure school size—enrollment of 8th grade students—as a proxy for the availability of instructional resources to provide more differentiated instruction. Since students’ prior mathematics preparation is a key determinant for both the provision and allocation of advanced opportunities, we include two separate indicators: average 7th grade achievement and the achievement gap between poor and non-poor students (in standardized units).11 Finally, we include two measures of student demographic composition, the percentage of the student body that are not eligible for free or reduced price lunch and the proportion of students in different racial/ethnic groups.
Hypothetical Allocations
To assess the magnitude of course-taking disparities, we compare observed values to predicted disparities under the hypothetical allocation regimes represented in Figure 1. First, we calculate potential inequality or fully realized inequality12 as the largest enrollment gap that would be possible, given the proportion of nonpoor students (Pr(NP)) and the proportion of overall spaces in Algebra enrollments (Pr(Alg)):
| (1) |
This definition reflects the two phases of potential inequality represented in Figure 1A (Hypothesis 1), each of which is represented by a linear function of Algebra opportunities. The first reflects how potential inequality increases with opportunities when there are fewer Algebra seats than nonpoor students; the second reflects how inequalities decrease with opportunities after all nonpoor students are already enrolled.
Second, to facilitate our test of Hypothesis 2, we calculate meritocratic inequality as the gap that would result if allocations were based solely on prior standardized achievement scores. If we observed individuals’ scores directly, we could order students by these scores and determine the expected meritocratic gap based on the students at the front of the queue (above the threshold defined by observed Algebra provision). Instead, we approximate this procedure with aggregate data on the size of poor and nonpoor groups and the mean prior achievement difference between them. We assume that scores are normally distributed within each group with equal variance, and we calculate the share of each group above the provision threshold. To gauge the accuracy of this approximation, we compare the aggregate calculation with the correct value derived from individual-level data in one district. Across different possible provisions of Algebra for each school, the aggregate approximation correlates highly with the individual-based values (0.72), but it tends to understate the true size of meritocratic inequalities, with an average error of −1.1 percentage points (SD = 4.0), 11% the size of the true meritocratic gaps. Because our measure of the meritocratic benchmark is too low, our results may therefore overstate the relative magnitude of nonpoor students’ advantages overall.13
Models
We assess organizational variation in inequality (Hypothesis 3) by describing the distribution of cases in the data. To assess the remaining educational inequality regime hypotheses, we model school-year Algebra course-taking disparities in a three-level multi-level model with observations nested within schools and districts:
| (2) |
Here is a measure of the gap in advanced course-taking between nonpoor and poor students (potential or realized, depending on model) for school s in district d at time t, is a vector of time-specific school characteristics, is a set of year indicator variables, is a randomly varying district intercept, is a randomly varying school intercept, and is a residual error term.
In this model, non-zero elements of indicate that characteristics predict local inequality (Hypothesis 4). Non-zero variation of school- and district-level random parameters ( and ) reflects persistent organizational variation over time (Hypothesis 5). We interpret the size of variance components in terms of intra-class correlations, which represent the proportion of total variability in the data (including changes over time within schools) associated with persistent organizational differences.
Possible Endogeneity of Allocations and Provisions
Our primary analyses consider allocation and provision outcomes separately. While these decisions are conceptually distinct, they may be linked in practice. For example, schools more predisposed to unequal allocations (e.g., those serving more advantaged populations) may tend to make provision decisions that create a high potential for inequality. This possible correlation could lead our models to overstate realized inequalities in the middle range of algebra provisions. To address such possibilities, we estimate supplemental school fixed effect models that control for (time-invariant) unobserved school characteristics, such as an underlying predisposition for inequality. The results of all fixed effects models are consistent with the primary specifications, suggesting that endogenous provisions are not a serious concern in the current context. This may be because external expansionary pressure during algebra-for-all created variation in provisions independent of allocation intentions. As a result, we do not know if endogenous provisions are problematic in other settings.14
Results
The Relationship between Opportunities and Inequality
We begin by describing the relationship between the provision of advanced opportunities and socioeconomic disparities in access to them. Pooling across all years (Figure 2A), we see the expected curvilinear association between opportunities and inequalities, with the largest gaps when there are opportunities for just over half of the cohort. This association was consistent over time (Figure 2B) even as schools increased their provision of algebra, from 37.5% on average in 2003 to 67.9% in 2013 (Table 2). Thus, large shifts in the number of opportunities did not change typical inequality at each level of provision.15 This relationship implies that local decisions about how many Algebra opportunities to provide fundamentally influence changes in local inequalities during expansion by determining the potential for inequality.
Figure 2.

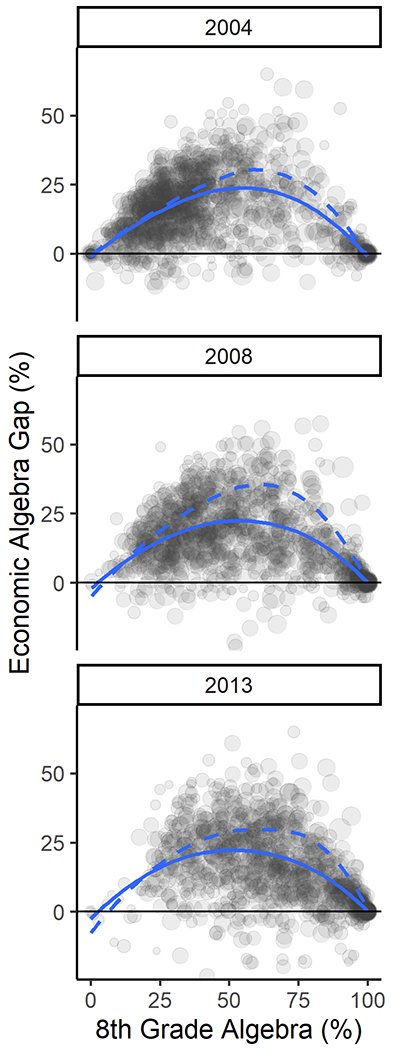
Local Poor-nonpoor Disparities in Algebra Enrollment by Provision
A. The overall association between the number of opportunities and disparities is curvilinear. Conditional mean values (solid line) are lower than expected if allocations were meritocratic (dashed line).
B. The association between opportunities and inequality was consistent over time, even as schools tended to increase algebra opportunities.
Notes: Each circle represents one school-year observation, with size scaled to 8th grade student enrollment. Solid blue line shows a Loess fit line. Dashed blue line shows the Loess fit line for hypothetical inequalities based on meritocratic allocation (individual points not shown). The corresponding animated version shows individual school changes over time and yearly detail.
Table 2.
Trends in School Opportunities, Inequality, and Potential Inequality among California Middle Schools
| % Algebra |
% >95% Algebra | Poor-nonpoor Gap (percentage points) |
Potential Inequality (percentage points) |
||||
|---|---|---|---|---|---|---|---|
| Year | Mean | SD | Mean | SD | Mean | SD | |
| 2003 | 37.5 | 24.6 | 5.3 | 15.3 | 12.8 | 48.0 | 25.6 |
| 2004 | 43.8 | 26.5 | 8.2 | 15.7 | 12.7 | 48.9 | 26.5 |
| 2005 | 48.4 | 27.9 | 12.0 | 16.0 | 13.3 | 51.4 | 29.1 |
| 2006 | 52.6 | 28.1 | 14.6 | 15.8 | 13.2 | 51.7 | 30.0 |
| 2007 | 56.1 | 27.8 | 15.6 | 15.5 | 13.9 | 51.5 | 30.2 |
| 2008 | 58.6 | 27.4 | 17.8 | 15.1 | 13.5 | 51.7 | 31.1 |
| 2009 | 62.4 | 26.3 | 19.7 | 15.4 | 13.6 | 51.8 | 32.7 |
| 2010 | 66.5 | 25.3 | 23.0 | 14.0 | 13.8 | 49.0 | 32.8 |
| 2011 | 67.7 | 24.7 | 22.1 | 13.9 | 13.9 | 48.4 | 33.1 |
| 2012 | 68.5 | 24.5 | 23.1 | 14.0 | 13.8 | 47.3 | 32.8 |
| 2013 | 67.9 | 23.9 | 20.6 | 14.1 | 14.5 | 48.3 | 32.0 |
SD = Standard Deviation
Note: Summary statistics for the 1,080 schools that meet analytic sample criteria, as described in text. Potential inequality is calculated for each school-year observation based on the proportion of the population in Algebra and the share of nonpoor students.
The Magnitude of Local Inequalities
To gauge the size of inequalities in the allocation of algebra opportunities, we compare observed inequality for each school-year observation to benchmarks based on the hypothetical allocation regimes of perfect equity, potential inequality, and meritocratic inequality (Table 3).16 These comparisons demonstrate that advantaged students almost always enjoyed greater access to more advanced opportunities in cases where the structure of opportunity allows for inequality. Compared to a regime in which poor and non-poor students have equal chances of placement in Algebra, nonpoor students were overrepresented in Algebra courses by 18 percentage points. While inequalities varied widely across schools, this advantage holds for more than 90% of school-year observations.
Table 3.
Observed Algebra Enrollment Disparities (Nonpoor vs. Poor) Compared to Hypothetical Allocation Regimes
| Observed gap compared to: | Equal(a) | Potential Inequality |
Meritocratic Inequality |
||
|---|---|---|---|---|---|
| Diff(b) | Prop(c) | Diff(b) | Prop(c) | ||
| Mean | 18.1 | −42.4 | 0.320 | −5.7 | 0.772 |
| Standard Deviation | 13.1 | 23.4 | 0.248 | 15.4 | 0.724 |
| Percentiles | |||||
| 10 | 2.3 | −74.4 | 0.046 | −23.8 | 0.141 |
| 25 | 9.0 | −60.3 | 0.173 | −12.1 | 0.491 |
| 50 | 17.7 | −41.0 | 0.307 | −4.1 | 0.762 |
| 75 | 26.7 | −23.3 | 0.468 | 2.1 | 1.093 |
| 90 | 34.7 | −11.9 | 0.632 | 9.2 | 1.807 |
See text and Figure 1 for explanation of hypothetical allocation regimes.
N = 8807. Calculations omit school-year observations with universal mathematics, either no (<5%) or full (>95%) algebra.
Since equal implies a gap of 0, comparing the observed gap to this benchmark is equivalent to the observed value.
Difference between observed and hypothetical value is calculated for each school-year observation as Hypothetical – Observed. The metric is percentage points of enrollment in Algebra. Negative values reflect smaller nonpoor advantages than hypothetical value.
Proportion of the hypothetical value is calculated for each school-year observation as Observed / Hypothetical. Values less than 1 reflect smaller nonpoor advantages than expected. Values were truncated at +/−2.
However, these comparisons also demonstrate that the degree of realized socioeconomic inequality in schools was far less than the maximum possible. Observed disparities were 42 percentage points lower than possible on average and fewer than less 10% of cases were within ten percentage points of potential inequality. In proportional terms, realized inequalities were on average a third the size of potential inequality (interquartile range: .17 to .47). Further, schools typically allocated opportunities in a manner that created smaller disparities than we would expect in hypothetical allocation regime based solely on prior achievement. The mean disparity in Algebra access was 6 percentage points lower, and median inequality was three quarters of meritocratic (0.76). Moreover, this overall distribution of inequalities—much less inequality than possible, and less on average than meritocratic—held throughout the study period (see Figure 2B). The number of schools with less than meritocratic inequality, defined as less than 80% of the meritocratic value, increased from 37% in 2004 to 54% in 2013.17
Organizational Variation in Inequality
Consistent with the educational inequality regime perspective, there was substantial variation between schools in the level of poor-nonpoor algebra disparities. We see this both in the vertical dispersion of raw data points in Figure 2 and population variation in poor-nonpoor gaps (Table 2), where the standard deviation for inequality across schools is almost as large as the mean value in all years (e.g., in 2008, 13.5 percentage points relative to 15.1). In addition, there were substantial differences across the population of schools in both potential (Table 2) and realized (Table 3) inequalities. These variations are consistent with the hypothesis that schools made different decisions about how to provide and allocate algebra resources throughout the study period with distinct consequences for local inequality.
Organizational Predictors of Potential and Realized Inequality
Organizational variation is a necessary but not sufficient indicator of educational inequality regimes. This perspective also implies that organizational characteristics shape local inequalities, with likely differences for potential and realized inequality. We assess this implication by modeling predictors of local inequalities. We do not expect these administrative variables to capture the full complexity of local dynamics, but systematic variation related to these characteristics would be consistent with distinct educational inequality regimes.
With respect to provision decisions, Table 4 includes results of models of potential inequality throughout the algebra-for-all era.18 Assessing potential inequality overall (Model 1b), we find that educational resources generally predict the potential for unequal opportunities. Potential inequality is higher in larger schools, which have greater resources for differentiating coursework (they tend to offer more classes and employ more teachers) and may also enroll a broader range of students. Potential inequality was lower for higher-achieving schools (which were more likely to provide Algebra universally) and higher in schools with larger achievement gaps (which likely face more variability in prior preparation). Both school size and student prior achievement represent constraints on provisions related to instruction. By contrast, there are no consistent patterns among student background composition variables. These findings suggest that schools create more advanced opportunities to accommodate high-performing students. Beyond this, however, we find no evidence to suggest that advantaged parents use their power to create more differentiated opportunities (with greater potential for inequality) in the schools their children attend.
Table 4.
Estimates from Multilevel Models of Potential and Realized Inequality
| Outcome | Potential Inequality |
Realized Inequality |
||||
|---|---|---|---|---|---|---|
| (1a) | (1b) | (2a) | (2b) | (3a) | (3b) | |
|
| ||||||
| Sample | All Cases | All Cases | Non-universal Math | Non-universal Math | Non-universal Math | Non-universal Math |
| Average Prior Achievement (std) | −1.324* (0.491) |
0.136 (0.467) |
0.007 (0.004) |
|||
| Prior Achievement Gap (std) | 3.039* (0.349) |
4.482* (0.321) |
0.035* (0.003) |
|||
| Enrollment (std) | 4.480* (0.550) |
−0.087 (0.473) |
0.007 (0.004) |
|||
| Proportion Nonpoor (std) | −0.886 (0.734) |
−2.053* (0.655) |
0.030* (0.005) |
|||
| Proportion Asian (std) | −0.604 (0.695) |
1.306* (0.578) |
−0.043* (0.004) |
|||
| Proportion Black (std) | 1.008 (0.592) |
1.292* (0.510) |
−0.032* (0.004) |
|||
| Proportion Hispanic (std) | −2.548* (0.953) |
1.215 (0.803) |
−0.055* (0.006) |
|||
| Proportion Other Race (std) | −0.400 (0.395) |
−0.039 (0.353) |
−0.008* (0.003) |
|||
| Constant | 51.796* (0.907) |
52.408* (0.915) |
60.091* (0.647) |
60.620* (0.655) |
0.345* (0.007) |
0.324* (0.005) |
| Variance Components | ||||||
| District | 253.052* (24.380) |
250.491* (24.225) |
108.516* (12.862) |
105.202* (12.857) |
0.012* (0.001) |
0.005* (0.001) |
| School | 136.093* (10.639) |
122.005* (9.914) |
81.964* (7.628) |
80.332* (7.514) |
0.008* (0.001) |
0.004* (0.000) |
| Residual | 565.836* (8.117) |
560.112* (8.049) |
389.000* (6.254) |
379.213* (6.114) |
0.028* (0.000) |
0.027* (0.000) |
| Intra-class Correlations | ||||||
| District | 0.265 | 0.269 | 0.187 | 0.186 | 0.247 | 0.135 |
| School | 0.143 | 0.131 | 0.141 | 0.142 | 0.174 | 0.114 |
| N | 10800 | 10800 | 8807 | 8807 | 8807 | 8807 |
| Schools | 1080 | 1080 | 1064 | 1064 | 1064 | 1064 |
| Districts | 456 | 456 | 452 | 452 | 452 | 452 |
p<.05
Notes: All predictors are standardized to have mean of 0 and standard deviation of 1. Standard errors in parentheses. All models include random intercept components for school and district. The metric for the outcomes in Models 1 and 2 is percentage points (poor-nonpoor difference in Algebra enrollment). In Model 3, realized inequality is operationalized as the ratio of observed to potential inequality (see text for details). This “non-universal math” sample is limited to cases with 5-95% of students in algebra, as potential inequality is near zero when provisions are near 0 or 100%.
Potential inequality reflects both the basic capacity to differentiate instruction at all and decisions about how many advanced opportunities to provide. Model 2b focuses on the latter by considering only cases with differentiated instruction. Prior achievement disparity remains the strongest predictor, confirming the importance of the distribution of students’ prior preparation for the details of provision decisions. However, size and overall achievement are no longer predictive, which suggests these conditions influence whether or not schools differentiate instruction, but not the degree of differentiation among schools that do differentiate.19
Turning to allocation decisions that influence inequality, we model predictors of realized inequality operationalized as the proportion of potential inequality possible for the given level of Algebra provision (Model 3b of Table 4).20 The strongest predictor of realized inequality is pre-existing differences in academic preparation; opportunities are more differentiated when students’ prior achievement is variable. That prior academic preparation is important for course placements, while not surprising, highlights that organizational sorting processes are strongly influenced by disparate prior experiences of the students they serve. In contrast, average prior achievement does not predict realized inequality, nor does school size. Finally, while we do not find that the presence of socioeconomically advantaged students predicts the number of opportunities schools make available, we do find that it predicts socioeconomic inequality in access to these opportunities. Similarly, schools with fewer non-white students tend to allocate advanced opportunities more unequally. These associations are consistent with the prediction that advantaged groups often use their status and resources to hoard educational opportunities.
In sum, organizational predictors of potential and realized algebra inequalities highlight the importance of local conditions for how opportunities are provided and allocated. Variation in potential inequality is especially notable in light of external pressure to expand opportunities during the study period, echoing previous research documenting selective resistance to universalizing policies (Kerckhoff et al. 1997; Oakes et al. 1997). It is also notable that the predictors of potential and realized inequalities are different. Variables related to instructional resources, such as average achievement and school size, are more associated with provision decisions, while socio-demographic composition is more related to allocation decisions. Put differently, these findings suggest that socioeconomically advantaged families are more likely to use their advantages to hoard the available opportunities than they are to advocate for a restricted number of opportunities.
Consistency of Organizational Inequalities
Expansionary environments such as algebra-for-all likely induce changes in school sorting processes, but if these processes reflect durable inequality regimes, we should observe persistent between-school variation over time. Indeed, the variance components reported in Table 4 indicate meaningful variation at the school and district levels both overall (Models 1a, 2a, and 3a) and after controlling for observed characteristics (Models 1b, 2b, and 3b). For potential inequality, 40% of unexplained variation is between units (27% between districts and 13% between schools within districts; see Model 1b), and some of the high district share is due to the initial decision to differentiate at all; districts account for only 19% of variation when considering only school-years in which Algebra placements were not universal (Model 2b). However, measured characteristics explain little of the persistent district- and school-level variability in potential inequality (comparing Model 1a to 1b and 2a to 2b).
There is also significant district- and school-level variation in realized inequality, with over 40% of overall variation between organizational units (25% district, 17% school, Model 3a). Covariates explain approximately half of the persistent organizational variation in realized inequality, and they explain more of district-level inequality (Models 3a and 3b). Nonetheless, even net of these characteristics, a quarter of the remaining variation throughout the period was consistent at the schools or district level. This durability of local inequalities throughout the changes in the algebra-for-all era provides unique evidence for the importance of distinct educational inequality regimes. It also raises questions for future research about the additional characteristics of these regimes that are unmeasured here.
Discussion
Access to advanced mathematics opportunities throughout the algebra-for-all era in California demonstrates that schooling practices both reproduce and subvert socioeconomic inequalities. On average, and consistent throughout expansion, more affluent students were more likely to be in privileged courses, but these inequalities were much less extreme than possible and less unequal than purely test-based “meritocratic” allocations. Consistent with prior research, therefore, our analyses demonstrate that some school sorting practices reproduce socioeconomic inequalities (Bowles and Gintis 1976; Lucas 1999; Oakes 1985), while others work to equalize them (Downey, von Hippel, and Broh 2004; Grodsky 2007; Raudenbush and Eschmann 2015).
Our analyses build on these relatively well-established findings by highlighting variation in local inequalities. The coefficient of variation for school-level inequality (standard deviation as a proportion of the mean value) was greater than 0.8 throughout the study period (ranging from 0.81 in 2004 to 1.03 in 2013, see Table 2). While we almost never observe advanced course assignment systems that fully compensate for socioeconomic inequality, we do observe substantial cross-school variation in the poor/non-poor gap in advanced course enrollments. Such overall variation reflects both variation in the provision and allocation of advanced mathematics opportunities. These findings suggest that educational disparities emerge out of distinct school-level organizational inequality regimes. Consistent with the notion of schools as inequality regimes, we find that school-level socioeconomic inequalities in access to advanced courses vary with school context and exhibit stability over time.
Since educational inequality regimes result from diverse local conditions, our results particularly highlight the tension between local organizational agency and external constraints. Some constraints are specific to institutional context, such as the statewide push to expand advanced opportunities during algebra-for-all. Others are more general, such as resources for instruction, district-level policies, and the prior academic preparation of a school’s students. Even so, there is considerable room for local decision-makers to influence the creation and distribution of educational opportunities. These school-level decisions in turn help to determine the magnitude of within-school opportunity inequality.
It is important to note that there is a difference between access to desirable opportunities and benefits of those opportunities, and the ultimate impacts of the inequalities we describe here are unclear. While the social consequences of access to advanced middle school mathematics are potentially large, they are also uncertain. Early Algebra enrollment is associated with improved educational outcomes, and higher track placement predicts important and lasting social benefits (e.g., Carroll et al. 2017; McEachin, Domina, and Penner 2020). However, poor implementation (such as mismatches between students’ preparation and instruction) of algebra-for-all may lead to unanticipated negative consequences (Clotfelter, Ladd, and Vigdor 2015; Domina et al. 2015; Nomi and Raudenbush 2016). This uncertainty regarding the ultimate effects of 8th grade algebra enrollment may contribute to the variation that we observe in the ways schools distribute access to this educational opportunity.
Our results only speak directly to one specific axis of socioeconomic inequality, as measured by enrollment in the means-tests school lunch program. This measure is meaningful as a formal organizational category applied to students and a meaningful proxy for socioeconomic background proxies for income (Domina et al. 2018), but other dimensions of social background may yield different local inequality patterns, perhaps with more pronounced disparities. However, we find similar patterns in supplementary models of racial inequalities, suggesting our results reflect broader organizational inequality dynamics.
The results are also specific to the algebra-for-all environment of California in the 2000s, which promoted rapid and widespread changes to allocations without determining how to do so. Expansion under different circumstances may lead to different patterns. A stronger mandate for expansion may inspire new forms of organizational resistance, while expansion without policy pressure is likely to be more selective and may have different consequences. Similarly, while algebra-for-all highlights within-school inequalities, local inequality regimes may take on different meaning in contexts where between-organization provision and allocation processes are more central, as in access to post-secondary education. Still, this case study suggests the value of considering meso-level inequality processes in such settings.
This study of changing inequalities in access to algebra during a period of pronounced, but uneven, opportunity expansion contributes to several research traditions. First, we add to research on school differences in course inequalities (Garet and DeLany 1988; Kelly 2009; Lucas and Berends 2007). While much of that research considers high school, we show similar patterns apply earlier, and our results highlight technical/functional—and opportunity hoarding for allocation processes—explanations for organizational differences. Moreover, our panel census data reveals two new details not apparent in either case studies (e.g., Lewis and Diamond 2015) and cross-sectional survey data (e.g., Kelly 2009). First, longitudinal comparisons reveal school-level durability in socioeconomic inequality in access to advanced courses, in both provision and allocation processes. Second, data from all schools reveal that a substantial portion of between-school variability is between school districts, implying an important role of district policy (and characteristics of the surrounding local community). Future tracking research can use more detailed administrative records to further refine these insights.
Our findings also contribute to research on expansion and inequality. Consistent with the expectations of MMI, socioeconomic inequalities in algebra opportunities progressed through a curvilinear trajectory during the period of opportunity. However, local disparities were far from the maximum possible throughout, and inequalities did not reach a point of advantaged group saturation before declining, suggesting less extreme inequitable social forces than sometimes assumed. Our analyses do not directly test MMI hypotheses, yet they demonstrate that organizational variation—typically obscured in maintained inequalities research—offers insight into the processes through which inequalities may be maintained. An organizational perspective focuses attention on why and how new opportunities are created, which is critical for isolating the impacts of expansion from confounding influences on both expansion and inequality (Jackson 2019). Organizational-level data also create unique empirical leverage to address this confounding. Notably, our analyses with school fixed effects rule out unmeasured (time-invariant) school confounders of the association between opportunities and inequality, bolstering a causal interpretation of that association here.
Finally, our analyses contribute to scholarship on the organizational sources of social stratification. Scholars increasingly recognize the role that meso-level organizational conditions play in creating social inequalities, especially for employees in firms (Tomaskovic-Devey and Avent-Holt 2019). Our analyses show the value of translating these ideas to the experiences of students in educational settings, where access to advanced learning opportunities is a key resource, and provision and allocation of learning opportunities are key organizational processes. While we identify key predictors of differences, such as instructional resources and students’ prior preparation, more work is needed to explore the full contours of school inequality regimes, including factors such as educators’ equity orientations, procedures for student assessment, and interactions between educators, students, and parents. Such factors likely explain the durability seen in persistent unexplained variation in inequalities between schools and districts over time. Future research should investigate whether consistency over time is similar, higher, or lower in other settings such as labor market disparities within firms. More generally, this aspect of our analyses points to the need for greater theoretical and empirical attention to when, why, and how inequality regimes change (Acker 2006; Tomaskovic-Devey and Avent-Holt 2019).
Documenting organizational variation in middle school mathematics is an initial step in characterizing educational inequality regimes. For example, while our analyses have focused on decisions about the distribution of opportunities within local schools, organizational practices also include or exclude students altogether, and these processes may be more relevant for other dimensions of inequality. One example is post-secondary opportunities, access to which is governed by admissions decisions across a field of different types of organizations. Another is racial/ethnic differences in access to advanced mathematics opportunities, which are shaped by more pronounced between-school segregation in addition to within-school practices. Nonetheless, as we increasingly appreciate heterogeneity in these inequalities across contexts (e.g., Shores, Kim, and Still 2020), an educational inequality regimes perspective can illuminate the local educational sorting processes that create many forms of educational inequalities.
Supplementary Material
ACKNOWLEDGEMENT
Research reported in this paper was supported by: the Spencer Foundation, Grant 201400180 (PI: Thurston Domina); U.S. Department of Education, Grant R305B120013 to the University of California, Irvine (PI: Greg Duncan); and the Eunice Kennedy Shriver National Institute Of Child Health & Human Development of the National Institutes of Health under Award Numbers P01HD065704 (PI: Greg Duncan) and R01HD094007 (PI: Andrew Penner). The content is solely the responsibility of the authors and does not necessarily represent the official views of the supporting agencies.
Footnotes
We focus on socioeconomic opportunity disparities given our interest in state-wide variation in within-school inequality processes. Most schools enroll, and must sort, both poor and nonpoor students. By contrast, more extreme racial/ethnic segregation mean that local inequalities are undefined in many schools, reflecting the greater importance of between-school sources of inequality.
Without loss of generality, we describe this framework in terms of the simple case of two types of educational opportunities (algebra vs. regular mathematics) and two types of students (non-poor vs. poor).
This queue for opportunities is unobservable, since it reflects a set of counterfactual information—which students would be assigned to advanced courses for every possible number of seats of advanced courses. In practice, it can be approximated by observing the characteristics of students above and below the threshold for the observed number of seats.
Potential inequality is a function of both provision and student composition (see Equation 1). We focus on the former as the primary source of change during expansion.
The proportion-based realized inequality calculation is unstable near 0% and 100% algebra enrollment, when potential inequality is low. For instance, in the unlikely case in which only one nonpoor student is assigned to algebra, inequality is the maximum possible.
Dropped schools were mostly high-poverty schools. The majority (84.8%) did not enroll (or lacked information on) nonpoor students.
The state reports test-taking for all subgroups in a school, but not scores for subgroups with less than 10 students in a year. We omitted schools (47) for which prior achievement was not available for both poor and nonpoor students in at least 5 years of the panel. For the 159 schools with at least 5 valid observations but incomplete data, we imputed prior achievement based on the school-specific mean achievement for the panel. Imputed values represent 3.2% of all school-year observations.
The possible tests in grade 8, with the percentage of students represented across all years, are: Algebra I (49.7%), General Mathematics (43.1%), Geometry (4.2%), Algebra II (0.1%), and Integrated Mathematics I/II/III (0.1%). For parsimony, we refer to our main Algebra I or higher construct as “Algebra” throughout the paper.
Conclusions are similar using measures of inequality in terms of odds ratios. We prefer differences in proportions because these are intuitive, of substantive interest, and allow us to define potential inequality (when odds ratios are often undefined) and realized inequality.
Research demonstrates that this measure corresponds with verified parental income and may also capture an additional dimension of socioeconomic disadvantage (Domina et al. 2018).
The data preclude measures of academic preparation that predate enrollment in middle school. Since approximately one third of middle schools begin in grade 7, this is the earliest test score available across the entire sample. Results are similar if we use 6th grade achievement scores (within the subsample for which this is possible), because the two measures are highly correlated.
Potential inequality is also by definition the maximum level of inequality possible for a given level of provision. In this paper, we use “maximum possible inequality” as a synonym for “potential inequality” and “fully realized inequality.” We do not emphasize this terminology to avoid confusion with the distinct concept of “maximally maintained” inequality (Raftery and Hout 1993).
In this validation sample, errors do not differ by school SES, but they are moderately related with the provision of algebra (correlation = .3), with positive mean error for Algebra enrollments over 70%. The mean error for this range is 1.0 percentage points. This means results may understate nonpoor students’ advantages in later years (when provisions were higher), by up to 10% of the true value on average. As a result, we are cautious in interpretating the apparent trend toward greater equity over time relative to meritocratic allocation in our data.
The descriptive correlation between potential and realized inequality is negative (−0.3), which is opposite of expected if underlying propensities for inequality influence both processes. Rather, this association occurs because no schools realize the highest levels of potential inequality, perhaps reflecting pressures against completely segregated opportunities.
In supplemental analyses, we find that the association between opportunities and inequality is parsimoniously explained by a quadratic function and that this association did not significantly change over time. Neither is driven by between-school differences; the same is true with school-fixed effects.
For analyses of allocation differences, we exclude cases of undifferentiated mathematics opportunities (less than 5% [80 cases] algebra or greater than 95% [1,913 cases]), which provide no meaningful information about allocation. Inequalities for these observations are near zero, so including them would cause allocations to seem less inequitable overall. The resulting sample is 8,814 school-year observations, or 87% of all cases.
One possible explanation for inequalities that appear less unequal than meritocratic is error in the prior standardized achievement scores that overstate nonpoor students’ readiness for advanced mathematics relative to the full information educators observe. This is implausible both for random measurement error (because test reliability is above 0.90 for all years and student subgroups and there is no evidence of differential item functioning by socioeconomic status) and for systemic bias (since testing bias against poor students is unlikely to be larger than biases in educators’ assessments).
Substantive results are similar in alternate specifications: omitting the share of nonpoor students variable (due to connection with the outcome and possible collinearity with racial/ethnic variables), allowing interactions between nonpoor share and racial/ethnic variables, using school mean values of each predictor (to mitigate measurement error in yearly variables, especially the test score gap measure), and estimation with school fixed effects (to consider only within-school variation). Results are also comparable for an alternate operationalization of realized inequality as observed inequality controlling for Algebra provision.
In a supplemental model predicting differentiation as a binary outcome, school size is the strongest predictor.
Results are also similar in alternate specifications with interactions between SES and racial composition, school fixed effects estimation, and controlling for the level of provision.
Contributor Information
Paul Hanselman, University of California, Irvine.
Thurston Domina, University of North Carolina, Chapel Hill.
NaYoung Hwang, University of Missouri.
Citations
- Acker Joan. 2006. “Inequality Regimes Gender, Class, and Race in Organizations.” Gender & Society 20(4):441–64. doi: 10.1177/0891243206289499. [DOI] [Google Scholar]
- Alon Sigal. 2009. “The Evolution of Class Inequality in Higher Education: Competition, Exclusion, and Adaptation.” American Sociological Review 74(5):731–55. doi: 10.1177/000312240907400503. [DOI] [Google Scholar]
- Arum Richard, Gamoran Adam, and Shavit Yossi. 2007. “More Inclusion than Diversion: Expansion, Differentiation, and Market Structure in Higher Education.” Stratification in Higher Education: A Comparative Study 1–35. [Google Scholar]
- Bowles Samuel, and Gintis Herbert. 1976. Schooling in Capitalist America: Educational Reform and the Contradictions of Economic Life. New York: Basic Books. [Google Scholar]
- Breen Richard, Luijkx Ruud, Muller Walter, and Pollak Reinhard. 2009. “Nonpersistent Inequality in Educational Attainment: Evidence from Eight European Countries.” American Journal of Sociology 114(5):1475–1521. [DOI] [PubMed] [Google Scholar]
- Carbonaro William. 2005. “Tracking, Students’ Effort, and Academic Achievement.” Sociology of Education 78(1):27–49. [Google Scholar]
- Carroll Jamie M., Muller Chandra, Grodsky Eric, and Warren John Robert. 2017. “Tracking Health Inequalities from High School to Midlife.” Social Forces 96(2):591–628. doi: 10.1093/sf/sox065. [DOI] [PMC free article] [PubMed] [Google Scholar]
- Clotfelter Charles T., Ladd Helen F., and Vigdor Jacob L.. 2015. “The Aftermath of Accelerating Algebra Evidence from District Policy Initiatives.” Journal of Human Resources 50(1):159–88. doi: 10.3368/jhr.50.1.159. [DOI] [Google Scholar]
- Cohen Phillip, and Huffman Matt L.. 2007. “Working for the Woman? Female Managers and the Gender Wage Gap.” American Sociological Review 72(5):681–704. [Google Scholar]
- Dauber Susan L., Alexander Karl L., and Entwisle Doris R.. 1996. “Tracking and Transitions through the Middle Grades: Channeling Educational Trajectories.” Sociology of Education 69(4):290–307. [Google Scholar]
- Domina Thurston, Hanselman Paul, Hwang NaYoung, and McEachin Andrew. 2016. “Detracking and Tracking Up Mathematics Course Placements in California Middle Schools, 2003–2013.” American Educational Research Journal 53(4):1229–126. doi: 10.3102/0002831216650405. [DOI] [Google Scholar]
- Domina Thurston, Andrew McEachin Paul Hanselman, Agarwal Priyanka, Hwang NaYoung, and Lewis Ryan W.. 2019. “Beyond Tracking and Detracking: The Dimensions of Organizational Differentiation in Schools.” Sociology of Education 92(3):293–322. doi: 10.1177/0038040719851879. [DOI] [Google Scholar]
- Domina Thurston, Andrew McEachin Andrew Penner, and Penner Emily. 2015. “Aiming High and Falling Short California’s Eighth-Grade Algebra-for-All Effort.” Educational Evaluation and Policy Analysis 37(3):275–95. doi: 10.3102/0162373714543685. [DOI] [Google Scholar]
- Domina Thurston, Penner Andrew, and Penner Emily. 2017. “Categorical Inequality: Schools As Sorting Machines.” Annual Review of Sociology 43(1):311–30. doi: 10.1146/annurev-soc-060116-053354. [DOI] [PMC free article] [PubMed] [Google Scholar]
- Domina Thurston, Pharris-Ciurej Nikolas, Penner Andrew M., Penner Emily K., Brummet Quentin, Porter Sonya R., and Sanabria Tanya. 2018. “Is Free and Reduced-Price Lunch a Valid Measure of Educational Disadvantage?” Educational Researcher 47(9):539–55. doi: 10.3102/0013189X18797609. [DOI] [Google Scholar]
- Domina Thurston, and Saldana Joshua. 2012. “Does Raising the Bar Level the Playing Field? Mathematics Curricular Intensification and Inequality in American High Schools, 1982–2004.” American Educational Research Journal 49(4):685–708. doi: 10.3102/0002831211426347. [DOI] [Google Scholar]
- Downey Douglas B., von Hippel Paul T., and Broh Beckett A.. 2004. “Are Schools the Great Equalizer? Cognitive Inequality During the Summer Months and the School Year.” American Sociological Review 69(5):613–35. [Google Scholar]
- Fligstein Neil, and McAdam Doug. 2012. A Theory of Fields. Oxford University Press. [Google Scholar]
- Gamoran Adam. 1987. “The Stratification of High School Learning Opportunities.” Sociology of Education 60(3):135–55. [Google Scholar]
- Garet Michael S., and DeLany Brian. 1988. “Students, Courses, and Stratification.” Sociology of Education 61(2):61–77. doi: 10.2307/2112265. [DOI] [Google Scholar]
- Grodsky Eric. 2007. “Compensatory Sponsorship in Higher Education.” American Journal of Sociology 112(6):1662–1712. [Google Scholar]
- Hallinan Maureen T. 1994. “Tracking: From Theory to Practice.” Sociology of Education 67(2):79–84. doi: 10.2307/2112697. [DOI] [Google Scholar]
- Huffman Matt L., Cohen Philip N., and Pearlman Jessica. 2010. “Engendering Change: Organizational Dynamics and Workplace Gender Desegregation, 1975—2005.” Administrative Science Quarterly 55(2):255–77. [Google Scholar]
- Iatarola Patrice, Conger Dylan, and Long Mark C.. 2011. “Determinants of High Schools’ Advanced Course Offerings.” Educational Evaluation and Policy Analysis 33(3):340–59. doi: 10.3102/0162373711398124. [DOI] [Google Scholar]
- Jackson Michelle. 2019. “Expansion, Enrollment, and Inequality of Educational Opportunity.” Sociological Methods & Research 0049124119852376. doi: 10.1177/0049124119852376. [DOI] [Google Scholar]
- Kellogg Katherine C. 2011. Challenging Operations: Medical Reform and Resistance in Surgery. University of Chicago Press. [Google Scholar]
- Kelly S, and Price H. 2011. “The Correlates of Tracking Policy: Opportunity Hoarding, Status Competition, or a Technical-Functional Explanation?” American Educational Research Journal 48(3):560–85. doi: 10.3102/0002831210395927. [DOI] [Google Scholar]
- Kelly Sean. 2009. “The Black-White Gap in Mathematics Course Taking.” Sociology of Education 82(1):47–69. [Google Scholar]
- Kerckhoff Alan C., Fogelman Ken, and Manlove Jennifer. 1997. “Staying Ahead: The Middle Class and School Reform in England and Wales.” Sociology of Education 70(1):19–35. doi: 10.2307/2673190. [DOI] [Google Scholar]
- Klugman Joshua. 2013. “The Advanced Placement Arms Race and the Reproduction of Educational Inequality.” Teachers College Record 115(5):1–34. [Google Scholar]
- Lareau Annette. 2011. Unequal Childhoods: Class, Race, and Family Life. Berkeley: University of California Press. [Google Scholar]
- Lewis Amanda E., and Diamond John B.. 2015. Despite the Best Intentions: How Racial Inequality Thrives in Good Schools. Oxford University Press. [Google Scholar]
- Long Mark C., Conger Dylan, and Iatarola Patrice. 2012. “Effects of High School Course-Taking on Secondary and Postsecondary Success.” American Educational Research Journal 49(2):285–322. doi: 10.3102/0002831211431952. [DOI] [Google Scholar]
- Lucas Samuel R. 2001. “Effectively Maintained Inequality: Education Transitions, Track Mobility, and Social Background Effects.” American Journal of Sociology 106(6):1642–90. [Google Scholar]
- Lucas Samuel R., and Berends Mark. 2007. “Race and Track Location in U.S. Public Schools.” Research in Social Stratification and Mobility 25(3):169–87. [Google Scholar]
- Lucas Samuel Roundfield. 1999. Tracking Inequality : Stratification and Mobility in American High Schools. New York: Teachers College Press. [Google Scholar]
- McEachin Andrew, Domina Thurston, and Penner Andrew. 2020. “Heterogeneous Effects of Early Algebra across California Middle Schools.” Journal of Policy Analysis and Management 39(3):772–800. doi: 10.1002/pam.22202. [DOI] [PMC free article] [PubMed] [Google Scholar]
- Nomi Takako, and Raudenbush Stephen W.. 2016. “Making a Success of ‘Algebra for All’: The Impact of Extended Instructional Time and Classroom Peer Skill in Chicago.” Educational Evaluation and Policy Analysis 38(2):431–51. doi: 10.3102/0162373716643756. [DOI] [Google Scholar]
- Oakes Jeannie. 1985. Keeping Track: How Schools Structure Inequality. New Haven: Yale University Press. [Google Scholar]
- Oakes Jeannie. 1994. “More Than Misapplied Technology: A Normative and Political Response to Hallinan on Tracking.” Sociology of Education 67(2):84–91. doi: 10.2307/2112698. [DOI] [Google Scholar]
- Oakes Jeannie, and Guiton Gretchen. 1995. “Matchmaking: The Dynamics of High School Tracking Decisions.” American Educational Research Journal 32(1):3–33. doi: 10.3102/00028312032001003. [DOI] [Google Scholar]
- Oakes Jeannie, Amy Stuart Wells Makeba Jones, and Datnow Amanda. 1997. “Detracking: The Social Construction of Ability, Cultural Politics, and Resistance to Reform.” Teachers College Record 98(3):482–510. [Google Scholar]
- Paterson Lindsay, and Iannelli Cristina. 2007. “Social Class and Educational Attainment: A Comparative Study of England, Wales, and Scotland.” Sociology of Education 80(4):330–58. doi: 10.1177/003804070708000403. [DOI] [Google Scholar]
- Raftery Adrian E., and Hout Michael. 1993. “Maximally Maintained Inequality: Expansion, Reform, and Opportunity in Irish Education, 1921-75.” Sociology of Education 66(1):41–62. [Google Scholar]
- Raudenbush Stephen W., and Eschmann Robert D.. 2015. “Does Schooling Increase or Reduce Social Inequality?” Annual Review of Sociology 41(1):443–70. doi: 10.1146/annurev-soc-071913-043406. [DOI] [Google Scholar]
- Rickles Jordan H. 2011. “Using Interviews to Understand the Assignment Mechanism in a Nonexperimental Study The Case of Eighth Grade Algebra.” Evaluation Review 35(5):490–522. doi: 10.1177/0193841X11428644. [DOI] [PubMed] [Google Scholar]
- Rosin Matthew, Barondess Heather, and Leichty Julian. 2009. Algebra Policy in California: Great Expectations and Serious Challenges. Mountain View, CA: EdSource. [Google Scholar]
- Schmidt William H., Burroughs Nathan A., Zoido Pablo, and Houang Richard T.. 2015. “The Role of Schooling in Perpetuating Educational Inequality An International Perspective.” Educational Researcher 0013189X15603982. doi: 10.3102/0013189X15603982. [DOI] [Google Scholar]
- Schofer Evan, and Meyer John W.. 2005. “The Worldwide Expansion of Higher Education in the Twentieth Century.” American Sociological Review 70(6):898–920. [Google Scholar]
- Shores Kenneth, Kim Ha Eun, and Still Mela. 2020. “Categorical Inequality in Black and White: Linking Disproportionality Across Multiple Educational Outcomes.” American Educational Research Journal 0002831219900128. doi: 10.3102/0002831219900128. [DOI] [Google Scholar]
- Smith-Doerr Laurel, Alegria Sharla, Kaye Husbands Fealing, Debra Fitzpatrick, and Donald Tomaskovic-Devey. 2019. “Gender Pay Gaps in U.S. Federal Science Agencies: An Organizational Approach.” American Journal of Sociology 125(2):534–76. doi: 10.1086/705514. [DOI] [Google Scholar]
- Sørensen Aage B. 1970. “Organizational Differentiation Of Students And Educational Opportunity.” Sociology of Education 43(4):355–76. [Google Scholar]
- Sørensen Aage B. 1989. “Schools and the Distribution of Educational Opportunities.” Research in the Sociology of Education and Socialization 8:3–26. [Google Scholar]
- Tomaskovic-Devey Donald, and Dustin Avent-Holt. 2019. Relational Inequalities: An Organizational Approach. [Google Scholar]
- Tomaskovic-Devey Donald, Martin Hällsten, and Dustin Avent-Holt. 2015. “Where Do Immigrants Fare Worse? Modeling Workplace Wage Gap Variation with Longitudinal Employer-Employee Data1.” American Journal of Sociology 120(4):1095–1143. [DOI] [PubMed] [Google Scholar]
- Tyson Karolyn. 2011. Integration Interrupted: Tracking, Black Students, and Acting White after Brown. New York: Oxford University Press. [Google Scholar]
- Vallas Steven P., and Hill Andrea. 2012. “Conceptualizing Power in Organizations.” Pp. 165–97 in Rethinking Power in Organizations, Institutions, and Markets. Vol. 34, Research in the Sociology of Organizations, edited by Courpasson D, Golsorkhi D, and Sallaz JJ. Emerald Group Publishing Limited. [Google Scholar]
- Watanabe Maika. 2006. “‘Some People Think This School Is Tracked and Some People Don’t’: Using Inquiry Groups to Unpack Teachers’ Perspectives on Detracking.” Theory Into Practice 45(1):24–31. doi: 10.1207/s15430421tip4501_4. [DOI] [Google Scholar]
- Wells Amy Stuart, and Oakes Jeannie. 1996. “Potential Pitfalls of Systemic Reform: Early Lessons from Research on Detracking.” Sociology of Education 69:135–43. doi: 10.2307/3108461. [DOI] [Google Scholar]
Associated Data
This section collects any data citations, data availability statements, or supplementary materials included in this article.