Abstract
Background
The KRAS p.G12C mutation has recently become an actionable drug target. To further understand KRAS p.G12C disease, we describe clinicopathologic characteristics, treatment patterns, overall survival (OS), and real-world progression-free survival (rwPFS) in patients with metastatic colorectal cancer (mCRC), KRAS p.G12C mutations (KRAS G12C), and other KRAS mutations (KRAS non-G12C) using a de-identified database.
Patients and Methods
Clinical and tumor characteristics, including treatments received, genomic profile, and clinical outcomes were assessed for patients from a US clinical genomic database with mCRC diagnosed between January 1, 2011, and March 31, 2020, with genomic sequencing data available.
Results
Of 6477 patients with mCRC (mCRC cohort), 238 (3.7%) had KRAS G12C and 2947 (45.5%) had KRAS non-G12C mutations. Treatment patterns were generally comparable across lines of therapy (LOT) in KRAS G12C versus KRAS non-G12C cohorts. Median (95% CI) OS after the first LOT was 16.1 (13.0-19.0) months for the KRAS G12C cohort versus 18.3 (17.2-19.3) months for the KRAS non-G12C cohort, and 19.2 (18.5-19.8) months for the mCRC overall cohort; median (95% CI) rwPFS was 7.4 (6.3-9.5), 9.0 (8.2-9.7), and 9.2 (8.6-9.7) months, respectively. The different KRAS non-G12C mutations examined did not affect clinical outcomes. Median OS and rwPFS for all cohorts declined with each subsequent LOT.
Conclusions
Patients with KRAS p.G12C-mutant mCRC have poor treatment outcomes, and outcomes appear numerically worse than for those without this mutation, indicating potential prognostic implications for KRAS p.G12C mutations and an unmet medical need in this population.
Keywords: KRAS p.G12C, metastatic colorectal cancer, retrospective
The KRAS p.G12C mutation is an actionable drug target. To further understand KRAS p.G12C disease, this article describes clinicopathologic characteristics, treatment patterns, overall survival, and real-world progression-free survival in patients with metastatic colorectal cancer, KRAS p.G12C mutations (KRAS G12C), and other KRAS mutations using a de-identified database.
Implications for Practice.
Using data from a real-world clinical database in patients with metastatic colorectal cancer (mCRC), treatment patterns were generally comparable in those with or without the KRAS p.G12C mutation. Numerically shorter median OS and rwPFS were observed for the KRAS G12C cohort compared with KRAS non-G12C (including subgroups) and mCRC cohorts after the first line of therapy; OS and rwPFS further decreased in all cohorts after second, third, and fourth lines of therapy. Clinical outcomes suggest KRAS p.G12C may have prognostic implications and suggest an unmet medical need in KRAS p.G12C-mutant mCRC.
Introduction
Colorectal cancer (CRC) is the fourth most commonly diagnosed cancer and a leading cause of cancer death in the US, with approximately 149,500 new cases and 52,980 deaths in 2021. Approximately 22% of new cases are metastatic, with a 5-year survival rate of 14.7%.1
It is recommended that all patients with metastatic CRC (mCRC) have their primary or metastatic tumor tissues genotyped for RAS and BRAF mutations at a certified clinical laboratory, either through individual testing or as part of a next-generation sequencing (NGS) panel2 to guide treatment decisions. For instance, treatment with an epidermal growth factor receptor (EGFR) inhibitor such as cetuximab or panitumumab is contraindicated in patients with RAS mutations, even in combination regimens, highlighting a greater unmet need in patients with RAS mutations.
KRAS is mutated in approximately 37% of mCRC; the KRAS p.G12C mutation occurs in approximately 3% of mCRC cases.3-5 The prognostic significance of KRAS mutations overall in CRC is not clear, although some KRAS mutations do appear to be associated with inferior outcomes compared with nonmutated tumors. In particular, the KRAS p.G12C mutation is associated with poorer prognosis in terms of progression-free survival (PFS) and overall survival (OS) compared to other KRAS mutations as well as KRAS wild-type tumors.4-7 However, as KRAS p.G12C mutant mCRC is now recognized as a discrete potentially druggable subset of mCRC, there is a need to understand the difference in outcomes for KRAS p.G12C compared to other KRAS mutations and wild-type tumors.5
To help build a greater understanding of KRAS p.G12C mutated mCRC, this study describes clinicopathologic characteristics and treatment patterns in patients with mCRC, including cohorts of patients with KRAS p.G12C and KRAS non-p.G12C mutations, and estimates OS and real-world progression-free survival (rwPFS) after different lines of therapy (LOT) in the metastatic setting using data from a US clinical-genomic database. The study aims to provide a baseline against which to compare the real-world outcomes after treatment with KRASG12C-specific therapy.
Methods
Study Design and Patients
This retrospective study of adults (≥18 years at diagnosis) with mCRC diagnosed between January 1, 2011, and March 31, 2020 using real-world data, was performed to characterize clinicopathologic characteristics, treatment patterns, and outcomes using descriptive analysis. Patients from the US-based nationwide de-identified Flatiron Health (FH)-Foundation Medicine (FMI) clinical-genomic database8 were followed through September 2020 to ensure the opportunity of ≥6 months of follow-up after diagnosis of mCRC.
The database contains de-identified real-world clinical and genomic data from ~280 US cancer clinics (~800 sites of care). Retrospective longitudinal clinical data were derived from electronic health records (EHRs), comprising patient-level structured and unstructured data. Structured data (eg, laboratory test results, medications) were collected across sites and aligned to standard ontologies. Unstructured data (eg, physician notes on disease progression), required a level of manual abstraction by trained abstractors, which was found to be reliable with minimal interabstractor variability.9 Data abstracted from EHRs curated via technology were linked to genomic data derived from FMI comprehensive genomic profiling tests and signature results in the FH-FMI clinical-genomic database by de-identified, deterministic matching.10,11
Genomic alterations present in tumor tissues were identified via comprehensive genomic profiling of >300 cancer-related genes on FMI’s NGS-based FoundationOne (Foundation Medicine, Cambridge, MA, USA) panel.12 This NGS testing is used to detect short-variant mutations, rearrangements, and copy number alterations from tumor tissues. This testing platform has 95%-99% sensitivity compared with accepted assays, with a positive predictive value of over 99%.12 To date, >400,000 samples from patients have been sequenced. For this study, all available FMI testing was used to assess for the presence of KRAS mutations and assign patients to the appropriate cohorts; if multiple FMI test results were available, the test with the report date closest to that of the metastatic diagnosis date was used to define the presence of other genomic variables.
Patients were defined into cohorts by mutation status (see Statistical Analyses Section). Patients with KRAS mutant were further defined as either having a KRAS p.G12C mutation (KRAS G12C mutant) or not having a KRAS p.G12C mutation (KRAS non-G12C).
Outcomes
Treatment patterns for metastatic disease, including information on chemotherapies, targeted therapies, immunotherapies, and other therapies, were collected from EHRs using a combination of structured (ie, medication orders, medication administration) and unstructured data (ie, abstracted oral medications), and anchored around the date of the mCRC diagnosis. Information on start and end dates for each LOT was collected, as were specific details of each drug regimen. The first LOT was defined from the start of the first systemic drug(s) in the metastatic setting to the last administration of any drug of that LOT; the LOT could not include clinical study drugs or adjuvant treatments and had to be initiated on or before March 31, 2020 to allow the opportunity for a minimum of 6 months of follow-up. All subsequent LOTs were defined similarly.
Primary effectiveness endpoints included OS and rwPFS and were calculated for each LOT: OS was time from treatment start to death; rwPFS was time from treatment start to progression or death. Assessment of OS from real-world data has been shown to provide survival results comparable to those derived from the National Death Index across a range of cancer types including mCRC, with a high sensitivity (84%-92%) and specificity (94%->99%), and a positive predictive value of 96%-98%.13 Progression was determined from unstructured data records in EHRs based on physician evaluation during visits and abstracted from the EHR using trained abstractors reviewing the records retrospectively. This approach is conceptually different from prospective analysis of progression within a clinical trial environment (ie, outcomes assessed using Response Evaluation Criteria In Solid Tumors) and is likely based on less frequent and less systematic assessments than those undertaken in clinical trials. Nonetheless, this approach to the assessment of rwPFS provides consistent results, and has been shown to correlate well with OS.9
Statistical Analyses
All analyses were descriptive, with no formal hypothesis testing undertaken, and presented using frequencies for categorical variables and mean (SD) or median (range) for continuous variables; no missing data were imputed. Treatment patterns were based on observed distribution of treatments administered and were described using frequencies. Nonparametric methods were used to estimate OS and rwPFS; corresponding 95% CIs were calculated using Kaplan-Meier estimates; survival probabilities (95% CI) for OS and rwPFS at 6 and 12 months were estimated. Immortal time bias, which could occur when the NGS test was done after the start of treatment, was addressed using delayed-entry statistics. For OS and rwPFS, patients were censored at the time they were lost to follow-up or when the study ended. For patients who received treatment, OS and rwPFS analyses were conducted by LOT; other subgroup analyses were undertaken based on age, treatment types, biomarker status, and other important prognostic factors.
Study outcomes (clinical pathological characteristics, treatment patterns, OS, and rwPFS) were analyzed for all patients with mCRC and by mutation status, including KRAS p.G12C mutation (KRAS G12C cohort), KRAS mutation other than p.G12C (KRAS non-G12C cohort), and RAS/BRAF wild-type (RAS/BRAF WT cohort). In addition, OS and rwPFS were analyzed for the subgroup of the mCRC population with BRAF V600E mutation (BRAF V600E subgroup), and by the most common KRAS non-p.G12C mutations (KRAS p.G12D [KRAS G12D subgroup], KRAS p.G12V [KRAS G12V subgroup], and KRAS p.G13D [KRAS G13D subgroup]). Patients with FMI test results with no reported date were included in the overall cohorts and subgroups, but were not included in the analysis of OS and rwPFS. All analyses were undertaken using SAS version 9.4 or higher (SAS Institute, Cary, NC, USA).
Results
Overall, 6477 patients with mCRC were included; 238 (3.7%) had KRAS p.G12C (KRAS G12C cohort) and 2947 (45.5%) had KRAS mutations other than p.G12C (KRAS non-G12C cohort) mutations. Baseline demographic and clinical characteristics were generally similar across the KRAS G12C and KRAS non-G12C cohorts (Table 1). Most patients had metastatic disease at initial diagnosis (KRAS G12C, 56.7%; KRAS non-G12C, 58.0%; RAS/BRAF WT, 57.4%; mCRC, 57.7%); disease was predominantly in the colon (68.5%, 73.7%, 71.6%, and 73.2%, respectively) and was typically left-sided. Of the 4565 patients with mCRC assessed for OS after the first LOT, 308 (6.7%) had BRAF V600E mutations (BRAF V600E subgroup). Of the 2078 patients in the KRAS non-G12C cohort assessed for OS after the first LOT, 726 (34.9%) had KRAS p.G12D mutations (KRAS G12D subgroup), 458 (22.0%) had KRAS p.G12V mutations (KRAS G12V subgroup), and 367 (17.7%) had KRAS p.G13D mutations (KRAS G13D subgroup).
Table 1.
Demographics, clinical characteristics, and outcomes in different cohorts
| KRAS G12C mutation (n = 238) | KRAS non-G12C mutation (n = 2947) | RAS/BRAF WT (n = 2249) | mCRC (N = 6477) | |
|---|---|---|---|---|
| Age at metastatic diagnosis, median (range), y | 59 (30-84) | 60 (20-85) | 58 (22-85) | 60 (18-85) |
| Female, n (%) | 103 (43.3) | 1443 (49.0) | 892 (39.7) | 2986 (46.1) |
| Race, n (%) | ||||
| White | 151 (63.4) | 1987 (67.4) | 1464 (65.1) | 4318 (66.7) |
| Black | 21 (8.8) | 278 (9.4) | 152 (6.8) | 503 (7.8) |
| Other | 48 (20.2) | 455 (15.4) | 473 (21.0) | 1173 (18.1) |
| NA | 18 (7.6) | 227 (7.7) | 160 (7.1) | 483 (7.5) |
| Community setting | 213 (89.5) | 2603 (88.3) | 2037 (90.6) | 5770 (89.1) |
| Diagnosed with metastatic disease in 2017 or later | 127 (53.4) | 1513 (51.3) | 1132 (50.3) | 3333 (51.5) |
| Metastatic disease at initial diagnosis | 135 (56.7) | 1710 (58.0) | 1290 (57.4) | 3739 (57.7) |
| Site of disease | ||||
| Colon | 163 (68.5) | 2171 (73.7) | 1610 (71.6) | 4743 (73.2) |
| Rectum | 71 (29.8) | 727 (24.7) | 588 (26.1) | 1606 (24.8) |
| Colorectal, NOS | 4 (1.7) | 49 (1.7) | 51 (2.3) | 128 (2.0) |
| Tumor sidednessa | ||||
| Left | 131 (55.0) | 1410 (47.8) | 1428 (63.5) | 3384 (52.2) |
| Right | 65 (27.3) | 880 (29.9) | 336 (14.9) | 1635 (25.2) |
| Other/unknown | 42 (17.6) | 657 (22.3) | 485 (21.6) | 1458 (22.5) |
| Mutation rates, n/Nb (%) | ||||
| APC | 197/233 (84.5) | 2458/2895 (84.9) | 1795/2198 (81.7) | 4967/6341 (78.3) |
| TP53 | 178/238 (74.8) | 1984/2947 (67.3) | 1933/2249 (85.9) | 4851/6477 (74.9) |
| PIK3CA | 40/238 (16.8) | 701/2947 (23.8) | 252/2249 (11.2) | 1156/6477 (17.8) |
| SMAD4 | 31/233 (13.3) | 413/2895 (14.3) | 167/2198 (7.6) | 734/6341 (11.6) |
| FBXW7 | 29/233 (12.4) | 331/2895 (11.4) | 151/2198 (6.9) | 608/6341 (9.6) |
| ATM | 10/233 (4.3) | 144/2895 (5.0) | 100/2198 (4.5) | 309/6341 (4.9) |
| HER2 | 1/238 (0.4) | 52/2947 (1.8) | 70/2249 (3.1) | 144/6477 (2.2) |
| PTEN | 14/238 (5.9) | 151/2947 (5.1) | 53/2249 (2.4) | 283/6477 (4.4) |
| BRAF | 4/238 (1.7) | 40/2947 (1.4) | 0/2249 (0) | 596/6477 (9.2) |
| BRAF V600E | 3/238 (1.3) | 4/2947 (0.1) | 0/2249 (0) | 443/6477 (6.8) |
| NRAS | 3/238 (1.3) | 26/2947 (0.9) | 0/2249 (0) | 289/6477 (4.5) |
| MET | 0/238 | 4/2947 (0.1) | 25/2249 (1.1) | 7/6477 (0.1) |
| NTRK | 0/233 | 3/2895 (0.1) | 9/2198 (0.4) | 14/6341 (0.2) |
| dMMR/MSI-H status, n/Nc (%) | ||||
| dMMR/MSI-H | 3/191 (1.6) | 70/2422 (2.9) | 62/1875 (3.3) | 236/5295 (4.5) |
| Not dMMR/MSI-H | 188/191 (98.4) | 2352/2422 (97.1) | 1813/1875 (96.7) | 5059/5295 (95.5) |
| Tumor mutational burden, n/Nc (%) | ||||
| <10 mutations/Mb | 210/223 (94.2) | 2643/2796 (94.5) | 1934/2056 (94.1) | 5638/6070 (92.9) |
| ≥10 mutations/Mb | 13/223 (5.8) | 153/2796 (5.5) | 122/2056 (5.9) | 432/6070 (7.1) |
| PD-L1 expression, n/Nc (%) | ||||
| <1% | 38/40 (95.0) | 501/555 (90.3) | 420/445 (94.3) | 1121/1237 (90.6) |
| 1%-49% | 2/40 (5.0) | 50/555 (9.0) | 22/445 (5.0) | 102/1237 (8.2) |
| ≥50% | 0/40 | 4/555 (0.7) | 3/445 (0.7) | 14/1237 (1.1) |
Left includes splenic flexure, descending colon, sigmoid, rectosigmoid junction, rectum; right includes cecum, ascending colon, hepatic flexure, transverse colon.
Data not available for all patients.
Includes subset of patients for whom data were available/testing was completed.
Abbreviations: APC, adenomatous polyposis coli; ATM, ATM serine/threonine kinase; BRAF, B-Raf proto-oncogene; CRC, colorectal cancer; FBXW7, F-box and WD repeat domain containing 7; HER2, human epidermal growth factor receptor 2; KRAS, Kirsten rat sarcoma viral oncogene homolog; Mb, megabase; MET, mesenchymal-epithelial transition; dMMR/MSI-H, deficient mismatch repair/microsatellite-high; NOS, not otherwise specified; NRAS, neuroblastoma RAS viral oncogene homolog; NTRK, neurotrophic tyrosine kinase gene; PIK3CA, phosphatidylinositol-4,5-bisphosphate 3-kinase catalytic subunit alpha; PD-1/L1, programmed cell death-1/programmed death ligand-1; PTEN, phosphatase and tensin homolog deleted on chromosome 10; RAS, viral oncogene homolog; RAS/BRAF WT, RAS/BRAF WT mCRC cohort; SMAD4, Mothers Against Decapentaplegic homolog 4; TP53, tumor protein p53 gene; WT, wild-type.
Co-mutation rates were generally comparable across cohorts, with more than 65% of patients having APC and TP53 mutations and more than 6% of patients having PIK3CA, SMAD4, and FBXW7 mutations (Table 1). BRAF and NRAS mutations were lower in the KRAS G12C (1.7% and 1.3%, respectively) and KRAS non-G12C cohorts (1.4% and 0.9%) compared with the overall mCRC cohort (9.2% and 4.5%).
The percentage of deficient mismatch repair/microsatellite-high (dMMR/MSI-H) status was low and comparable among groups (KRAS G12C, 1.6%; KRAS non-G12C, 2.9%; RAS/BRAF WT, 3.3%; mCRC, 4.5%). Similar results were observed for high tumor mutational burden (TMB; ≥10 mutations/megabase: 5.8%, 5.5%, 5.9%, and 7.1%, respectively), and high PD-L1 expression levels (≥50%: 0%, 0.7%, 0.7%, and 1.1%).
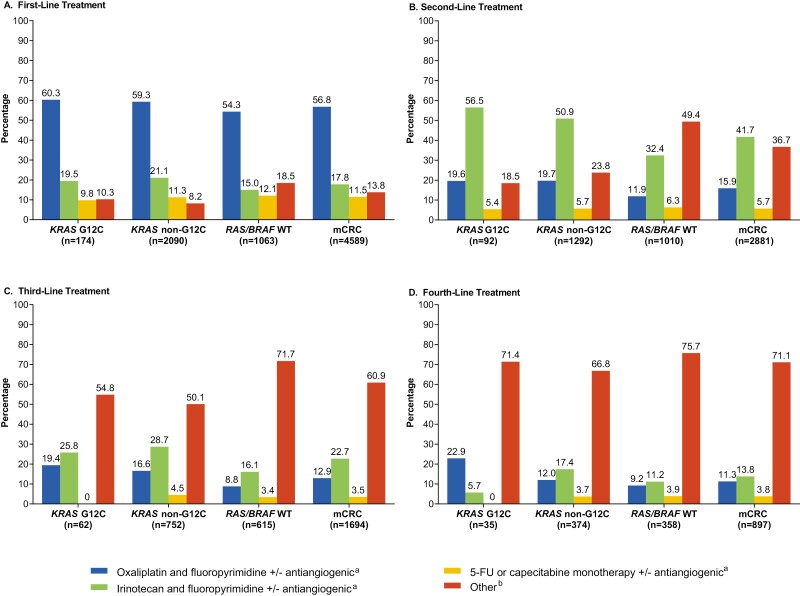
Treatment patterns were generally comparable across LOTs for mCRC cohorts, with the exception that more patients received a range of “Other” regimens for second LOT in the overall mCRC cohort and in the RAS/BRAF WT cohort compared with the other cohorts (Fig. 1). The “Other” regimens included oxaliplatin and fluoropyrimidine and cetuximab or panitumumab; irinotecan and fluoropyrimidine and cetuximab or panitumumab; irinotecan and oxaliplatin with or without an antiangiogenic agent; irinotecan monotherapy with or without an antiangiogenic agent; irinotecan monotherapy and cetuximab or panitumumab; oxaliplatin and irinotecan and fluoropyrimidine with or without an antiangiogenic agent; trifluridine and tipiracil; regorafenib monotherapy; immune checkpoint inhibitor(s) only. Oxaliplatin/irinotecan-based regimens were common first and second LOTs, as were antiangiogenic agents (Supplementary Fig. S1). “Other” regimens were more common for third and fourth LOTs.
Figure 1.
Treatment Patterns During (A) First, (B) Second, (C) Third, and (D) Fourth Lines of Therapy. BRAF, B-Raf proto oncogene; FU, fluorouracil; KRAS, Kirsten rat sarcoma viral oncogene homolog; KRAS G12C, KRAS p.G12C-mutant mCRC cohort; KRAS non-G12C, mCRC cohort including KRAS mutants other than KRAS p.G12C; mCRC, metastatic colorectal cancer; RAS, rat sarcoma viral oncogene homolog; WT, wild-type. aAntiangiogenic agents described here are either bevacizumab, ramucirumab, and/or ziv-aflibercept. b“Other” includes oxaliplatin and fluoropyrimidine and (cetuximab or panitumumab); irinotecan and fluoropyrimidine and (cetuximab or panitumumab); irinotecan and oxaliplatin +/− antiangiogenic agent; irinotecan monotherapy +/− antiangiogenic agent; irinotecan monotherapy and (cetuximab or panitumumab); oxaliplatin and irinotecan and fluoropyrimidine +/− antiangiogenic agent; trifluridine and tipiracil; regorafenib monotherapy; immune checkpoint inhibitor(s).
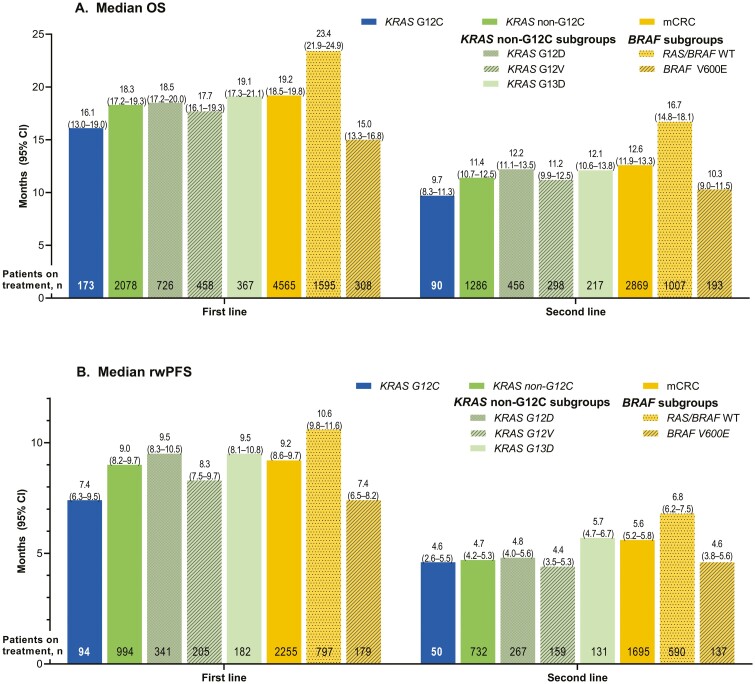
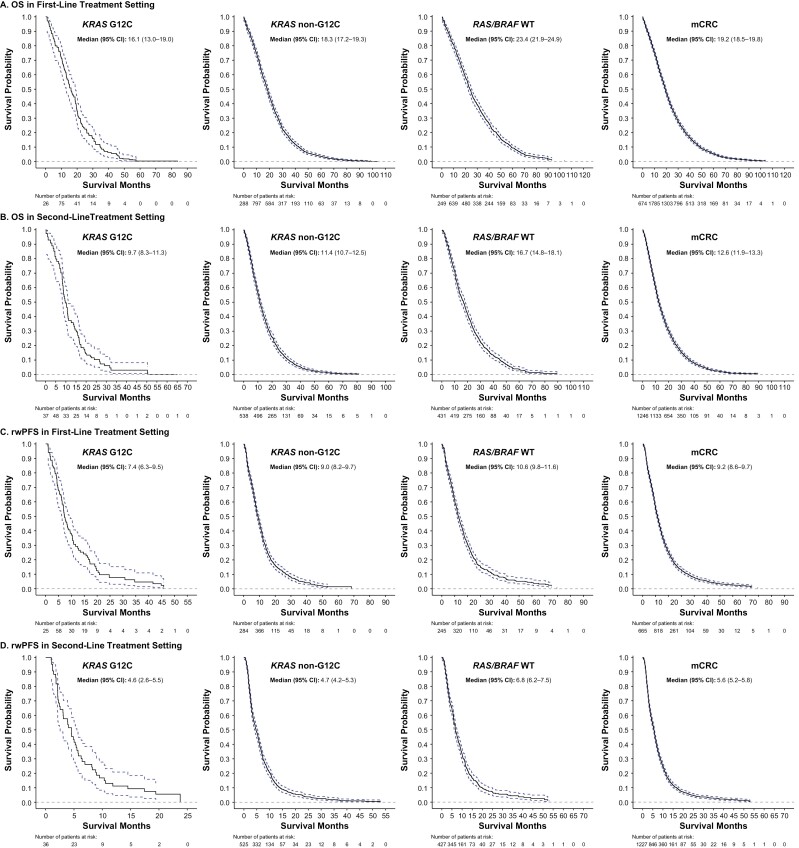
In the KRAS G12C cohort, median (95% CI) OS was 16.1 (13.0-19.0), 9.7 (8.3-11.3), 7.2 (4.8-8.6), and 5.2 (3.5-6.5) months after first, second, third, and fourth LOT, respectively (Fig. 2A; Supplementary Fig. 2A). Numerically shorter median OS was observed for the KRAS G12C cohort compared with the other cohorts across the first LOT (KRAS G12C: 16.1 [13.0-19.0] months; KRAS non-G12C: 18.3 [17.2-19.3] months; RAS/BRAF WT: 23.4 [21.9-24.9] months; mCRC: 19.2 [18.5-19.8] months) and all other LOTs (Figs. 2A, 3). In contrast, the median OS for the KRAS G12C cohort was similar to that for the BRAF V600E subgroup across all LOTs. Among the most common KRAS non-p.G12C mutations, median OS after the first LOT was similar across subgroups: KRAS G12D: 18.5 (17.2-20.0) months; KRAS G12V: 17.7 (16.1-19.3) months; KRAS G13D: 19.1 (17.3-21.1) months, and all were numerically longer than the OS observed for the KRAS G12C cohort after the first LOT. This difference was replicated across all lines of treatment. The only KRAS non-G12C subgroup with a numerically shorter OS than KRAS G12C had KRAS p.G12R mutation (OS after first LOT: 8.0 [5.2-11.8], but the sample size was small with only 20 patients.
Figure 2.
Median (A) OS and (B) rwPFS among patients in the KRAS G12C, KRAS non-G12C (including major subgroups), and overall mCRC (including the RAS/BRAF WT and BRAF V600E mutant subgroups) cohorts in first-line and second-line settings. BRAF, B-Raf proto oncogene; KRAS, Kirsten rat sarcoma viral oncogene homolog; KRAS G12C, KRAS p.G12C-mutant mCRC cohort; KRAS G12D, KRAS p.G12D-mutant mCRC subgroup; KRAS G12V, KRAS p.G12V-mutant mCRC subgroup; KRAS G13C, KRAS p.G13C-mutant mCRC subgroup; KRAS non-G12C, mCRC cohort including KRAS mutants other than KRAS p.G12C; mCRC, metastatic colorectal cancer; OS, overall survival; RAS, rat sarcoma viral oncogene homolog; rwPFS, real-world progression-free survival; WT, wild-type.
Figure 3.
Overall survival (OSa) and real-world progression-free survival (rwPFS) in first-line and second-line settings. aOS is measured from the start of the line of therapy to death or censored at last activity date in the FH/FMI networks. 95% CIs are based on estimated variance for log-log transformation of the Kaplan-Meier survival estimate. BRAF, B-Raf proto oncogene; FH, Flatiron Health; FMI, Foundation Medicine; KRAS, Kirsten rat sarcoma viral oncogene homolog; KRAS G12C, KRAS p.G12C-mutant mCRC cohort; KRAS non-G12C, mCRC cohort including KRAS mutants other than KRAS p.G12C; mCRC, metastatic colorectal cancer; OS, overall survival; RAS, rat sarcoma viral oncogene homolog; rwPFS, real-world progression-free survival; WT, wild-type.
The median (95% CI) rwPFS in the KRAS G12C cohort was 7.4 (6.3-9.5), 4.6 (2.6-5.5), 2.1 (1.7-4.1), and 3.0 (1.9-4.3) months after the first, second, third, and fourth LOT, respectively (Fig. 2B, Supplementary Fig. 2B). Numerically shorter median rwPFS was observed for the KRAS G12C cohort for the first LOT than for the other cohorts (KRAS G12C: 7.4 [6.3-9.5] months; KRAS non-G12C: 9.0 [8.2-9.7] months; RAS/BRAF WT: 10.6 [9.8-11.6] months; mCRC: 9.2 [8.6-9.7] months), which tended to be replicated across second and third LOTs (Fig. 2B; Supplementary Fig. 2B). In contrast, the median rwPFS for the KRAS G12C cohort was similar to that for the BRAF V600E subgroup across all LOTs. Among the most common KRAS non-p.G12C mutations, median rwPFS after the first LOT was similar across cohorts: KRAS G12D: 9.5 (8.3-10.5) months; KRAS G12V: 8.3 (7.5-9.7) months; KRAS G13D: 9.5 (8.1-10.8) months, and all numerically longer than the rwPFS observed for the KRAS G12C cohort after the first LOT.
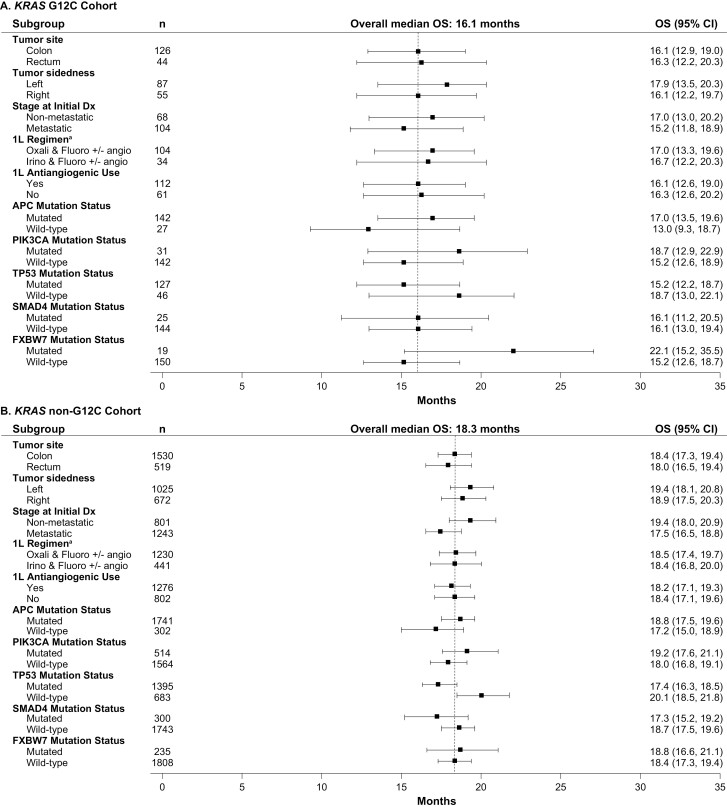
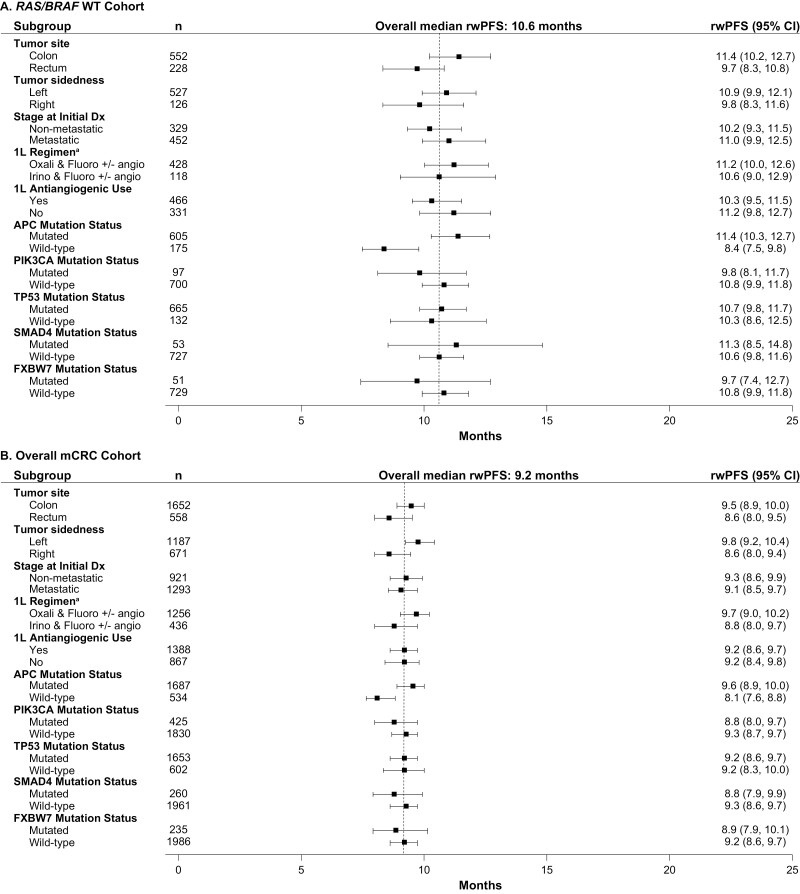
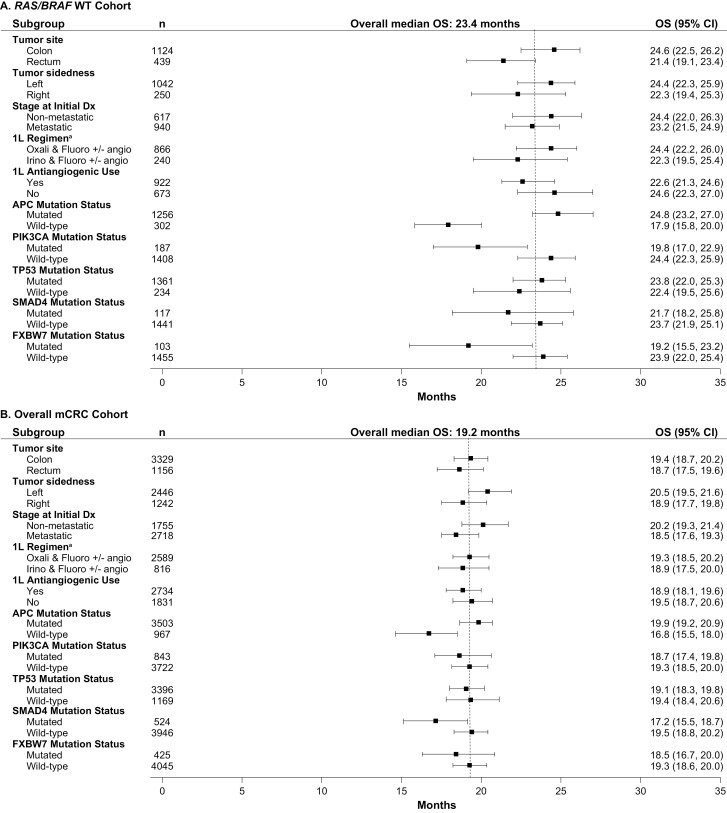
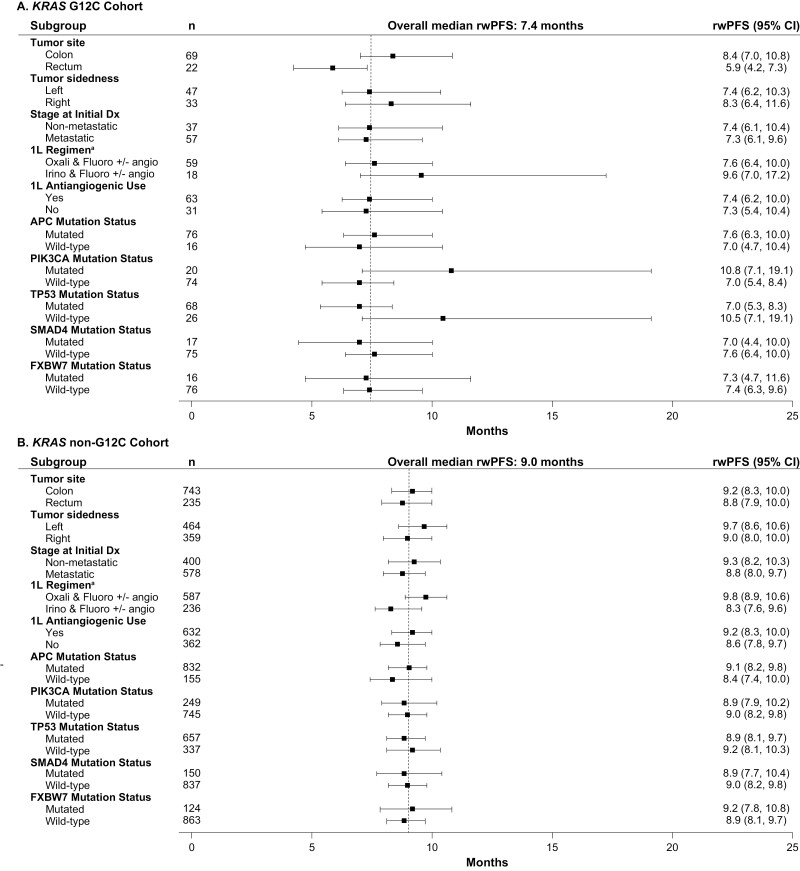
When analyses were undertaken across subgroups taking into account potential prognostic factors, outcomes were generally consistent across subgroups after first LOTs, although APC wild-type was associated with shorter OS (Figs. 4-7). In the KRAS G12C cohort, left tumor sidedness was associated with a slightly longer median OS than right tumor sidedness after the first LOT (17.9 [13.5-20.3] months vs. 16.1 [13.0-19.0] months); this finding was replicated across the other cohorts.
Figure 4.
Median OS after first-line treatment among subgroups in the (A) KRAS G12C, (B) KRAS Non-G12C Cohorts. - - - - Indicates overall median OS for first line of treatment. a1L regimen only includes the listed chemotherapy doublets; other regimens (eg, chemotherapy triples or chemotherapy doubles with anti-EGFR) are not included. 1L, first line of treatment; BRAF, B-Raf proto oncogene; Dx, diagnosis; KRAS, Kirsten rat sarcoma viral oncogene homolog; KRAS G12C, KRAS p.G12C-mutant mCRC cohort; KRAS non-G12C, mCRC cohort including KRAS mutants other than KRAS p.G12C; mCRC, metastatic colorectal cancer; OS, overall survival; RAS, rat sarcoma viral oncogene homolog; RAS/BRAF WT, RAS/BRAF WT mCRC cohort; WT, wild-type.
Figure 7.
Median rwPFS after first-line treatment among subgroups in the (A) RAS/BRAF WT, and (B) overall mCRC cohorts. - - - - Indicates overall median rwPFS for first line of treatment. a1L regimen only includes the listed chemotherapy doublets; other regimens (eg, chemotherapy triples or chemotherapy doubles with anti-EGFR) are not included. 1L, first line of treatment; BRAF, B-Raf proto oncogene; Dx, diagnosis; KRAS, Kirsten rat sarcoma viral oncogene homolog; KRAS G12C, KRAS p.G12C-mutant mCRC cohort; KRAS non-G12C, mCRC cohort including KRAS mutants other than KRAS p.G12C; mCRC, metastatic colorectal cancer; RAS, rat sarcoma viral oncogene homolog; RAS/BRAF WT, RAS/BRAF WT mCRC cohort; rwPFS, real-world progression-free survival; WT, wild-type.
Figure 5.
Median OS after first-line treatment among subgroups in the (A) RAS/BRAF WT and (B) Overall mCRC Cohorts. - - - - Indicates overall median OS for first line of treatment. a1L regimen only includes the listed chemotherapy doublets; other regimens (eg, chemotherapy triples or chemotherapy doubles with anti-EGFR) are not included. 1L, first line of treatment; BRAF, B-Raf proto oncogene; Dx, diagnosis; KRAS, Kirsten rat sarcoma viral oncogene homolog; KRAS G12C, KRAS p.G12C-mutant mCRC cohort; KRAS non-G12C, mCRC cohort including KRAS mutants other than KRAS p.G12C; mCRC, metastatic colorectal cancer; OS, overall survival; RAS, rat sarcoma viral oncogene homolog; RAS/BRAF WT, RAS/BRAF WT mCRC cohort; WT, wild-type.
Figure 6.
Median rwPFS after first-line treatment among subgroups in the (A) KRAS G12C, (B) KRAS Non-G12C cohorts. - - - - Indicates overall median rwPFS for first line of treatment. a1L regimen only includes the listed chemotherapy doublets; other regimens (eg, chemotherapy triples or chemotherapy doubles with anti-EGFR) are not included. 1L, first line of treatment; BRAF, B-Raf proto oncogene; Dx, diagnosis; KRAS, Kirsten rat sarcoma viral oncogene homolog; KRAS G12C, KRAS p.G12C-mutant mCRC cohort; KRAS non-G12C, mCRC cohort including KRAS mutants other than KRAS p.G12C; mCRC, metastatic colorectal cancer; RAS, rat sarcoma viral oncogene homolog; RAS/BRAF WT, RAS/BRAF WT mCRC cohort; rwPFS, real-world progression-free survival; WT, wild-type.
Discussion
This is the largest retrospective study to date to provide real-world evidence comprehensively characterizing and contextualizing the natural disease history of mCRC patients with KRAS p.G12C mutations and other KRAS mutations. The data are representative of mCRC disease treatment in the US community oncology setting. The proportion of patients with KRAS mutations, and the KRAS p.G12C mutation specifically, were similar to previous US reports (~37% and ~3%, respectively). As previously described, KRAS p.G12C mutations infrequently co-occurred with other targetable mutations (eg, 1.7% had co-occurring BRAF mutations).14,15APC and TP53 mutations were high in all cohorts; co-mutations with KRAS p.G12C in this study were similar to those reported previously with APC (~85% vs. ~54%-80%, respectively) and higher than those reported for TP53 (~75% vs. ~40%-58%).14,16 The proportion of patients with dMMR/MSI-H in our population was low and comparable to another study.7
In CRC, KRAS mutations have previously been associated with poorer outcomes compared with nonmutated tumors; the KRAS p.G12C mutation, in particular, is associated with poorer prognosis than other KRAS mutations.4-7 A pooled analysis of five randomized trials in patients with mCRC receiving first-line therapy found that PFS and OS were significantly shorter in patients with KRAS mutations than in those with wild-type disease (PFS, 9.5 [8.9-10.1] months for KRAS mutation vs. 10.3 [9.7-10.8] months for wild-type disease; OS, 21.0 [18.5-23.5] months vs. 26.9 [25.2-28.5] months, respectively). In this pooled analysis among the different KRAS mutations, KRAS p.G12C and KRAS p.G13D mutations were associated with the worst OS (16.8 [15.6-18.0] months and 17.6 [13.3-21.9] months, respectively).4 In US patients with mCRC, excluding those who had undergone metastasectomy, OS was significantly shorter for the 65 patients with KRAS p.G12C mutant mCRC than for those 720 patients with KRAS non-p.G12C mutations (21.2 months vs. 31.6 months; P = .003).5 Results were similar from an Italian cohort of 839 patients (KRAS p.G12C mutant [n = 145], 28.9 months vs. KRAS non-p.G12C [n = 694], 36.7 months, P = .009)7 and a Japanese cohort of 45 patients with KRAS p.G12C and 651 patients with KRAS non-p.G12C mutant mCRC (median OS: 21.1 vs. 27.3 months; P = .015).17 These findings were supported by the results of our real-world analysis, with the KRAS p.G12C mutation showing numerically shorter OS and rwPFS for all LOTs than tumors without KRAS non-p.G12C mutations, and showing poorer outcomes than the most common KRAS non-p.G12C mutations including KRAS p.G12D, KRAS p.G12V, and KRAS p.G13D mutations; as expected, OS and rwPFS worsened for all cohorts after each LOT. Our findings could be explained by the metabolic differences observed among patients with different KRAS mutations, including KRAS p.G12C; it has been suggested that these metabolic factors may be the biological basis for patients with different KRAS mutations having differing responses to anticancer treatment.18 In addition, the KRAS p.G12C mutation is associated with the development of treatment resistance.19 RAS/BRAF WT patients had better outcomes, as might be expected for patients eligible for EGFR-antibody therapy; while patients with BRAF V600E mutations had similar outcomes to patients with KRAS p.G12C mutations across all LOTs. A lower OS was observed in patients with wild-type APC across all cohorts; similar results demonstrating the poorer outcomes in patients with wild-type APC have been reported previously.20 Given the poor outcomes observed in this study, and that treatment of mCRC is typically palliative rather than curative, additional treatment options are urgently required for patients progressing on standard treatments. This need is more pressing in patients with KRAS p.G12C-mutated mCRC because they appear to have worse prognoses than those without this mutation, they are ineligible for EGFR-antibody therapy,21 and few are eligible for immunotherapy, which is only indicated for dMMR/MSI-H tumors (ie, 1.6% in KRAS p.G12C-mutated mCRC).
Limitations
The median age of our population (60 years for the overall mCRC cohort) is slightly younger than that reported by others (~65 years),4,17 possibly reflective of ~90% of patients coming from community settings and the increasing incidence of CRC in younger adults and declining incidence in older adults.22 The percentage of Black patients identified in the FH-FMI clinical-genomic database is also slightly lower than would be expected based on the underlying risk of CRC in the US population.23 This may reflect underlying disparities in diagnosis and treatment of mCRC in the Black population,24,25 possibly reflecting the known differences in access to care in the Black versus the non-Black population. Furthermore, the database does not include information such as the proportion of patients who had metastasectomy. Nonetheless, the large sample size enables trends to be identified and reported. Finally, results may not be generalizable to all patients with mCRC, specifically those outside the US and treated at academic centers, or those who did not undergo genomic sequencing or were sequenced by different methodologies. However, the results are reflective of a sizable real-world population.11 Because rwPFS differs from PFS captured in clinical trials, outcomes from this study may not be comparable to those from clinical trials.
Conclusion
This study characterized and contextualized the natural disease history of patients with mCRC in a real-world setting to improve the understanding of KRAS p.G12C mutation-positive mCRC. These patients appear to have poor treatment outcomes that are worse than those in patients without this mutation or in patients with KRAS non-p.G12C mutations, suggesting prognostic implications and an unmet medical need in this population.
Supplementary Material
Acknowledgments
The authors thank the Amgen and Flatiron Health teams for their work in this study. Furthermore, the authors would like to express their gratitude to the patients who made this study possible. Finally, the authors thank Erin P. O’Keefe, PhD, and Lee B. Hohaia, PharmD (ICON, Blue Bell, PA), whose work was funded by Amgen Inc. for medical writing assistance in the preparation of this manuscript.
Contributor Information
Marwan Fakih, City of Hope Comprehensive Cancer Center, Duarte, CA, USA.
Huakang Tu, Amgen Inc., Thousand Oaks, CA, USA.
Hil Hsu, Amgen Inc., Thousand Oaks, CA, USA.
Shivani Aggarwal, Amgen Inc., Thousand Oaks, CA, USA.
Emily Chan, Amgen Inc., Thousand Oaks, CA, USA.
Marko Rehn, Amgen Inc., Thousand Oaks, CA, USA.
Victoria Chia, Amgen Inc., Thousand Oaks, CA, USA.
Scott Kopetz, The University of Texas MD Anderson Cancer Center, Houston, TX, USA.
Funding
The study was sponsored and funded by Amgen Inc. The decision to submit for publication was the decision of the authors.
Conflict of Interest
Marwan Fakih: Amgen (H), Amgen, TaiHO, Bayer, Array, Pfizer, Seattle Genetics, GlaxoSmithKline, Zhuhai Biotech, and Incyte (C/A), Novartis, Amgen, and AstraZeneca (RF—inst), Guardant (Other—Speakers’ Bureau); Huakang Tu, Hil Hsu, Shivani Aggarwal, Emily Chan, Marko Rehn, Victoria Chia: Amgen Inc. (E, OI); Scott Kopetz: MolecularMatch, Navire, Lutris, and Iylon (OI), Genentech, EMD Serono, Merck, Holy Stone, Novartis, Lilly, Boehringer Ingelheim, Boston Medical, AstraZeneca/MedImmune, Bayer Health, Pierre Fabre, EMD Serono, Redx Pharma, Ipsen, Daiichi Sankyo, Natera, HalioDx, Lutris, Jacobio, Pfizer, Repare Therapeutics, Inivata, GlaxoSmithKline, Jazz Pharmaceuticals, Iylon, Xilis, AbbVie, Amal Therapeutics, Gilead Sciences, Mirati Therapeutics, Flame Biosciences, Servier, Carina Biotechnology, Bicara Therapeutics (C/A), Sanofi, Biocartis, Guardant Health, Array BioPharma, Genentech/Roche, EMD Serono, MedImmune, Novartis, Amgen, Lilly, and Daiichi Sankyo (RF—inst.)
(C/A) Consulting/advisory relationship; (RF) Research funding; (E) Employment; (ET) Expert testimony; (H) Honoraria received; (OI) Ownership interests; (IP) Intellectual property rights/inventor/patent holder; (SAB) Scientific advisory board.
Author Contributions
Conception/Design: H.T., H.H., S.A., E.C., M.R., V.C. Data analysis and interpretation: M.F., H.T., H.H., S.A., E.C., M.R., V.C., S.K. Manuscript writing: M.F., H.T., H.H., S.A., E.C., M.R., V.C., S.K. Final approval of manuscript: M.F., H.T., H.H., S.A., E.C., M.R., V.C., S.K.
Data Availability
The data that support the findings of this study originated from Flatiron Health, Inc. and Foundation Medicine, Inc. These de-identified data may be made available upon request, and are subject to a license agreement with Flatiron Health and Foundation Medicine; interested researchers should contact cgdb-fmi@flatiron.com to determine licensing terms.
References
- 1. National Cancer Institute. SEER cancer stat facts: colorectal cancer. https://seer.cancer.gov/statfacts/html/colorect.html. Accessed May 26, 2021.
- 2. National Comprehensive Cancer Network. Clinical Practice Guidelines in Oncology (NCCN Guidelines): Colon Cancer (Version 3.2021). National Comprehensive Cancer Network; 2021. Accessed September 29, 2021. https://www.nccn.org/professionals/physician_gls/pdf/colon.pdf. [DOI] [PubMed] [Google Scholar]
- 3. Nassar AH, Adib E, Kwiatkowski DJ.. Distribution of KRASG12C somatic mutations across race, sex, and cancer type. N Engl J Med. 2021;384(2):185-187. doi: 10.1056/NEJMc2030638. [DOI] [PubMed] [Google Scholar]
- 4. Modest DP, Ricard I, Heinemann V, et al. Outcome according to KRAS-, NRAS- and BRAF-mutation as well as KRAS mutation variants: pooled analysis of five randomized trials in metastatic colorectal cancer by the AIO colorectal cancer study group. Ann Oncol. 2016;27(9):1746-1753. 10.1093/annonc/mdw261. [DOI] [PMC free article] [PubMed] [Google Scholar]
- 5. Henry JT, Coker O, Chowdhury S.. Comprehensive clinical and molecular characterization of KRASG12C-mutant colorectal cancer. JCO Precis Oncol. 2021;5:613-621. [DOI] [PMC free article] [PubMed] [Google Scholar]
- 6. Jones RP, Sutton PA, Evans JP, et al. Specific mutations in KRAS codon 12 are associated with worse overall survival in patients with advanced and recurrent colorectal cancer. Br J Cancer. 2017;116:923-929. 10.1038/bjc.2017.37. [DOI] [PMC free article] [PubMed] [Google Scholar]
- 7. Schirripa M, Nappo F, Cremolini C, et al. KRAS G12C metastatic colorectal cancer: specific features of a new emerging target population. Clin Colorectal Cancer. 2020;19(3):219-225. 10.1016/j.clcc.2020.04.009. [DOI] [PubMed] [Google Scholar]
- 8. Agarwala V, Khozin S, Singal G, et al. Real-world evidence in support of precision medicine: clinico-genomic cancer data as a case study. Health Aff (Millwood) 2018;37(5):765-772. 10.1377/hlthaff.2017.1579. [DOI] [PubMed] [Google Scholar]
- 9. Griffith SD, Miksad RA, Calkins G, et al. Characterizing the feasibility and performance of real-world tumor progression end points and their association with overall survival in a large advanced non–small-cell lung cancer data set. JCO Clin Cancer Inform. 2019;1:13. [DOI] [PMC free article] [PubMed] [Google Scholar]
- 10. Birnbaum B, Nussbaum N, Seidl-Rathkopf Ket al. Model-assisted cohort selection with bias analysis for generating large-scale cohorts from the EHR for oncology research. 2020. Accessed February 18, 2021. https://arxiv.org/ftp/arxiv/papers/2001/2001.09765.pdf.
- 11. Singal G, Miller PG, Agarwala V, et al. Association of patient characteristics and tumor genomics with clinical outcomes among patients with non-small cell lung cancer using a clinicogenomic database. JAMA 2019;321(14):1391-1399. 10.1001/jama.2019.3241. [DOI] [PMC free article] [PubMed] [Google Scholar]
- 12. Frampton GM, Fichtenholtz A, Otto GA, et al. Development and validation of a clinical cancer genomic profiling test based on massively parallel DNA sequencing. Nat Biotechnol. 2013;31(11):1023-1031. 10.1038/nbt.2696. [DOI] [PMC free article] [PubMed] [Google Scholar]
- 13. Zhang Q, Gossai A, Monroe S, et al. Validation analysis of a composite real-world mortality endpoint for patients with cancer in the United States. Health Serv Res. 2021;56(6):1281-1287. 10.1111/1475-6773.13669. [DOI] [PMC free article] [PubMed] [Google Scholar]
- 14. Timar J, Kashofer K.. Molecular epidemiology and diagnostics of KRAS mutations in human cancer. Cancer Metastasis Rev. 2020;39:1029-1038. 10.1007/s10555-020-09915-5. [DOI] [PMC free article] [PubMed] [Google Scholar]
- 15. Araujo LH, Souza BM, Leite LR, et al. Molecular profile of KRAS G12C-mutant colorectal and non-small-cell lung cancer. BMC Cancer 2021;21:193. 10.1186/s12885-021-07884-8. [DOI] [PMC free article] [PubMed] [Google Scholar]
- 16. Nusrat M, Roszik J, Holla V, et al. Therapeutic vulnerabilities among KRAS G12C mutant (mut) advanced cancers based on co-alteration (co-alt) patterns. J Clin Oncol. 2020;38(15_suppl.):3625-3625. [Google Scholar]
- 17. Chida K, Kotani D, Masuishi T, et al. The prognostic impact of KRAS G12C mutation in patients with metastatic colorectal cancer: a multicenter retrospective observational study. Oncologist 2021;26(10):845-853. 10.1002/onco.13870. [DOI] [PMC free article] [PubMed] [Google Scholar]
- 18. Varshavi D, Varshavi D, McCarthy N, et al. Metabolic characterization of colorectal cancer cells harbouring different KRAS mutations in codon 12, 13, 61 and 146 using human SW48 isogenic cell lines. Metabolomics 2020;16:51. 10.1007/s11306-020-01674-2. [DOI] [PMC free article] [PubMed] [Google Scholar]
- 19. Liu J, Kang R, Tang D.. The KRAS-G12C inhibitor: activity and resistance. Cancer Gene Ther. 2021; 10.1038/s41417-021-00383-9. [DOI] [PubMed] [Google Scholar]
- 20. Wang C, Ouyang C, Cho M, et al. Wild-type APC is associated with poor survival in metastatic microsatellite stable colorectal cancer. Oncologist 2021;26(3):208-214. 10.1002/onco.13607. [DOI] [PMC free article] [PubMed] [Google Scholar]
- 21. Benson AB, Venook AP, Al-Hawary MM, et al. Colon cancer, version 2.2021, NCCN clinical practice guidelines in oncology. J Natl Compr Canc Netw. 2021;19(3):329-359. 10.6004/jnccn.2021.0012. [DOI] [PubMed] [Google Scholar]
- 22. Bailey CE, Hu CY, You YN, et al. Increasing disparities in the age-related incidences of colon and rectal cancers in the United States, 1975-2010. JAMA Surg. 2015;150(1):17-22. 10.1001/jamasurg.2014.1756. [DOI] [PMC free article] [PubMed] [Google Scholar]
- 23. American Cancer Society. Cancer Facts & Figures for African Americans 2019-2021. Atlanta, GA, USA: American Cancer Society; 2019. [Google Scholar]
- 24. Dimou A, Syrigos KN, Saif MW.. Disparities in colorectal cancer in African-Americans vs Whites: before and after diagnosis. World J Gastroenterol. 2009;15(30):3734-3743. 10.3748/wjg.15.3734. [DOI] [PMC free article] [PubMed] [Google Scholar]
- 25. Iwuki K, Hyde B, Uke N.. Colorectal cancer disparities and African Americans: Is it time to narrow the gap? Southwest Respir Crit Care Chron. 2021;9(40):27-30. [Google Scholar]
Associated Data
This section collects any data citations, data availability statements, or supplementary materials included in this article.
Supplementary Materials
Data Availability Statement
The data that support the findings of this study originated from Flatiron Health, Inc. and Foundation Medicine, Inc. These de-identified data may be made available upon request, and are subject to a license agreement with Flatiron Health and Foundation Medicine; interested researchers should contact cgdb-fmi@flatiron.com to determine licensing terms.


