

Summary
Hadal ocean biosphere, that is, the deepest part of the world’s oceans, harbors a unique microbial community, suggesting a potential uncovered co-occurring virioplankton assemblage. Herein, we reveal the unique virioplankton assemblages of the Challenger Deep, comprising 95,813 non-redundant viral contigs from the surface to the hadal zone. Almost all of the dominant viral contigs in the hadal zone were unclassified, potentially related to Alteromonadales and Oceanospirillales. 2,586 viral auxiliary metabolic genes from 132 different KEGG orthologous groups were mainly related to the carbon, nitrogen, sulfur, and arsenic metabolism. Lysogenic viral production and integrase genes were augmented in the hadal zone, suggesting the prevalence of viral lysogenic life strategy. Abundant rve genes in the hadal zone, which function as transposase in the caudoviruses, further suggest the prevalence of viral-mediated horizontal gene transfer. This study provides fundamental insights into the virioplankton assemblages of the hadal zone, reinforcing the necessity of incorporating virioplankton into the hadal biogeochemical cycles.
Subject areas: Aquatic science, Oceanography, Biological sciences, Genomics
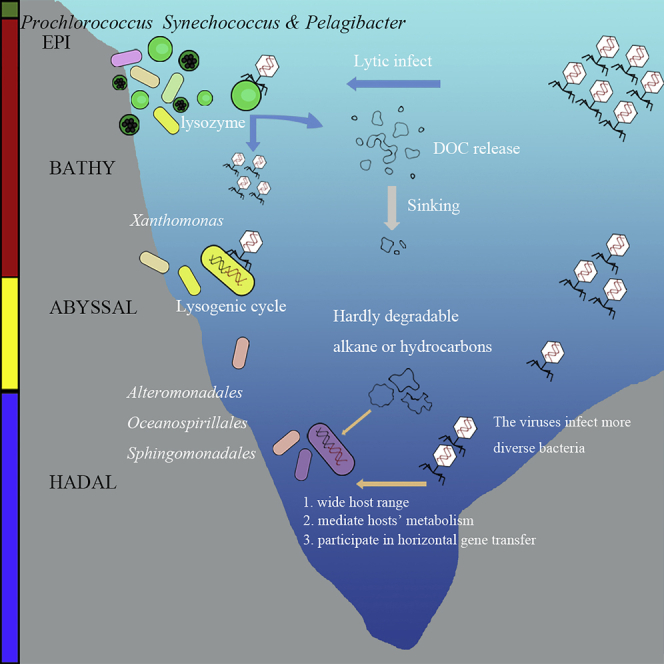
Graphical abstract
Highlights
-
•
The unique virioplankton assemblages of the Challenger Deep were revealed
-
•
Virus encoded auxiliary metabolic genes relating to the biogeochemical cycling
-
•
Viruses in deep and hadal zone tend to be lysogenic, and potentially mediate the horizontal gene transfer
Aquatic science; Oceanography; Biological sciences; Genomics
Introduction
“Hadal zones,” which are comprised almost entirely of deep ocean trenches, are the least-explored aquatic biosphere on Earth. Recently, the prokaryotic and eukaryotic communities of hadal zones in the Mariana (Guo et al., 2018; Liu et al., 2019; Nunoura et al., 2015; Tian et al., 2018; Xu et al., 2018), Puerto Rico (Eloe et al., 2011), Japan (Nunoura et al., 2016), Yap (Zhang et al., 2018) and Kermadec Trenches (Peoples et al., 2018) were investigated using deep-sea sampling and high-throughput sequencing techniques. The species composition and function of the microbial communities were found to be significantly different from those in the epi-, meso- and bathy-pelagic zones (Guo et al., 2018; Liang et al., 2019; Liu et al., 2019; Nunoura et al., 2015; Tian et al., 2018; Xu et al., 2018). The Challenger Deep in the Mariana Trench (MT) is the deepest part of the world’s oceans, and its geology, current patterns, water chemistry, and benthic microbial communities have been relatively well studied (Glud et al., 2013; Guo et al., 2018; Liu et al., 2019; Nunoura et al., 2015; Taira et al., 2004; Tian et al., 2018; Xu et al., 2018; Yoshida et al., 2013). The Challenger Deep is geographically isolated in the deep-sea environments and locates in a tectonically active area in the Western Pacific Ocean. The V-shaped topography of the trench and the frequent earthquakes induce the collection of significant amounts of suspended particles from the upper water column and endogenous organic carbon from the steep and narrow sides, which fuel the unique hadal microbial community (Nunoura et al., 2015; Taira et al., 2004, 2005). Hydrocarbon-degrading bacteria within the Oceanospirillales order, comprised more than 40% of the abundance of 16S rRNA genes, and the Alteromonadales order and ammonia-oxidizing Thaumarchaeota, have been reported to be the most dominant prokaryotic microbes in the hadal zone of MT (Liu et al., 2019; Zheng et al., 2020; Zhong et al., 2020).
Viruses are the most abundant and diverse “biological entities” in the oceans. They affect trophic energy flow, influence the microbial community structure, mediate horizontal gene transfer and drive biogeochemical cycles (Suttle, 2005; Zimmerman et al., 2020). Viral lysis is estimated to kill between 20 and 40% of marine bacteria daily and in surface waters “shunts” between 6 and 26% of the photosynthetically fixed carbon to the dissolved organic matter pool (Suttle, 2007; Wilhelm and Suttle, 1999); thus, viruses are major players in the flux of organic carbon in the sea (Suttle, 2005). Viral lysis may also contribute to the sequestration of CO2 by the “pump and shuttle” (Suttle, 2007), in which, recalcitrant dissolved organic carbon (RDOM) is formed when the products of viral lysis enter the “microbial carbon pump” (Jiao et al., 2010) or by enhancing the aggregation and sinking of organic carbon via the “viral shuttle” (Guidi et al., 2016; Jiao et al., 2010). Viruses have two different life strategies: lytic and lysogenic. Until recently, viruses from surface waters were mostly thought to adopt a lytic life strategy, while those from deep-sea environments with low organic matter availability and low microbial abundance and activity, favored a lysogenic life strategy (Lara et al., 2017; Silveira and Rohwer, 2016). The lysogenic life strategy might be a preferable survival strategy and a better adaptation to extreme and energy-deficient deep-sea environments (Luo et al., 2017a; Mizuno et al., 2016; Williamson et al., 2008). However, our understanding of viral life in deep water is still largely unexplored. Hence, understanding ecological and biogeochemical processes in the abyssalpelagic and hadal oceans will require an understanding of the viruses that inhabit them.
The significance of viruses in marine biogeochemical cycles and the composition of the viral community at a genome level has only been explored by using metagenomics and high-throughput sequencing recently (Angly et al., 2006; Breitbart et al., 2002; Paez-Espino et al., 2016; Roux et al., 2016). Several large-scale studies, including the Global Ocean Sampling Expedition, Pacific Ocean Virome (POV), and Global Ocean Viromes 2.0 (GOV2.0), which include viromes from Tara Ocean, Malaspina, and Tara Oceans Polar Circle (TOPC) expeditions, have significantly expanded the understanding of viral community composition in the epipelagic zone (0–200 m) (Brum et al., 2015; Gregory et al., 2019; Hurwitz and Sullivan, 2013; Paez-Espino et al., 2016; Roux et al., 2016; Williamson et al., 2012). Of these, 145 viromes from the epi-, meso- (200–1000 m), and bathy-pelagic zones (1000–4000 m) in GOV2.0 were successfully investigated using metagenomic analyses (Gregory et al., 2019; Mizuno et al., 2016), identifying a total of 195,728 viral populations and defining five ecological zones: (1) Arctic, (2) Antarctic, (3) temperate and tropical epipelagic, (4) mesopelagic and (5) bathypelagic (Gregory et al., 2019). However, data from abyssalpelagic (4000–6000 m) and hadal zones (below 6000 m) remain relatively rare. Recently, based on 12 publicly available microbial metagenomes, 6,011 intracellular viruses representing the bacterioplankton size fraction were reported from the waters overlying the hadal zone of Challenger Deep and Yap Trench [35]. These suggested the presence of a unique hadal intracellular viral community structure and a higher proportion of lysogenic life strategies in the hadal zone compared with the upper ocean (Jian et al., 2021). However, owing to the challenges associated with virioplankton sampling and cultivation of viruses from hadal zones, our understanding of the roles of extracellular virioplankton remains largely uncharacterized, which was proved significantly different from the intracellular viruses in the peat and oceans (López-Pérez et al., 2017; Luo et al., 2020; Ter Horst et al., 2021).
The aim of this study was to characterize the diversity, distribution, life strategy, and putative hosts of virioplankton assemblages from the surface to the hadal zone and to explore their potential functions in the hadal ecosystem. To this end, seven extracellular virioplankton metagenomes collected from the surface to the hadal zones were analyzed to examine the community structure, diversity, putative hosts, life strategy, and auxiliary metabolic genes (AMGs). Our findings have revealed the diversity and life strategies of the extracellular virioplankton assemblages and have identified their potential roles in hadal microbial ecology and biogeochemistry.
Results
Community structure and vertical distribution of virioplankton overlaying Challenger Deep
The data used to characterize virioplankton overlaying Challenger Deep (VOCDs) were derived from 86.27 Gb of sequencing data across seven samples collected between 2 and 8,727 m below the surface (Figures 1A and 1B). A total of 95,813 non-redundant viral contigs were identified. Of these, 5,938 viral contigs (VCs) were identified from hadal seawaters. 139 circular VCs were identified, and 167 VCs were classified as high-quality genomes (Figure 1C).
Figure 1.

Basic description of the virioplankton overlaying Challenger Deep in the Mariana Trench (VOCDs)
(A) The location of the Mariana Trench (Challenger Deep is at 142.3。E, 11.37。N).
(B) Depths of samples collection.
(C) The statistical (sequence length and relative abundance) composition of the viral metagenomes. Complete and high-quality genomes are indicated.
(D) Predicted host domain of MT viral contigs.
(E) Pie charts showing the relative proportion of viral contigs that could be assigned to a family.
Most VCs (70.43%) could not be assigned to a family (Figure 1E). 29.39% were classified into 236 viral taxa (species level), including 26.24% of the total VCs from metagenomic assembled genomes (MAGs) of the uncultured viruses (UV, named as uvDeep or uvMed) from the Mediterranean Sea metagenomes (Mizuno et al., 2016). Furthermore, the 50 most abundant VCs were all unclassified viral taxa, 47 of which were assembled from the deep sea and hadal zones (Figure 2A). The phylogenetic tree of the terminase large subunit (terL) from 242 VCs also indicated little homology of the viruses from the Mariana Trench (MT) with known viruses (Figure 2B). And, a total of 22,518 VCs (23.50% of the total VCs) were taxonomically assigned as 6,005 Viral Operational Taxonomic Units (vOTUs) according to the IMG/VR 2.0 database (Paez-Espino et al., 2019). There were 4,610 vOTUs from the epipelagic zone, of which 4,045 were not shared with vOTUs from other depths (Figure S1B). In contrast, of the 557 vOTUs in the hadal zone, 247 only occurred in this zone, illustrating the unique viral communities in the hadal zone (Figure S1B).
Figure 2.

Distribution of most abundant viruses found in the virioplankton overlaying Challenger Deep in the Mariana Trench (VOCDs) and their relationship with environmental factors and dominant bacteria
(A) Heatmap of the top 50 most abundant viral contigs (24 were assembled from the hadal samples). The relative abundance (%) equaled TPM which was normalized by the contig length and mapped reads for samples.
(B) The maximum-likelihood phylogenetic tree of terL gene of all uv-MTs. The color of inner clade represents different homology clades. The color of the viral name shows the assembled layer of the uv-MTs sequences. The color of the outside circular ring indicates the viral families. All viral clades with bootstrap value > 0.9 are indicated by dark-grey nodes. Six homology groups were formed, and there were all the uv-MTs from VOCDs in group 2. The tree scale showed the evolutional distance.
(C) Canonical correspondence analysis of the relationship between the relative abundance of viral populations and environmental factors. The size of the circle represents the relative abundance of viral populations in each virome sample. Depth and PO43− might be the key factors to have influenced the diversity of VOCDs.
(D and E) Gene-sharing network between hosts and viruses of VOCDs except EPI-2m. The color of nodes indicated the ecological zones in figure (D), while in figure (E), it indicated the hosts order and viruses.
Of the classified VCs, uvDeep and uvMED (61.37 and 14.76%, respectively) were ubiquitous and dominant (Figure S1A). 99.80% of classified VCs were double-stranded DNA (dsDNA) phages within the order Caudovirales, with 81.81% being assigned to Siphoviridae, 15.62% to Myoviridae, and 2.38% to Podoviridae (Figure 1E). Only 3,015 VCs (about 3% of total VCs) were affiliated with cultured viruses, mainly those infecting Prochlorococcus, Synechococcus, Pelagibacter (SAR11 clade), Xanthomonas and Puniceispirillum (SAR116 clade) (Figure S1A). In the hadal zone (7200 and 8727 m), the homologous sequence of Sphingomonas phage Scott was the most abundant cultured VC, although it only comprised 0.46% of the total relative abundance of viral contigs (Figure S2A).
Vertically, the proportion of unclassified viruses in the abyssalpelagic and hadal zones of MT (>90%) was higher than that in the epipelagic samples (>70%) (Figure S1C). The Shannon index of virioplankton diversity also fluctuated across zones, with the highest values in the epipelagic (7.73) and hadal (5.94) zones, and the lowest value in the abyssalpelagic zone (1.73) (Table S1). The relative abundance of the most abundant VCs and classified viral species decreased from the surface to the abyssalpelagic zone and slightly increased in the hadal zone (Figures 2A and S1A).
The vertical distribution of viral abundance and environmental factors (Figures 4B and S3A) was similar to a previous study (11–22.25′N, 142–42.75′E) overlying the Challenger Deep (Nunoura et al., 2015). The first and second CCA axes explained 56.2 and 10.0% of the variation in the viral communities, respectively, with the variation being most influenced by depth (R2 = 0.39, p < 0.05) and PO43− (R2 = 0.27, p < 0.05) (Figure 2C).
Figure 4.

Gene co-occurrence network, abundance, and productions of viruses in the Mariana Trench
(A) The co-occurrence network of viral functional genes of the virome at 8727 m in the Mariana Trench. The size of the node represents the degree, which reflected one gene’s co-occurrence frequency, and the node color represents the relative abundance of each functional gene in the virome sample.
(B) Vertical distribution of prokaryotic abundance, viral abundance, ratio of viruses and prokaryotes (VPR).
(C) Lytic, lysogenic, and total viral production and the lysogenic proportion at the Mariana Trench.
Comparison between virioplankton overlaying Challenger Deep and published datasets
Virioplankton assemblages in the bathy-, abyssal-pelagic and hadal zones were clustered into a single group close to the BATHY VEZ, defined in the GOV2.0 dataset, and bathypelagic viromes from the South China Sea (Figure 3A); this is similar to the results of the Principal Co-ordinate analysis (PCoA) (Figure 3B) and non-metric multidimensional scaling (NMDS) analyses (Figure S5A). The samples from the hadal zone were clearly distinct from the other five VEZs (Figures 3B and S5A). Moreover, the viral sequences of VOCDs were also comparable to the viral sequences predicted from the microbial metagenome data of the Marina and Yap Trenches. The number of VOCD viral sequences was almost an order of magnitude greater than that in the microbial metagenomes (Jian et al., 2021), reinforced the higher vOTU recovery from viromes than from total microbial metagenomes (Ter Horst et al., 2021). The virioplankton assemblages in this study and viral sequences from microbial metagenomes tended to group together, respectively (Figure S5B).
Figure 3.

Comparative analysis of virioplankton overlaying Challenger Deep (VOCDs) in the Mariana Trench and other viromes and recruitment of most abundant assembled viral genomes from them
(A) Heatmap of the nucleotide frequency of VOCDs and other viromes.
(B) PCoA of the five known VEZs plus VOCDs. Each triangle represents one virome sample. The colors of triangles represent the virome sample from different VEZs. Because EPI-2m was quite different from VOCDs in deep water, the orange color was only used for this sample. VOCDs included the virome samples deeper than 1000 m below surface.
(C) Relative abundance of assembled viruses and Pelagibacter phage HTVC010P in different VEZs.
(D) Read recruitment plot of three abundant assembled viral genomic fragments and Pelagibacter phage HTVC010P.
ANT, Antarctic; ARC, Arctic; EPI, temperate and tropical epipelagic; MESO, temperate and tropical mesopelagic; BATHY, temperate and tropical bathypelagic; VOCD, the virioplankton overlaying Challenger Deep in the Mariana Trench; UV, uncultured virus; ABYSSAL, abyssalpelagic zone.
Genomes and putative hosts of abundant and unclassified viruses in the Mariana Trench
Three assembled uncultured viruses (uv-BATHY-MT-4 (complete), uv-HADAL-MT-1 (Genome fragment), and uv-ABYSSAL-MT-1 (complete)) from VOCDs appear to be more abundant in MT than the Pelagibacter phage HTVC010P, which has been reported as one of the most abundant cultured marine viruses to date (Figure 3D) (Mizuno et al., 2016; Zhao et al., 2013). Twenty-five uncultured viruses were only recruited from VOCDs and were not identified in the other viromes of the GOV2.0 dataset. The phylogenetic tree of the terL gene clustered five novel viral groups from VOCDs and showed the novelty of the viruses from MT (Figure 2B).
The putative hosts of the VCs were determined. A total of 36,371 VCs were assigned to viruses that infect bacteria, 522 were assigned to viruses that infect eukaryotes, and only four were assigned to viruses that infect archaea (Figure 1D). As bacteria were the predominant putative hosts of VCs in VOCDs and Alteromonadales (mainly Alteromonas genus) and Oceanospirillales (mainly Oleibacter genus) were the dominant bacterial populations comprising more than 80% of the classified bacterial communities in the hadal zone (Liu et al., 2019), the potential VCs infecting Alteromonadales and Oceanospirillales were predicted (Figures 2D, 2E, and S4A). In total, 676 VCs were predicted to infect bacteria in the Oceanospirillales (mainly in the genera, Oleibacter and Katobacter), and of those, 391 were from hadal samples (Figure S4B). Moreover, VCs in the bathypelagic and hadal zones were connected with more bacterial genomes than those in the epipelagic zone (Figure S4C).
Viral-encoded auxiliary metabolic genes mediating the metabolism of hosts in Mariana Trench
A total of 487,396 viral CDS were identified from the total 95,813 viral contigs. A total of 2,586 viral AMGs were annotated and classified into 132 different KEGG orthologous groups. AMGs participating in cysteine and methionine metabolism (KEGG: map00270) were abundant in all samples, such as DNA (cytosine-5)-methyltransferase 1 (DNMT1), S-adenosylmethionine synthetase (metK), spermidine synthase (speE), adenosylhomocysteine nucleosidase (mtnN), 1-aminocyclopropane-1-carboxylate deaminase (E3.5.99.7), cysteine synthase (cysK), DNA (cytosine-5)-methyltransferase 3A (DNMT3A) (Figure 6A). The gene photosystem II P680 reaction center D1 protein (psbA) was detected in 138 VCs in the surface sample. For the abundant sulfur metabolism-related AMGs, the phosphoadenosine phosphosulfate reductase (CysH) gene was found in four VCs from HADAL-8727m, while dissimilatory sulfite reductase alpha subunit (dsrA), methanesulfonate monooxygenase subunit alpha (msmA), and cytochrome subunit of sulfide dehydrogenase (fccA) were only found in EPI-2m. The [CysO sulfur-carrier protein]-S-L-cysteine hydrolase (mec) gene, which is involved in the sulfur relay system, had a high percentage of counts in all samples, while molybdopterin-synthase adenylyltransferase (moeB) gene, belonging to sulfur carrier protein This adenylyltransferase (thiF) family, was more prevalent in surface water. The most interesting discovery was that N-Glycan biosynthesis-related AMGs (beta-1,4-mannosyl-glycoprotein beta-1,4-N-acetylglucosaminyltransferase (MGAT3) and carbohydrate 4-sulfotransferase 9 (CHST9)) were more frequently found in deep and hadal oceans. Carbohydrate metabolism correlated-AMGs were the most abundant (314 counts) at the surface, while they were uncommon in hadal zones. For nitrogen metabolism, only two AMGs, glutamine synthetase (glnA) and glutamate dehydrogenase (GDH2) were discovered respectively in EPI-2m and BATHY-1000m. The arsenate reductase (ArsC) gene, however, was common in VOCDs from deeper waters (Figure 6C). Moreover, one antibiotic-related gene (prnA, gene encoding tryptophan halogenase, the first step of pyrrolnitrin biosynthesis) was found in HADAL-8727m.
Figure 6.

Counts of each AMGs discovered in different VOCDs
(A) the counts of the AMGs in each KEGG pathway module detected by VIBRANT.
(B) the counts of the AMGs detected by VIBRANT.
(C) Counts of viral AMGs by manual search through Pfam and COG annotation.
Life strategies of viral assemblages
In the virome samples from the deep sea and hadal zones, Phage_integrase was the hub gene (Figure 4A), while in the surface sample, “DnaB_C″ domain (Pfam: PF03796) was used as a hub gene in the network (Figure S6). The vertical distribution of functional genes showed that the proportion of Phage_integrase significantly increased with depth (Figures 5A and 5B) Additionally, uv-BATHY-MT-4, the most abundant assembled viral genome from the Mariana Trench (Figure 3C), contained a CDS of phage integrase (Figure S2B). These results suggest that viruses might prefer a lysogenic life strategy in the deep sea and hadal zones.
Figure 5.

Distribution and phylogenetic analysis of functional genes of the virioplankton overlaying Challenger Deep (VOCDs) in the Mariana Trench
(A) top-30 genes in VOCDs from different depths. Abundance proportion (%) represents the proportion of the relative abundance of each gene to the number of mapped reads in each virome sample.
(B). The abundance distribution of different Pfam families (rve, Pfam: PF00665 and rve_3, Pfam: PF13683) of integrase core domain, Phage_integrase, and RVT genes in VOCDs. x axis is the abundance ratio of marker genes. Abundance proportion (%) represents the proportion of the relative abundance of each gene to the number of mapped reads in each virome sample.
(C) The maximum-likelihood phylogenetic tree of the rve gene (core domain of retroviral integrase, PF00665). The color of the inner clade represents different homology clades. The color of viral name shows the viral family of rve sequences. The color of outside circular ring indicates the protein families. All viral clades with bootstrap value > 0.9 are indicated by orange nodes. The tree scale showed the evolutional distance.
The distribution of viral abundance and lysogenic and lytic viral production with depth is shown in Figures 4B and 4C. The abundance of viruses decreased from 1.83 × 10⁶ virus-like particles (VLP)/mL at the surface to 0.26 × 10⁶ VLP/mL in the BATHY-1000m sample. The abundance of viruses was lowest at 0.13 × 10⁶ VLP/mL in the bathypelagic samples and then it slightly increased to 0.29 × 10⁶ VLP/mL in the HADAL-8727m sample (Figure 4B). The vertical distribution of lytic viral production was similar to the viral abundance and decreased from 4.26 × 10⁵ VLP/mL/h at the surface to 0.46 × 10⁵ VLP/mL/h in the HADAL-8727m sample (Figure 4C). However, the vertical pattern of lysogenic viral production was different and varied from 1.77 × 10⁵ VLP/mL/h at the surface to 5.26✕105 VLP/mL/h in the BATHY-1759m sample (Figure 4C). The proportion of lysogenic viral production to the total viral production (The sum of lytic and lysogenic viral productions) in bathy-to hadal-zones (30.85–55.56%) was significantly higher than at the surface (4.05%) (Figure 4C).
Higher proportion of the rve gene relating to the horizontal gene transfer in the deep sea and hadal zones
Interestingly, another important gene—rve (Integrase core domain, Pfam: PF00665) was abundant at bathypelagic, abyssalpelagic, and hadal depths. (Figures 5A and 5B). The rve family is the core domain in both the retroviral integrase of retroviruses and the transposase of non-retroviruses (mainly caudoviruses) (Braid et al., 2004; Fogg et al., 2011; Kaneko et al., 1997; Pourcel et al., 2016; Ulycznyj et al., 1995). The phylogenetic tree of rve genes shows that most of the rve genes in VOCDs were clustered with the transposases in the cultured caudoviruses and had little homology with reported retroviral integrase genes from retroviruses (Figure 5C). Furthermore, the pn/ps = 0.65, which was less than 1, demonstrates that rve was conserved in VOCDs (except EPI-2m) and evolving under purifying selection which implies that the deleterious mutations were eliminated to selectively retain the function of rve (DePristo et al., 2011; Simmons et al., 2008).
Discussion
Virioplankton overlaying Challenger Deep contain unique viral assemblages distinct from those reported in the ocean viromes
This study shows undiscovered virioplankton assemblages from the Challenger Deep, (Figures 1E, 2A, and S1), especially from the abyssalpelagic and hadal zones, which are poorly represented in the current deep ocean virome datasets (Figures 3A, 3B, and S5B) (Roux et al., 2016). Furthermore, the Mariana Trench virioplankton assemblages contained viral populations that were distinct from other microbial metagenomes (Figure S5B), which is consistent with results from the epipelagic zone and soil samples (López-Pérez et al., 2017; Luo et al., 2020; Santos-Medellin et al., 2021), indicating that microbial metagenomes were only the complement methods for the virioplankton studies. And, the distribution of virioplankton in MT is unique based on the relative abundance and recruitment of the abundant viral MAGs of VOCDs (Figures 3C and 3D).
Although the reasons why the virioplankton assemblages in the deep sea and hadal zones overlying Challenger Deep are so different, are not fully understood and several possible reasons include: 1) As viruses require host cells to replicate, the viral community structure is influenced by the host populations’ ability to adapt to environmental conditions (Brum and Sullivan, 2015). The Challenger Deep is located in an oligotrophic ocean, geographically isolated from other western Pacific Ocean deep-sea trenches, such as the Japan Trench, which is located in the eutrophic northwest Pacific Ocean. Different distribution patterns of microbial communities have been observed in the deep sea and hadal zones of Japan and Mariana Trenches (Nunoura et al., 2015, 2016). For example, potential chemolithotrophic populations (SAR324 and MGI Thaumarchaeota) dominated in the meso- to abyssal-pelagic zones in the Mariana Trench, whereas potential heterotrophic populations (Bacteroidetes and “Ca. Marinimicrobia” (SAR406)) were abundant from the bathypelagic zone to hadal zone in the Japan Trench. In hadal waters, Nitrospira was more abundant in the Japan Trench than in the Challenger Deep, dominating the nitrite-oxidizing bacterial populations of the Japan Trench (Nunoura et al., 2015, 2016). Thus, the different microbial community structures in the Challenger Deep might structure the viral assemblage in the deep sea and hadal zones; (2) The unusual funnel-shaped morphology of the trenches not only enhances the accumulation of sinking organic matter from the sea surface (Luo et al., 2017b) but also possibly introduces terrestrial organic matter sources (Angly et al., 2006), facilitating lateral transportation from trench rims and slopes. The accumulation of organic matter, such as hydrocarbons, promotes the predominance of hydrocarbon-degrading bacteria in the order Oceanospirillales (accounting for >50% of classified bacteria) in the hadal zone of Challenger Deep (Liu et al., 2019) and induces the growth of associated viruses infecting the hydrocarbon-degrading bacteria (Figures 2D, 2E and S4). The accumulation of organic matter in the hadal zone (Glud et al., 2013) may be the reason for the higher microbial and viral biodiversity and abundance in the hadal zone than that in the abyssalpelagic zone, which also induced the bimodal vertical distribution of water chemistry and community composition of the Challenger Deep (Figures S3A and 4B). This bimodal pattern is similar to the previous study in the Mariana Trench (Nunoura et al., 2015); 3) The extremely high pressure might also influence the microbial communities in the abyssalpelagic and hadal zones (Guo et al., 2018; Liu et al., 2019; Nunoura et al., 2015) and indirectly influence the viral assemblages in these extreme environments. Previous analyses of microbial abundance in the Mariana Trench have shown robust distribution patterns with depth (Liu et al., 2019; Nunoura et al., 2015, 2016; Xu et al., 2018). Some marine bacteria were able to produce dimethylsulfoniopropionate to protect themselves against the high hydrostatic pressures that exist in the hadal trenches (Zheng et al., 2020). The high pressure, low temperature, and low light levels in hadal zones likely decrease viral decay rates and increase their persistence (De Corte et al., 2011; Liang et al., 2017). Variations in VOCDs were significantly correlated with depth (Figure 2C), which is consistent with the results from the GOV 2.0 dataset (Gregory et al., 2019). As depth was the most important factor structuring the five VEZs and their virus and hosts interactions (Gregory et al., 2019), the extremely high pressure (depth) in the hadal zone was probably responsible for much of the differences between the hadal viromes in MT and the other five VEZs; 4). In addition, although viruses from shallower waters might be directly exported to the deep oceans via sinking organic matter (Guidi et al., 2016; Kaneko et al., 2020), the extreme water depth might reduce the direct and indirect exportation from the shallower waters and expand the differences between the hadal zone and the overlying shallower waters. Undoubtedly, the community structure of microorganisms could potentially structure the viral assemblage in the deep sea and hadal zone overlying Challenger Deep. This study reinforces the notion that global marine viral assemblages are under-sampled, especially from hadal zones overlying trench environments, and shows the unique composition of VOCDs relative to other oceanic viromes (Figures 3A, 3B, and S5).
High levels of lysogeny and potential horizontal gene transfer in Mariana Trench
The life strategy of viruses in the abyssalpelagic and hadal zones remains an enigma, though viral studies of the deep sea show evidence of the prevalence of lysogenic viral life strategies in the bathypelagic zone, based on an analysis of the vertical distribution of lytic and lysogenic viral production and marker genes of lysogenic infection (for example, integrases and excisionases) through the metagenomic analysis of deep sea samples (Coutinho et al., 2017; Labonte et al., 2015; Luo et al., 2017a; Mizuno et al., 2016; Weinbauer et al., 2003; Williamson et al., 2008). A conceptual model of viral life strategies throughout the oceans based on a phage co-occurrence network and host prediction of metagenomic assembled viral contigs has been proposed (Coutinho et al., 2017). Both Pelagiphages and Cyanophages, which prefer a lytic life strategy, comprise the most abundant viral populations in the euphotic zone, while in the cold aphotic zone, viruses infecting heterotrophic bacteria, which prefer a lysogenic life strategy, are most abundant (Coutinho et al., 2017). In this study, the life strategies of viruses in the abyssalpelagic and hadal zones were analyzed, based on similar methods (Shapiro et al., 2018). The vertical distribution of lytic and lysogenic viral production shows that lysogenic viral production takes over from lytic viral production in the abyssalpelagic and hadal zone, suggesting the prevalence of a lysogenic viral life strategy in this extreme environment (Figures 4A and 4C). Consistent with the distribution of viral production, the proportion of Phage_integrase, an enzyme that participates in lysogenic recombination mediating sequence recombination between phages and their hosts, and a prominent marker gene for temperate phages (Groth and Calos, 2004; Kwon et al., 1997), was more abundant in the abyssalpelagic and hadal zones than at the surface of MT (Figures 5A and 5B). In addition, gene co-occurrence networks of viral functional genes might also reflect the possible life strategies of viruses at different depths from another perspective (Coutinho et al., 2017; Liu et al., 2020; Shapiro et al., 2018). Phage_integrase was the hub gene for VOCDs in the deep sea and hadal zone overlying the Mariana Trench (Figures 4A and S6). These results all suggest that viruses might prefer a lysogenic life strategy to adapt to a labile nutrient-poor hadal environment with low host abundance. It is in accordance with the higher proportion of lysogenic microbial OTUs and proviruses in the hadal seawater microbial metagenomes (average 41.75%) than that in the epi- (average 22.92%) and abyssal-pelagic (average 30.58%) zones (Jian et al., 2021).
Interestingly, another important gene—rve (Integrase core domain, Pfam: PF00665), which is a core domain of integrase, was very abundant in the bathy-, abyssal-pelagic and hadal zones (Figures 5A and 5B). The rve family are contained in both the retroviral integrase and transposase (Braid et al., 2004; El-Gebali et al., 2019; Fogg et al., 2011; Kaneko et al., 1997; Pourcel et al., 2016; Ulycznyj et al., 1995). The phylogenetic tree of rve genes shows that most of the rve genes in VOCDs were unique and had little homology with reported integrase genes from retroviruses (Figure 5C). The rve genes of non-retroviruses (mainly caudoviruses) function as transposases, which could mediate the horizontal gene transfer (Braid et al., 2004; Cuecas et al., 2017; Fogg et al., 2011; Garcia-Vallvé et al., 2000; Kaneko et al., 1997; Pourcel et al., 2016; Ulycznyj et al., 1995). Transposases, key elements involved in genomic DNA rearrangements, were used to detect and analyze horizontal gene transfer events that influenced microbial evolution and genome plasticity (Cuecas et al., 2017; Qu et al., 2008; Sansevere and Robinson, 2017). Recently, Tycheposons, a new site-specific transposon were found in, containing streamlined genomes with frequent gene exchange and highly enriched in the extracellular vesicles and phage particles in the ocean (Hackl et al., 2020). Hence, it is proposed that the abundant rve genes in the deep sea and hadal zone overlying Challenger Deep might mediate the horizontal gene transfer to adapt to this extreme environment. The above results suggest that the viruses from deep sea and hadal zones not only prefer a lysogenic life strategy but might also play an unexpected role in horizontal gene transfer between viruses and their hosts through the transposase-like genes.
Proposed roles of viruses from the surface to the hadal zone overlying the Mariana Trench
Viruses infecting eutrophic bacterial groups, including Prochlorococcus, Synechococcus, and Pelagibacter are abundant and favor a lytic infection life cycle in surface waters (Figures 4C and S1A) (Coutinho et al., 2017; Lara et al., 2017). As depth increases, light becomes unavailable and the temperature, concentration of organic carbon, and primary productivity all decrease, leading to lower bacterial growth rates (De Corte et al., 2010). Viruses tend to prefer a lysogenic life strategy to adapt to the high pressure and oligotrophic conditions, although the precise reasons are not fully understood (Mizuno et al., 2016). Viruses mediated the metabolism of bacteria using AMGs. Viruses on the surface mainly mediated the carbon metabolism. While viruses in deep and hadal zones flexibly encoded N-linked Glycan synthesis gene, ABC transporters, and CysH gene to mediate the metabolism of hosts to adapt to the extreme environment (Figure 6B). N-Glycan biosynthesis is prevalent in eukaryotes (Kelly et al., 2006), while the function, structure, and genetic information of N-linked glycosylation in bacteria and archaea remains unveiled. The ABC transporters, an important virulence factors in the bacterial genome, participate in the nutrient uptake, secretion of toxins, and antimicrobial agents (Davidson and Chen, 2004). CysH gene is proposed to involve in the assimilatory sulfate reduction, detected in VCs from the hypoxia water columns (Mara et al., 2020), cold seep sediments (Li et al., 2021), and sulfidic mine tailings (Gao et al., 2020), and suggested to promote the biosynthesis of amino acids and aid the capacity of nitrogen fixation in the cold seep microbial populations (Dekas et al., 2009; Li et al., 2021). Except participating in the energy metabolism, viruses also encode unique antibiotic gene (PrnA) and virulence factors for bacterial immune reaction (Figures 6B and 6C). In addition, viruses in deep and hadal zones might be involved in the arsenic-related biological process (Figure 6), which was recently detected in the metagenomic assembled microbial genomes and proposed to relate to the biotransformation of arsenate for energy gain in the hadal sediments (Zhou et al., 2022). Comprehensive, viruses might influence the hadal microbial community structure and metabolism through the expression of AMG relating to antibiotic biosynthesis and nutrient metabolism to elevate the microbial adaption to the extreme environment in the hadal oceans (Figure 6).
In the hadal zones, the enhanced accumulation of hydrocarbon promotes the abundance of hydrocarbon-degrading bacteria of the order Oceanospirillales (Liu et al., 2019). The number of viruses infecting bacteria in the orders Oceanospirillales and Sphingomonadales increases (Figures 2D and 2E). In addition, the potential VCs infecting another abundant bacterial class, Alteromonadales, were also abundant in the deep sea and hadal zone of MT (Figures 2D and 2E), suggesting a tight coupling between viruses and host cells. Furthermore, the gene-sharing network between viruses and bacteria and the vertical distribution of total and average bacterial genomes connected to viruses, suggests that viruses in hadal zones have a wider host range (Figures 2D, 2E, 6, and S5). This is in accordance with the characteristic of Siphoviruses to have a wide host range (Suttle, 2005). Here, it is predicted that viruses in hadal zones will also have a wider host range, preferring a lysogenic life strategy and facilitating horizontal gene transfer by transposase-like genes to adapt to extreme environments (Hackl et al., 2020).
Limitations of the study
Viral databases have continued to develop for decades. IMG/VR 2.0 was presented for cultured and uncultured viruses (Paez-Espino et al., 2019), and NCBI viral genome Refseq database was updated frequently. Consequently, this study combined the viral identification results from Virsorter, CAT, and Virfinder to overcome the shortcomings in viral taxonomy and metagenomics (Ren et al., 2017; Roux et al., 2015; von Meijenfeldt et al., 2019). Additionally, it might not fully annotate the viral sequences and affiliate viruses with putative hosts as the tools and databases are primarily targeted for the phage (Paez-Espino et al., 2019). Owing to insufficient DNA for sequencing and the immaturity of low-input library preparation for the high-throughput sequencing, MDA amplification was applied in this study. Though MDA can sufficiently increase the amount of viral DNA for metagenomic analyses, it showed bias in preferentially amplifying genomes of ssDNA, extreme GC, and an uneven coverage (Thoendel et al., 2017). Fortunately, the major findings of our study, including unique viral assemblages, AMGs, and viral-host linkage, will only have been slightly influenced by the known bias of the MDA method, as there were few ssDNA viruses identified in VOCDs. In addition, several signatures also suggested a minor bias from the MDA in this study, including: (1). In this study, we used the proven best choice for the MDA kit to minimize the bias from the background contaminating DNA, the Qiagen REPLI-g kit (Thoendel et al., 2017); (2) Only a limited impact on the beta diversity of human saliva viromes induced by MDA bias has been reported (Parras-Moltó et al., 2018), hence MDA might have a smaller than expected impact on the beta diversity comparisons between VOCDs and GOV2.0 dataset; (3) As the main MDA bias is the over-amplification of the circular ssDNA viruses (Jin et al., 2019), and as there were few ssDNA viruses in the classified viral populations of VOCDs, then MDA amplification might only slightly impact VOCDs; (4) The strong similarity of nucleotide frequency between the deep sea and hadal zones of VOCDs and the deep sea viromes without amplification (BATHY viromes from GOV2.0 and South China Sea) suggests that there was only a slight influence on the nucleotide frequency of VOCDs from the MDA amplification. Though MDA amplification can be considered as a method for the study of viral communities, especially when the volume of samples is limited, the direct sequencing method without any amplification is still the first choice to study the actual viral community in the future, especially with the rapid technological progress of low-input library preparation for the high-throughput sequencing (such as NexteraXT and NebNext UltraII kits).
STAR★Methods
Key resources table
Resource availability
Lead contact
Further information and requests for resources and reagents should be directed to and will be fulfilled by the lead contact, Min Wang.
Materials availability
This study did not generate new unique reagents.
Method details
Sample collection
Seven virome samples collected for metagenomic analysis were collected from the sea surface to the hadal zone of the Challenger Deep (11。22′ N, 142。18′ E), Mariana Trench, during January, 2016 (Table S1). The deepest seawater sample was from 8727 m, which is the deepest hadalpelagic virome ever collected. 20–50 L seawater of each virome sample was collected with Niskin bottles mounted on a rosette, which held the SBE-9 plus CTD-sensors (SBE 911, Sea-Bird Electronics) for temperature, salinity, pH, dissolved oxygen (DO). Hundred milliliter sub-samples were collected from each sample for nutrient analysis (PO43−, SiO32−, NH4+, NO2−, and NO3−) using an onboard nutrient auto-analyzer (SKALAR SAN plus, Netherlands). The samples were sequentially filtered through a 20 μm mesh, a 3 μm and 0.22 μm pore size filters. The viruses in the filtrates were concentrated by a two-step tangential flow filtration (TFF) with 50-kDa cartridge (Millipore, MA, USA) to a final volume of about 50 mL and stored at −80°C until processed (Brussaard et al., 2004; Gong et al., 2018).
DNA extraction and sequencing
The viral concentrates were allowed to melt and then re-filtered through 0.22 μm pore size filters to remove the remaining cellular microorganisms, then precipitated using polyethylene glycol (PEG-8000) (10% w/v) and NaCl (0.6% w/v) followed by incubation at 4°C in the dark for 24 h. The samples were then centrifuged at 8,000 g for 80 min at 4°C and suspended in 200 μL SM buffer. Finally, DNA of each virome sample was extracted using the phenol/chloroform/isoamyl method and stored at −80°C until sequencing (Gong et al., 2018; Thurber et al., 2009). The viral DNA of each sample (100–200 ng DNA as a template) was amplified with QIAGEN R REPLI-g Mini Kit (phi-29 DNA polymerase), which used the whole genome multiple displacement amplification (MDA) method (Angly et al., 2006; Yilmaz et al., 2010). High-throughput sequencing of each sample was performed by Biozeron Biotechnology Co. Ltd (Shanghai, China) using Illumina Hiseq X ten platform (Paired End sequencing, 2 × 150 bp).
Quality control and assembly
Raw sequencing reads that contained adapters were removed with Cutadapt (v.1.14) using –max-n 0 –minimum-length 120 –pair-filter = both (Martin). Low quality reads (those which contained ≥30 bp for Phred score ≤20 and at least 45 bp for Phred score ≤30) were abandoned. Subsequently, virome assemblages, using IDBA_UD (v.1.1.2) (Peng et al., 2012) (with parameters --mink 40 --maxk 100 --no_local --step 10 --min_contig 500 --pre_correction), were performed to obtain high quality and long virus contigs. Clean reads were randomly subsampled for assembly to avoid the influence of micro-diversity. A subset of each sample was randomly selected to 1% of reads (repeated 75 times), 5% (50×), 10% (50×), 25% (25×), 75% (25×), and 100% (1×) (Coutinho et al., 2017). The repeat selection was aimed at avoiding decreasing biodiversity. This strategy reduces the confusion caused by highly similar genomes and balances the abundant and less abundant members’ assembly performance (de Cárcer et al., 2014). Contigs were later dereplicated by Blastn (v.2.7.1) (Camacho et al., 2009) with the identity >95%, e_value < 0.01, and a minimum alignment coverage of 80% of the shorter contig. Contigs shorter than 1 kb were removed. Reads were then mapped back to the contigs using Bowtie2 with default parameters for each sample (Langmead and Salzberg, 2012). Unmapped reads to the contigs were merged to implement the cross-sample assemblages with IDBA_UD (Peng et al., 2012). After assembly, a total of 536,853 contigs (longer than 1000 bp) were obtained, which recruited 59.5% of the reads (Table S3). The purpose of executing the cross-sample assemblages was to improve the utility of the reads and achieve more genome information from the less abundant viruses. Finally, contigs from each sample and cross-sample assembly (Gregory et al., 2019) were combined and removed from the replication.
Detection of viral contigs
Firstly, VirSorter (v.1.0.5) (Roux et al., 2015), a software package that uses a similarity based approach of HMM against known virus databases to find virus hallmark genes and to determine virus sequence, was applied with default parameters for the non-redundant contigs of each sample. Complementary, VirFinder (v.1.0.0) (Ren et al., 2017), a machine learning-based approach that uses k-mer frequency was also performed with default parameters. Contigs were classified as viral (i) the contigs sorted by Virsorter (categories 1 and 2), with VirFinder score >0.9 and p<0.05, (ii) contigs identified as viral by both VirSorter in categories 1-6 and VirFinder score >0.7 and p<0.05, and (iii) contigs detected as virus by CAT (v.4.5) (von Meijenfeldt et al., 2019) with –d 2019-01-08_CAT_database –t 2019-01-08_taxonomy, which utilizes last common ancestor (LCA) of conservative ORFs to determine the taxon. A total of 95,813 non-redundant viral contigs (VCs, 31,719 VCs ≥ 2,500 bp; 9,665 VCs ≥ 5,000 bp) were identified using multiple tools, such as VirSorter (Roux et al., 2015), VirFinder (Ren et al., 2017), and Contig Annotation Tool (CAT) (von Meijenfeldt et al., 2019). Circular contigs were identified by VirSorter (Roux et al., 2015).The quality of VCs were also assessed by CheckV with quality_summary program (Nayfach et al., 2021).
Taxonomy and abundance of viral contig
ORFs for contigs from each sample were predicted using Prodigal (v.2.6.3) (Hyatt et al., 2010) with default parameters. VCs were annotated to viral taxonomic classification based on the scores of last common ancestor of ORFs through CAT (v.4.5) (von Meijenfeldt et al., 2019). The classified VCs without family information were manually searched against the NCBI taxonomy website (https://www.ncbi.nlm.nih.gov/taxonomy/) to correct the taxonomic information. VCs were blasted against the IMG/VR 2.0 database (Paez-Espino et al., 2019) to identify the vOTUs. Contigs were designated as annotated to IMG/VR 2.0 when the alignment length was at least 60% of its length and the identity was greater than 85%. For each VOCD, reads were aligned to the VCs by Bowtie2 (Langmead and Salzberg, 2012), the mapped reads were selected by Samtools (Li et al., 2009), and the reads count of each VC was calculated. The relative abundance was normalized by the contig length (/kb), and the proportion was equal to normalization the relative abundance similar to Transcripts Per Kilobase Million (TPM).
Detection of ORFs
The viral proteins predicted by Prodigal using default parameter were blasted against the NCBI nr database using DIAMOND (v.0.9.24) (Buchfink et al., 2015), with default parameters. Pfamscan (El-Gebali et al., 2019) was applied by comparing viral ORFs to the PFAM domain database (e-value <0.01, score >30). An ORF was assigned to the gene that had the most significant sequence similarity (highest score value). The COG of the viral protein functional categories were identified by eggnog-mapper v2 (web version: http://eggnog-mapper.embl.de/) (Huerta-Cepas et al., 2016), using default parameters. Reads were mapped back to the viral ORFs with Bowtie2 (Langmead and Salzberg, 2012) with default parameters and reads count of each ORF was calculated using the mapped reads selected using Samtools (v.0.1.19) (Li et al., 2009). Finally, the relative abundance of genes was normalized by the gene’s length (/kb), and the proportion of relative abundance was computed as TPM. To further understand how viruses might affect the marine biogeochemistry of Challenger Deep, all viral contigs encoding AMGs were examined based on VIBRANT (v.1.2.1) (Kieft et al., 2020) annotations. And, the category of COG as “metabolism” was also chosen as the AMGs manually.
Virus–host prediction
VCs were blasted against the IMG/VR 2.0 database (Paez-Espino et al., 2019) to identify the host domain. Additionally, viral hosts were predicted by the gene sharing network for all of the microbial community. A gene sharing network of the bacterial community and viruses was constructed. As Oceanospirillales has been reported as the dominant bacterial population in the hadal zone of Mariana Trench, virus–host prediction of Oceanospirillales was also analyzed using the gene-sharing analysis between virus and hosts (Liu et al., 2019; Shapiro et al., 2018). Bacterial contigs assembled from the microbial metagenomes of the same expedition were identified using CAT (von Meijenfeldt et al., 2019). The bacterial ORFs were predicted using Prodigal (Hyatt et al., 2010). Pairwise Viral-Bacterial ORFs were blasted against each other, those with identity >95% and coverage>80% were considered homologous sequences The interaction between virus/bacteria was considered if they shared one or more homologous genes (Shapiro et al., 2018). The networks were visualized by Cytoscape (v.3.8.2) (Shannon et al., 2003) and Gephi (v.0.9.2) (Mathieu et al., 2009). The number of connected bacteria for each virus was counted, and the average was calculated as the total number of bacterial nodes to which viruses were connected divided by the total number of the viruses in each depth zone.
Gene co-occurrence network analysis
Viral genes predicted by Pfamscan, occurring in the same contig, were defined as an interaction. The node pairs of gene co-occurrence network were determined if two genes were detected in the same VCs (Shapiro et al., 2018). The edges of the co-occurrence network were weighted by the frequency of co-occurrence (Liu et al., 2020; Shapiro et al., 2018). Hub genes and average clustering coefficient were then identified using Gephi (Mathieu et al., 2009).
Virome comparison analysis
To avoid different assembly and batch affects, raw data from the five different GOV ecological zones were included (Table S2), including 10 epipelagic (EPI), 10 mesopelagic (MES), 10 Arctic (ARC), 5 Antarctic (ANT) from NCBI and 10 bathypelagic (BATHY) from JGI (Roux et al., 2016). 100,000 reads were randomly selected from each sample (Martín-Cuadrado et al., 2007) for tBLASTx (Camacho et al., 2009) (e-value<10−5). The scores of the top High Scoring Pairs (HSPs) of virome A against virome B were then summed (SAB). Ultimately, the similarity scores for each pair of viromes were normalized as the distance matrix (dis = 1-log(SAB)/log(SAA)) for performing PCoA and NMDS analysis using the Vegan R package (Dixon, 2003; Yang et al., 2019). Additionally, 10 viromes from epipelagic and bathypelagic South China Sea and 32 bathypelagic Pacific and Atlantic viromes were also downloaded for comparing (De Corte et al., 2019; Liang et al., 2019). The nucleotide frequency (including Dinucleotide frequency to Tetranucleotide frequency) of all the downloaded viromes and VOCDs was calculated and then the heatmap was drew by TBtools (v1.098696) (Chen et al., 2020) according to Euclidean distance. The VCs longer than 5 kb of VOCDs were compared with viral sequences of microbial metagenome using vContact2 (Bin Jang et al., 2019).
Correlation calculation
Canonical correspondence analysis (CCA) was used to investigate the relationships between viral community structure and environmental factors. Canonical correspondence analysis was implemented using CANOCO 5 (Lepš and Šmilauer, 2003), which utilized the abundance of vOTUs and environmental factors to calculate the correlation between viral diversity and environmental factors. Biodiversity of VOCDs were measured by the Shannon index (computed with Vegan (Dixon, 2003), from the R package). In addition, the correlation (Pearson correlation) between environmental factors and dominant classified species was calculated and illustrated by R package “ggcor” (Huang et al., 2020).
Phylogenetic tree construction
All viral rve genes (core domain of retroviral integrase, PF00665) from Pfam database were downloaded. The maximum-likelihood phylogenetic tree of rve and terL gene from Pfam database and VOCDs was built. Multiple alignment was conducted using CLUSTALW (Thompson et al., 1994). PHYLIP (Shimada and Nishida, 2017) was then undertaken for bootstrap resampling, setting a bootstrap value of 1000. Finally, maximum-likelihood phylogenetic trees were conducted by FastTree2 (Price et al., 2010) using JTT model. The trees were visualized using the interactive Tree of Live (iToL) tool (https://itol.embl.de/) (Letunic and Bork, 2007).
Unique uncultured viruses from VOCDs and its comparison of viral genomes
An all-vs-all pairwise BLASTn (Camacho et al., 2009) analysis of the uncultured viruses which contained 139 circular VCs and 103 VCs longer than 36 kb (containing terminase gene) was performed from VOCDs. Short viral genomes with an identity >95% and a coverage >80% were excluded from the unique uncultured names’ lists. A total 168 redundant and unique VCs was left and defined as uncultured viral genomes. In order to measure the distribution of the uncultured viruses from MT (uv-MTs), reads from 45 GOV viromes were mapped using BLASTn (Camacho et al., 2009) with an identity >95%, alignment length >50 bp and e-value < 1e-05 (Mizuno et al., 2016). The number of recruited reads per kb of all uv-MTs was then calculated as relative abundance of each uv-MT and normalized by the total mapped reads for each zone (Mizuno et al., 2016).
The top three most abundant uv-MTs, were selected for genome structure comparison. Nucleotide sequence annotation of these three uv-MTs was performed using RAST (Aziz et al., 2008). Then, a multiple alignment and genome structure prediction was calculated and exhibited by Easyfig (v. 2.2.3) (Sullivan et al., 2011).
Measure of selective constraint on marker genes
The accumulation of non-synonymous polymorphisms (pN) relative to synonymous polymorphisms (pS) was calculated to evaluate the selective forces on rve genes. The nucleotide sequence of rve genes corresponding to the start and end position of their ORFs was obtained. As with dN/dS, pN/pS, the evolution direction and selection pressure for sequences from multiple species without haplotype assignment was estimated (Schloissnig et al., 2013). pN/pS was calculated as the rate of accumulation of non-synonymous polymorphism (pN) over the rate of synonymous polymorphism (pS). Simply, if pN/pS < 1, genes tend to be under a purifying selection, which indicate that deleterious mutations were eliminated to selectively retain the gene’s function (Kieft et al., 2021). if pN/pS > 1, it indicates that genes are evolving under positive pressure (DePristo et al., 2011; Kieft et al., 2021; Romero Picazo et al., 2019; Simmons et al., 2008). ParaAT (v.2.0) (Zhang et al., 2012) was used for preprocessing, CLUSTALw (v.2.1) (Thompson et al., 1994) for multiple alignment and KaKs_Calculator2.0 (Wang et al., 2010) for calculating the pN/pS.
Viral and bacterial abundance
Viral and bacterial abundances were enumerated following the method of Marie et al. (1999) (Marie et al., 1999) and Brussaard (2004) with modification (Brussaard, 2004). Briefly, samples (1.5 mL) were fixed with glutaraldehyde (final concentration: 0.5%), shock-frozen in liquid nitrogen and stored at −80°C until analysis. Frozen samples were thawed at 37°C, stained with the SYBR Green I (final concentration of 10−4, Molecular Probes, Invitrogen, USA) for 15 min in the dark at room temperature prior to analysis. Bacteria were identified on an FACS Calibur flow cytometer (BD Bioscience, USA) in a plot of green fluorescence versus side scatter.
Viral abundance was measured by flow cytometry after SYBR Green I staining (Brussaard, 2004). Briefly, frozen samples were thawed at 37°C, diluted 5- to 50-fold with 0.02-μm filtered Tris-EDTA buffer (Sigma-Aldrich, Germany) and stained with the SYBR Green I (final concentration of 0.5 × 10⁻⁴, Molecular Probes, Invitrogen, USA) in the dark at 80°C for 10 min and cooled at room temperature for 5 min prior to analysis. Viruses were enumerated on a FACSCalibur flow cytometer (BD Bioscience, USA) for viral abundance.
Viral production
Lytic and lysogenic viral productions were estimated by the dilution approach (De Corte et al., 2012; Wilhelm et al., 2002). Per sample, 50 mL of the bacterial concentrate (obtained by Millipore pellicon XL tangential-flow filtration casette durapore 0.2 μm) was added to 450 mL of virus-free seawater from the same sample (obtained by Millipore pellicon XL tangential-flow filtration casette durapore 30 kDa). This approach resulted in bacterial abundances similar to the in situ abundance. The experiments were performed in triplicate (50 mL) in the dark at in situ temperature in dry bath incubators with and without the addition of mitomycin C (final concentration 1 mg mL−1; SIGMA, USA) (Ortmann et al., 2002). Mitomycin C was used to induce the lytic cycle of lysogenic viruses. Subsamples were collected to enumerate bacteria and viruses at time 0 and 3-h intervals over 24 h of incubation.
The lytic and lysogenic viral production rate was assumed to be equal to the rate of viral accumulation in the 24 h incubations with reduced natural viral abundance (Wilhelm et al., 2002). Rates of viral production were calculated using the online program VIPCAL (http://www.univie.ac.at/nuhag-php/vipcal/ (Luef et al., 2009)), amending the deviation of the different piecewise-linear curves of concentration over time. The lytic viral production was estimated from incubations without mitomycin C addition. Lysogenic viral production represents the difference between the viral production obtained in the mitomycin C added samples and the viral production in the treatments without mitomycin C.
Quantification and statistical analysis
PCoA and NMDS analysis of VOCDs compared with GOV, viromes from South China Sea and Pacific and Atlantic viromes were performed using Vegan R package (Dixon, 2003; Yang et al., 2019; De Corte et al., 2019; Liang et al., 2019). The nucleotide frequency of all the downloaded viromes and VOCDs was used for clustering using TBtools (v1.098696) (Chen et al., 2020) according to Euclidean distance.
Canonical correspondence analysis (CCA) was implemented using CANOCO 5 (Lepš and Šmilauer, 2003)
Acknowledgments
We sincerely appreciate the captain and the crews of the R/V Dong Fang Hong two during the spring 2016 west Pacific cruise. We also thank Hongtao Chen for the collection of the environmental factor metadata, as well as Qilong Qin for the supply of microbial metagenomes for the same cruise. We finally thank for the support of high-performance server of Center for High-Performance Computing and System Simulation, Pilot National Laboratory for Marine Science and Technology (Qingdao), and the computing resources provided by IEMB-1, a high-performance computation cluster operated by the Institute of Evolution and Marine Biodiversity (China), and Marine Big Data Center of Institute for Advanced Ocean Study of Ocean University of China (China). This study was supported by the Natural Science Foundation of China, China (No. 41976117, 42120104006, 42176111, and 42188102), and the Fundamental Research Funds for the Central Universities, China (202072002, 201812002, 201762017, and 201562018).
Authors contributions
MW and CAS designed the experiments and wrote the article. JT designed the cruise and the large-volume water sampler. CGao, YL, YJ, and DP-E analyzed the sequence data, performed most statistical analysis and wrote the article. MH, C-XG, and M-WW collected the hosts data and performed the assemble performance assessment. Y-MY and FL detected and classified the viral contigs. ZG, QY, and XZ collected the samples and extracted the DNA. ZL analyzed the viral production data. HH, CGuo, HS, and JX collected cruise-related data. CZ, YX, YS, and XT collected the environmental factors. Q-LQ and Y-ZZ analyzed the microbial metagenomics data. XT, JH, NJ, and AM provided critical ideas for interpreting the data and polished the article.
Declaration of interests
The authors declare no competing interests.
Published: August 19, 2022
Footnotes
Supplemental information can be found online at https://doi.org/10.1016/j.isci.2022.104680.
Contributor Information
Yantao Liang, Email: liangyantao@ouc.edu.cn.
Jiwei Tian, Email: tianjw@ouc.edu.cn.
Curtis A. Suttle, Email: suttle@science.ubc.ca.
Min Wang, Email: mingwang@ouc.edu.cn.
Supplemental information
Data and code availability
-
•
The raw datasets analyzed during the current study are available in the NCBI repository, the BioProject accession is PRJNA668558.
-
•
This paper does not report original code.
-
•
Any additional information required to reanalyze the data reported in this paper is available from the lead contact upon request
References
- Angly F.E., Felts B., Breitbart M., Salamon P., Edwards R.A., Carlson C., Chan A.M., Haynes M., Kelley S., Liu H., et al. The marine viromes of four oceanic regions. PLoS Biol. 2006;4:e368. doi: 10.1371/journal.pbio.0040368. [DOI] [PMC free article] [PubMed] [Google Scholar]
- Aziz R.K., Bartels D., Best A.A., DeJongh M., Disz T., Edwards R.A., Formsma K., Gerdes S., Glass E.M., Kubal M., et al. The RAST Server: rapid annotations using subsystems technology. BMC Genom. 2008;9:75. doi: 10.1186/1471-2164-9-75. [DOI] [PMC free article] [PubMed] [Google Scholar]
- Bin Jang H., Bolduc B., Zablocki O., Kuhn J.H., Roux S., Adriaenssens E.M., Brister J.R., Kropinski A.M., Krupovic M., Lavigne R., et al. Taxonomic assignment of uncultivated prokaryotic virus genomes is enabled by gene-sharing networks. Nat. Biotechnol. 2019;37:632–639. doi: 10.1038/s41587-019-0100-8. [DOI] [PubMed] [Google Scholar]
- Braid M.D., Silhavy J.L., Kitts C.L., Cano R.J., Howe M.M. Complete genomic sequence of bacteriophage B3, a Mu-like phage of Pseudomonas aeruginosa. J. Bacteriol. 2004;186:6560–6574. doi: 10.1128/jb.186.19.6560-6574.2004. [DOI] [PMC free article] [PubMed] [Google Scholar]
- Breitbart M., Salamon P., Andresen B., Mahaffy J.M., Segall A.M., Mead D., Azam F., Rohwer F. Genomic analysis of uncultured marine viral communities. Proc. Natl. Acad. Sci. USA. 2002;99:14250–14255. doi: 10.1073/pnas.202488399. [DOI] [PMC free article] [PubMed] [Google Scholar]
- Brum J.R., Ignacio-Espinoza J.C., Roux S., Doulcier G., Acinas S.G., Alberti A., Chaffron S., Cruaud C., de Vargas C., Gasol J.M., et al. Ocean plankton. Patterns and ecological drivers of ocean viral communities. Science. 2015;348:1261498. doi: 10.1126/science.1261498. [DOI] [PubMed] [Google Scholar]
- Brum J.R., Sullivan M.B. Rising to the challenge: accelerated pace of discovery transforms marine virology. Nat. Rev. Microbiol. 2015;13:147–159. doi: 10.1038/nrmicro3404. [DOI] [PubMed] [Google Scholar]
- Brussaard C.P.D. Optimization of procedures for counting viruses by flow cytometry. Appl. Environ. Microbiol. 2004;70:1506–1513. doi: 10.1128/aem.70.3.1506-1513.2004. [DOI] [PMC free article] [PubMed] [Google Scholar]
- Brussaard C.P.D., Short S.M., Frederickson C.M., Suttle C.A. Isolation and phylogenetic analysis of novel viruses infecting the phytoplankton Phaeocystis globosa (Prymnesiophyceae) Appl. Environ. Microbiol. 2004;70:3700–3705. doi: 10.1128/AEM.70.6.3700-3705.2004. [DOI] [PMC free article] [PubMed] [Google Scholar]
- Buchfink B., Xie C., Huson D.H. Fast and sensitive protein alignment using DIAMOND. Nat. Methods. 2015;12:59–60. doi: 10.1038/nmeth.3176. [DOI] [PubMed] [Google Scholar]
- Camacho C., Coulouris G., Avagyan V., Ma N., Papadopoulos J., Bealer K., Madden T.L. BLAST+: architecture and applications. BMC Bioinformatics. 2009;10:421. doi: 10.1186/1471-2105-10-421. [DOI] [PMC free article] [PubMed] [Google Scholar]
- Chen C., Chen H., Zhang Y., Thomas H.R., Frank M.H., He Y., Xia R. TBtools: an integrative toolkit developed for interactive analyses of big biological data. Mol. Plant. 2020;13:1194–1202. doi: 10.1016/j.molp.2020.06.009. [DOI] [PubMed] [Google Scholar]
- Coutinho F.H., Silveira C.B., Gregoracci G.B., Thompson C.C., Edwards R.A., Brussaard C.P.D., Dutilh B.E., Thompson F.L. Marine viruses discovered via metagenomics shed light on viral strategies throughout the oceans. Nat. Commun. 2017;8:15955. doi: 10.1038/ncomms15955. [DOI] [PMC free article] [PubMed] [Google Scholar]
- Cuecas A., Kanoksilapatham W., Gonzalez J.M. Evidence of horizontal gene transfer by transposase gene analyses in Fervidobacterium species. PLoS One. 2017;12:e0173961. doi: 10.1371/journal.pone.0173961. [DOI] [PMC free article] [PubMed] [Google Scholar]
- Davidson A.L., Chen J. ATP-binding cassette transporters in bacteria. Annu. Rev. Biochem. 2004;73:241–268. doi: 10.1146/annurev.biochem.73.011303.073626. [DOI] [PubMed] [Google Scholar]
- de Cárcer D.A., Angly F.E., Alcamí A. Evaluation of viral genome assembly and diversity estimation in deep metagenomes. BMC Genom. 2014;15:989. doi: 10.1186/1471-2164-15-989. [DOI] [PMC free article] [PubMed] [Google Scholar]
- De Corte D., Martínez J.M., Cretoiu M.S., Takaki Y., Nunoura T., Sintes E., Herndl G.J., Yokokawa T. Viral communities in the global deep ocean conveyor belt assessed by targeted viromics. Front. Microbiol. 2019;10:1801. doi: 10.3389/fmicb.2019.01801. [DOI] [PMC free article] [PubMed] [Google Scholar]
- De Corte D., Sintes E., Winter C., Yokokawa T., Reinthaler T., Herndl G.J. Links between viral and prokaryotic communities throughout the water column in the (sub)tropical Atlantic Ocean. ISME J. 2010;4:1431–1442. doi: 10.1038/ismej.2010.65. [DOI] [PubMed] [Google Scholar]
- De Corte D., Sintes E., Yokokawa T., Herndl G.J. Changes in viral and bacterial communities during the ice-melting season in the coastal Arctic (Kongsfjorden, Ny-Ålesund) Environ. Microbiol. 2011;13:1827–1841. doi: 10.1111/j.1462-2920.2011.02497.x. [DOI] [PubMed] [Google Scholar]
- De Corte D., Sintes E., Yokokawa T., Reinthaler T., Herndl G.J. Links between viruses and prokaryotes throughout the water column along a North Atlantic latitudinal transect. ISME J. 2012;6:1566–1577. doi: 10.1038/ismej.2011.214. [DOI] [PMC free article] [PubMed] [Google Scholar]
- Dekas A.E., Poretsky R.S., Orphan V.J. Deep-sea archaea fix and share nitrogen in methane-consuming microbial consortia. Science. 2009;326:422–426. doi: 10.1126/science.1178223. [DOI] [PubMed] [Google Scholar]
- DePristo M.A., Banks E., Poplin R., Garimella K.V., Maguire J.R., Hartl C., Philippakis A.A., del Angel G., Rivas M.A., Hanna M., et al. A framework for variation discovery and genotyping using next-generation DNA sequencing data. Nat. Genet. 2011;43:491–498. doi: 10.1038/ng.806. [DOI] [PMC free article] [PubMed] [Google Scholar]
- Dixon P. VEGAN, a package of R functions for community ecology. J. Veg. Sci. 2003;14:927–930. doi: 10.1658/1100-9233(2003)014. [DOI] [Google Scholar]
- El-Gebali S., Mistry J., Bateman A., Eddy S.R., Luciani A., Potter S.C., Qureshi M., Richardson L.J., Salazar G.A., Smart A., et al. The Pfam protein families database in 2019. Nucleic Acids Res. 2019;47:D427–D432. doi: 10.1093/nar/gky995. [DOI] [PMC free article] [PubMed] [Google Scholar]
- Eloe E.A., Shulse C.N., Fadrosh D.W., Williamson S.J., Allen E.E., Bartlett D.H. Compositional differences in particle-associated and free-living microbial assemblages from an extreme deep-ocean environment. Environ. Microbiol. Rep. 2011;3:449–458. doi: 10.1111/j.1758-2229.2010.00223.x. [DOI] [PubMed] [Google Scholar]
- Fogg P.C., Hynes A.P., Digby E., Lang A.S., Beatty J.T. Characterization of a newly discovered Mu-like bacteriophage, RcapMu, in Rhodobacter capsulatus strain SB1003. Virology. 2011;421:211–221. doi: 10.1016/j.virol.2011.09.028. [DOI] [PubMed] [Google Scholar]
- Gao S.M., Schippers A., Chen N., Yuan Y., Zhang M.M., Li Q., Liao B., Shu W.S., Huang L.N. Depth-related variability in viral communities in highly stratified sulfidic mine tailings. Microbiome. 2020;8:89. doi: 10.1186/s40168-020-00848-3. [DOI] [PMC free article] [PubMed] [Google Scholar]
- Garcia-Vallvé S., Romeu A., Palau J. Horizontal gene transfer in bacterial and archaeal complete genomes. Genome Res. 2000;10:1719–1725. doi: 10.1101/gr.130000. [DOI] [PMC free article] [PubMed] [Google Scholar]
- Glud R.N., Wenzhöfer F., Middelboe M., Oguri K., Turnewitsch R., Canfield D.E., Kitazato H. High rates of microbial carbon turnover in sediments in the deepest oceanic trench on Earth. Nat. Geosci. 2013;6:284–288. doi: 10.1038/ngeo1773. [DOI] [Google Scholar]
- Gong Z., Liang Y., Wang M., Jiang Y., Yang Q., Xia J., Zhou X., You S., Gao C., Wang J., et al. Viral diversity and its relationship with environmental factors at the surface and deep sea of prydz bay, Antarctica. Front. Microbiol. 2018;9:2981. doi: 10.3389/fmicb.2018.02981. [DOI] [PMC free article] [PubMed] [Google Scholar]
- Gregory A.C., Zayed A.A., Conceição-Neto N., Temperton B., Bolduc B., Alberti A., Ardyna M., Arkhipova K., Carmichael M., Cruaud C., et al. Marine DNA viral macro- and microdiversity from Pole to Pole. Cell. 2019;177:1109–1123.e14. doi: 10.1016/j.cell.2019.03.040. [DOI] [PMC free article] [PubMed] [Google Scholar]
- Groth A.C., Calos M.P. Phage integrases: biology and applications. J. Mol. Biol. 2004;335:667–678. doi: 10.1016/j.jmb.2003.09.082. [DOI] [PubMed] [Google Scholar]
- Guidi L., Chaffron S., Bittner L., Eveillard D., Larhlimi A., Roux S., Darzi Y., Audic S., Berline L., Brum J.R., et al. Plankton networks driving carbon export in the oligotrophic ocean. Nature. 2016;532:465–470. doi: 10.1038/nature16942. [DOI] [PMC free article] [PubMed] [Google Scholar]
- Guo R., Liang Y., Xin Y., Wang L., Mou S., Cao C., Xie R., Zhang C., Tian J., Zhang Y. Insight into the pico- and nano-phytoplankton communities in the deepest biosphere, the Mariana Trench. Front. Microbiol. 2018;9:2289. doi: 10.3389/fmicb.2018.02289. [DOI] [PMC free article] [PubMed] [Google Scholar]
- Hackl T., Laurenceau R., Ankenbrand M.J., Bliem C., Cariani Z., Thomas E., Dooley K.D., Arellano A.A., Hogle S.L., Berube P., et al. Novel integrative elements and genomic plasticity in ocean ecosystems. bioRxiv. 2020 doi: 10.1101/2020.12.28.424599. Preprint at. [DOI] [PubMed] [Google Scholar]
- Huang H., Zhou L., Chen J., Wei T. 2020. ggcor: extended tools for correlation analysis and visualization. R package version 0.9; p. 7.https://github.com/tanyongjun0815/ggcor [Google Scholar]
- Huerta-Cepas J., Szklarczyk D., Forslund K., Cook H., Heller D., Walter M.C., Rattei T., Mende D.R., Sunagawa S., Kuhn M., et al. eggNOG 4.5: a hierarchical orthology framework with improved functional annotations for eukaryotic, prokaryotic and viral sequences. Nucleic Acids Res. 2016;44:D286–D293. doi: 10.1093/nar/gkv1248. [DOI] [PMC free article] [PubMed] [Google Scholar]
- Hurwitz B.L., Sullivan M.B. The Pacific Ocean virome (POV): a marine viral metagenomic dataset and associated protein clusters for quantitative viral ecology. PLoS One. 2013;8:e57355. doi: 10.1371/journal.pone.0057355. [DOI] [PMC free article] [PubMed] [Google Scholar]
- Hyatt D., Chen G.L., Locascio P.F., Land M.L., Larimer F.W., Hauser L.J. Prodigal: prokaryotic gene recognition and translation initiation site identification. BMC Bioinformatics. 2010;11:119. doi: 10.1186/1471-2105-11-119. [DOI] [PMC free article] [PubMed] [Google Scholar]
- Jian H., Yi Y., Wang J., Hao Y., Zhang M., Wang S., Meng C., Zhang Y., Jing H., Wang Y., Xiao X. Diversity and distribution of viruses inhabiting the deepest ocean on Earth. ISME J. 2021:3094–3110. doi: 10.1038/s41396-021-00994-y. [DOI] [PMC free article] [PubMed] [Google Scholar]
- Jiao N., Herndl G.J., Hansell D.A., Benner R., Kattner G., Wilhelm S.W., Kirchman D.L., Weinbauer M.G., Luo T., Chen F., Azam F. Microbial production of recalcitrant dissolved organic matter: long-term carbon storage in the global ocean. Nat. Rev. Microbiol. 2010;8:593–599. doi: 10.1038/nrmicro2386. [DOI] [PubMed] [Google Scholar]
- Jin M., Guo X., Zhang R., Qu W., Gao B., Zeng R. Diversities and potential biogeochemical impacts of mangrove soil viruses. Microbiome. 2019;7:58. doi: 10.1186/s40168-019-0675-9. [DOI] [PMC free article] [PubMed] [Google Scholar]
- Kaneko H., Blanc-Mathieu R., Endo H., Chaffron S., Delmont T.O., Gaia M., Henry N., Hernández-Velázquez R., Nguyen C.H., Mamitsuka H., Forterre P., Jaillon O., de Vargas C., Sullivan M.B., Suttle C.A., Guidi L., Ogata H. Eukaryotic virus composition can predict the efficiency of carbon export in the global ocean. iScience. 2020;24:102002. doi: 10.1016/j.isci.2020.102002. [DOI] [PMC free article] [PubMed] [Google Scholar]
- Kaneko J., Kimura T., Kawakami Y., Tomita T., Kamio Y. Panton-valentine leukocidin genes in a phage-like particle isolated from mitomycin C-treated Staphylococcus aureus V8 (ATCC 49775) Biosci. Biotechnol. Biochem. 1997;61:1960–1962. doi: 10.1271/bbb.61.1960. [DOI] [PubMed] [Google Scholar]
- Kelly J., Jarrell H., Millar L., Tessier L., Fiori L.M., Lau P.C., Allan B., Szymanski C.M. Biosynthesis of the N-linked glycan in Campylobacter jejuni and addition onto protein through block transfer. J. Bacteriol. 2006;188:2427–2434. doi: 10.1128/jb.188.7.2427-2434.2006. [DOI] [PMC free article] [PubMed] [Google Scholar]
- Kieft K., Zhou Z., Anantharaman K. VIBRANT: automated recovery, annotation and curation of microbial viruses, and evaluation of viral community function from genomic sequences. Microbiome. 2020;8:90. doi: 10.1186/s40168-020-00867-0. [DOI] [PMC free article] [PubMed] [Google Scholar]
- Kieft K., Zhou Z., Anderson R.E., Buchan A., Campbell B.J., Hallam S.J., Hess M., Sullivan M.B., Walsh D.A., Roux S., Anantharaman K. Ecology of inorganic sulfur auxiliary metabolism in widespread bacteriophages. Nat. Commun. 2021;12:3503. doi: 10.1038/s41467-021-23698-5. [DOI] [PMC free article] [PubMed] [Google Scholar]
- Kwon H.J., Tirumalai R., Landy A., Ellenberger T. Flexibility in DNA recombination: structure of the lambda integrase catalytic core. Science. 1997;276:126–131. doi: 10.1126/science.276.5309.126. [DOI] [PMC free article] [PubMed] [Google Scholar]
- Labonte J.M., Swan B.K., Poulos B., Luo H., Koren S., Hallam S.J., Sullivan M.B., Woyke T., Eric WommacK K., Stepanauskas R. Single-cell genomics-based analysis of virus-host interactions in marine surface bacterioplankton. ISME J. 2015;9:2386–2399. doi: 10.1038/ismej.2015.48. [DOI] [PMC free article] [PubMed] [Google Scholar]
- Langmead B., Salzberg S.L. Fast gapped-read alignment with Bowtie 2. Nat. Methods. 2012;9:357–359. doi: 10.1038/nmeth.1923. [DOI] [PMC free article] [PubMed] [Google Scholar]
- Lara E., Vaqué D., Sà E.L., Boras J.A., Gomes A., Borrull E., Díez-Vives C., Teira E., Pernice M.C., Garcia F.C., et al. Unveiling the role and life strategies of viruses from the surface to the dark ocean. Sci. Adv. 2017;3:e1602565. doi: 10.1126/sciadv.1602565. [DOI] [PMC free article] [PubMed] [Google Scholar]
- Lepš J., Šmilauer P. Cambridge University Press; 2003. Multivariate Analysis of Ecological Data Using CANOCO. [Google Scholar]
- Letunic I., Bork P. Interactive Tree of Life (iTOL): an online tool for phylogenetic tree display and annotation. Bioinformatics. 2007;23:127–128. doi: 10.1093/bioinformatics/btl529. [DOI] [PubMed] [Google Scholar]
- Li H., Handsaker B., Wysoker A., Fennell T., Ruan J., Homer N., Marth G., Abecasis G., Durbin R. The sequence alignment/map format and SAMtools. Bioinformatics. 2009;25:2078–2079. doi: 10.1093/bioinformatics/btp352. [DOI] [PMC free article] [PubMed] [Google Scholar]
- Li Z., Pan D., Wei G., Pi W., Zhang C., Wang J.-H., Peng Y., Zhang L., Wang Y., Hubert C.R.J., Dong X. Deep sea sediments associated with cold seeps are a subsurface reservoir of viral diversity. ISME J. 2021;15:2366–2378. doi: 10.1038/s41396-021-00932-y. [DOI] [PMC free article] [PubMed] [Google Scholar]
- Liang Y., Wang L., Wang Z., Zhao J., Yang Q., Wang M., Yang K., Zhang L., Jiao N., Zhang Y. Metagenomic analysis of the diversity of DNA viruses in the surface and deep sea of the South China sea. Front. Microbiol. 2019;10:1951. doi: 10.3389/fmicb.2019.01951. [DOI] [PMC free article] [PubMed] [Google Scholar]
- Liang Y., Zhang Y., Zhang Y., Luo T., Rivkin R.B., Jiao N. Distributions and relationships of virio- and picoplankton in the epi-meso- and bathypelagic zones of the Western Pacific Ocean. FEMS Microbiol. Ecol. 2017;93:fiw238. doi: 10.1093/femsec/fiw238. [DOI] [PubMed] [Google Scholar]
- Liu J., Zheng Y., Lin H., Wang X., Li M., Liu Y., Yu M., Zhao M., Pedentchouk N., Lea-Smith D.J., et al. Proliferation of hydrocarbon-degrading microbes at the bottom of the Mariana Trench. Microbiome. 2019;7:47. doi: 10.1186/s40168-019-0652-3. [DOI] [PMC free article] [PubMed] [Google Scholar]
- Liu Z., Ma A., Mathe E., Merling M., Ma Q., Liu B. Network analyses in microbiome based on high-throughput multi-omics data. BMC Bioinformatics. 2020;22:1639–1655. doi: 10.1093/bib/bbaa005. [DOI] [PMC free article] [PubMed] [Google Scholar]
- López-Pérez M., Haro-Moreno J.M., Gonzalez-Serrano R., Parras-Moltó M., Rodriguez-Valera F. Genome diversity of marine phages recovered from Mediterranean metagenomes: size matters. PLoS Genet. 2017;13:e1007018. doi: 10.1371/journal.pgen.1007018. [DOI] [PMC free article] [PubMed] [Google Scholar]
- Luef B., Luef F., Peduzzi P. Online program 'vipcal' for calculating lytic viral production and lysogenic cells based on a viral reduction approach. Environ. Microbiol. Rep. 2009;1:78–85. doi: 10.1111/j.1758-2229.2008.00008.x. [DOI] [PMC free article] [PubMed] [Google Scholar]
- Luo E., Aylward F.O., Mende D.R., DeLong E.F. Bacteriophage distributions and temporal variability in the ocean's interior. mBio. 2017;8 doi: 10.1128/mBio.01903-17. e01903-17. [DOI] [PMC free article] [PubMed] [Google Scholar]
- Luo E., Eppley J.M., Romano A.E., Mende D.R., DeLong E.F. Double-stranded DNA virioplankton dynamics and reproductive strategies in the oligotrophic open ocean water column. ISME J. 2020;14:1304–1315. doi: 10.1038/s41396-020-0604-8. [DOI] [PMC free article] [PubMed] [Google Scholar]
- Luo M., Gieskes J., Chen L., Shi X., Chen D. Provenances, distribution, and accumulation of organic matter in the southern Mariana Trench rim and slope: implication for carbon cycle and burial in hadal trenches. Mar. Geol. 2017;386:98–106. doi: 10.1016/j.margeo.2017.02.012. [DOI] [Google Scholar]
- Mara P., Vik D., Pachiadaki M.G., Suter E.A., Poulos B., Taylor G.T., Sullivan M.B., Edgcomb V.P. Viral elements and their potential influence on microbial processes along the permanently stratified Cariaco Basin redoxcline. ISME J. 2020;14:3079–3092. doi: 10.1038/s41396-020-00739-3. [DOI] [PMC free article] [PubMed] [Google Scholar]
- Marie D., Brussaard C.P.D., Thyrhaug R., Bratbak G., Vaulot D. Enumeration of marine viruses in culture and natural samples by flow cytometry. Appl. Environ. Microbiol. 1999;65:45–52. doi: 10.1128/aem.65.1.45-52.1999. [DOI] [PMC free article] [PubMed] [Google Scholar]
- Martín-Cuadrado A.B., López-García P., Alba J.C., Moreira D., Monticelli L., Strittmatter A., Gottschalk G., Rodríguez-Valera F. Metagenomics of the deep Mediterranean, a warm bathypelagic habitat. PLoS One. 2007;2:e914. doi: 10.1371/journal.pone.0000914. [DOI] [PMC free article] [PubMed] [Google Scholar]
- Martin M. Cutadapt removes adapter sequences from high-throughput sequencing reads. EMBnet J. 2011;17:10. doi: 10.14806/ej.17.1.200. [DOI] [Google Scholar]
- Mathieu B., Sebastien H., Mathieu J. ICWSM; 2009. Gephi: An Open Source Software for Exploring and Manipulating Networks. [Google Scholar]
- Mizuno C.M., Ghai R., Saghaï A., López-García P., Rodriguez-Valera F. Genomes of abundant and widespread viruses from the deep ocean. mBio. 2016;7 doi: 10.1128/mBio.00805-16. e00805-16. [DOI] [PMC free article] [PubMed] [Google Scholar]
- Nayfach S., Camargo A.P., Schulz F., Eloe-Fadrosh E., Roux S., Kyrpides N.C. CheckV assesses the quality and completeness of metagenome-assembled viral genomes. Nat. Biotechnol. 2021;39:578–585. doi: 10.1038/s41587-020-00774-7. [DOI] [PMC free article] [PubMed] [Google Scholar]
- Nunoura T., Hirai M., Yoshida-Takashima Y., Nishizawa M., Kawagucci S., Yokokawa T., Miyazaki J., Koide O., Makita H., Takaki Y., et al. Distribution and niche separation of planktonic microbial communities in the water columns from the surface to the hadal waters of the Japan trench under the eutrophic ocean. Front. Microbiol. 2016;7:1261. doi: 10.3389/fmicb.2016.01261. [DOI] [PMC free article] [PubMed] [Google Scholar]
- Nunoura T., Takaki Y., Hirai M., Shimamura S., Makabe A., Koide O., Kikuchi T., Miyazaki J., Koba K., Yoshida N., et al. Hadal biosphere: insight into the microbial ecosystem in the deepest ocean on Earth. Proc. Natl. Acad. Sci. USA. 2015;112:E1230–E1236. doi: 10.1073/pnas.1421816112. [DOI] [PMC free article] [PubMed] [Google Scholar]
- Ortmann A.C., Lawrence J.E., Suttle C.A. Lysogeny and lytic viral production during a bloom of the cyanobacterium Synechococcus spp. Microb. Ecol. 2002;43:225–231. doi: 10.1007/s00248-001-1058-9. [DOI] [PubMed] [Google Scholar]
- Paez-Espino D., Eloe-Fadrosh E.A., Pavlopoulos G.A., Thomas A.D., Huntemann M., Mikhailova N., Rubin E., Ivanova N.N., Kyrpides N.C. Uncovering Earth's virome. Nature. 2016;536:425–430. doi: 10.1038/nature19094. [DOI] [PubMed] [Google Scholar]
- Paez-Espino D., Roux S., Chen I.M., Palaniappan K., Ratner A., Chu K., Huntemann M., Reddy T.B.K., Pons J.C., Llabrés M., et al. IMG/VR v.2.0: an integrated data management and analysis system for cultivated and environmental viral genomes. Nucleic Acids Res. 2019;47:D678–D686. doi: 10.1093/nar/gky1127. [DOI] [PMC free article] [PubMed] [Google Scholar]
- Parras-Moltó M., Rodríguez-Galet A., Suárez-Rodríguez P., López-Bueno A. Evaluation of bias induced by viral enrichment and random amplification protocols in metagenomic surveys of saliva DNA viruses. Microbiome. 2018;6:119. doi: 10.1186/s40168-018-0507-3. [DOI] [PMC free article] [PubMed] [Google Scholar]
- Peng Y., Leung H.C.M., Yiu S.M., Chin F.Y.L. IDBA-UD: a de novo assembler for single-cell and metagenomic sequencing data with highly uneven depth. Bioinformatics. 2012;28:1420–1428. doi: 10.1093/bioinformatics/bts174. [DOI] [PubMed] [Google Scholar]
- Peoples L.M., Donaldson S., Osuntokun O., Xia Q., Nelson A., Blanton J., Allen E.E., Church M.J., Bartlett D.H. Vertically distinct microbial communities in the Mariana and Kermadec trenches. PLoS One. 2018;13:e0195102. doi: 10.1371/journal.pone.0195102. [DOI] [PMC free article] [PubMed] [Google Scholar]
- Pourcel C., Midoux C., Bourkaltseva M., Pleteneva E., Krylov V. Complete genome sequence of PM105, a new Pseudomonas aeruginosa B3-like transposable phage. Genome Announc. 2016;4 doi: 10.1128/genomeA.01543-15. e01543-15. [DOI] [PMC free article] [PubMed] [Google Scholar]
- Price M.N., Dehal P.S., Arkin A.P. FastTree 2--approximately maximum-likelihood trees for large alignments. PLoS One. 2010;5:e9490. doi: 10.1371/journal.pone.0009490. [DOI] [PMC free article] [PubMed] [Google Scholar]
- Qu A., Brulc J.M., Wilson M.K., Law B.F., Theoret J.R., Joens L.A., Konkel M.E., Angly F., Dinsdale E.A., Edwards R.A., et al. Comparative metagenomics reveals host specific metavirulomes and horizontal gene transfer elements in the chicken cecum microbiome. PLoS One. 2008;3:e2945. doi: 10.1371/journal.pone.0002945. [DOI] [PMC free article] [PubMed] [Google Scholar]
- Ren J., Ahlgren N.A., Lu Y.Y., Fuhrman J.A., Sun F. VirFinder: a novel k-mer based tool for identifying viral sequences from assembled metagenomic data. Microbiome. 2017;5:69. doi: 10.1186/s40168-017-0283-5. [DOI] [PMC free article] [PubMed] [Google Scholar]
- Romero Picazo D., Dagan T., Ansorge R., Petersen J.M., Dubilier N., Kupczok A. Horizontally transmitted symbiont populations in deep-sea mussels are genetically isolated. ISME J. 2019;13:2954–2968. doi: 10.1038/s41396-019-0475-z. [DOI] [PMC free article] [PubMed] [Google Scholar]
- Roux S., Brum J.R., Dutilh B.E., Sunagawa S., Duhaime M.B., Loy A., Poulos B.T., Solonenko N., Lara E., Poulain J., et al. Ecogenomics and potential biogeochemical impacts of globally abundant ocean viruses. Nature. 2016;537:689–693. doi: 10.1038/nature19366. [DOI] [PubMed] [Google Scholar]
- Roux S., Enault F., Hurwitz B.L., Sullivan M.B. VirSorter: mining viral signal from microbial genomic data. PeerJ. 2015;3:e985. doi: 10.7717/peerj.985. [DOI] [PMC free article] [PubMed] [Google Scholar]
- Santos-Medellin C., Zinke L.A., Ter Horst A.M., Gelardi D.L., Parikh S.J., Emerson J.B. Viromes outperform total metagenomes in revealing the spatiotemporal patterns of agricultural soil viral communities. 2021;15:1956–1970. doi: 10.1038/s41396-021-00897-y. [DOI] [PMC free article] [PubMed] [Google Scholar]
- Sansevere E.A., Robinson D.A. Staphylococci on ICE: overlooked agents of horizontal gene transfer. Mob. Genet. Elem. 2017;7:1–10. doi: 10.1080/2159256x.2017.1368433. [DOI] [PMC free article] [PubMed] [Google Scholar]
- Schloissnig S., Arumugam M., Sunagawa S., Mitreva M., Tap J., Zhu A., Waller A., Mende D.R., Kultima J.R., Martin J., et al. Genomic variation landscape of the human gut microbiome. Nature. 2013;493:45–50. doi: 10.1038/nature11711. [DOI] [PMC free article] [PubMed] [Google Scholar]
- Shannon P., Markiel A., Ozier O., Baliga N.S., Wang J.T., Ramage D., Amin N., Schwikowski B., Ideker T. Cytoscape: a software environment for integrated models of biomolecular interaction networks. Genome Res. 2003;13:2498–2504. doi: 10.1101/gr.1239303. [DOI] [PMC free article] [PubMed] [Google Scholar]
- Shapiro J.W., Putonti C., Keim P. Gene Co-occurrence networks reflect bacteriophage ecology and evolution. mBio. 2018;9 doi: 10.1128/mBio.01870-17. e01870-17. [DOI] [PMC free article] [PubMed] [Google Scholar]
- Shimada M.K., Nishida T. A modification of the PHYLIP program: a solution for the redundant cluster problem, and an implementation of an automatic bootstrapping on trees inferred from original data. Mol. Phylogenet. Evol. 2017;109:409–414. doi: 10.1016/j.ympev.2017.02.012. [DOI] [PubMed] [Google Scholar]
- Silveira C.B., Rohwer F.L. Piggyback-the-Winner in host-associated microbial communities. NPJ Biofilms Microbiomes. 2016;2:16010. doi: 10.1038/npjbiofilms.2016.10. [DOI] [PMC free article] [PubMed] [Google Scholar]
- Simmons S.L., Dibartolo G., Denef V.J., Goltsman D.S.A., Thelen M.P., Banfield J.F. Population genomic analysis of strain variation in Leptospirillum group II bacteria involved in acid mine drainage formation. PLoS Biol. 2008;6:e177. doi: 10.1371/journal.pbio.0060177. [DOI] [PMC free article] [PubMed] [Google Scholar]
- Sullivan M.J., Petty N.K., Beatson S.A. Easyfig: a genome comparison visualizer. Bioinformatics. 2011;27:1009–1010. doi: 10.1093/bioinformatics/btr039. [DOI] [PMC free article] [PubMed] [Google Scholar]
- Suttle C.A. Viruses in the sea. Nature. 2005;437:356–361. doi: 10.1038/nature04160. [DOI] [PubMed] [Google Scholar]
- Suttle C.A. Marine viruses--major players in the global ecosystem. Nat. Rev. Microbiol. 2007;5:801–812. doi: 10.1038/nrmicro1750. [DOI] [PubMed] [Google Scholar]
- Taira K., Kitagawa S., Yamashiro T., Yanagimoto D. Deep and bottom currents in the challenger deep, Mariana Trench, measured with super-deep current meters. J. Oceanogr. 2004;60:919–926. doi: 10.1007/s10872-005-0001-y. [DOI] [Google Scholar]
- Taira K., Yanagimoto D., Kitagawa S.J.J.o.O. Deep CTD casts in the challenger deep, Mariana Trench. J. Oceanogr. 2005;61:447–454. doi: 10.1007/s10872-005-0053-z. [DOI] [Google Scholar]
- Ter Horst A.M., Santos-Medellín C., Sorensen J.W., Zinke L.A., Wilson R.M., Johnston E.R., Trubl G., Pett-Ridge J., Blazewicz S.J., Hanson P.J., et al. Minnesota peat viromes reveal terrestrial and aquatic niche partitioning for local and global viral populations. Microbiome. 2021;9:233. doi: 10.1186/s40168-021-01156-0. [DOI] [PMC free article] [PubMed] [Google Scholar]
- Thoendel M., Jeraldo P., Greenwood-Quaintance K.E., Yao J., Chia N., Hanssen A.D., Abdel M.P., Patel R. Impact of contaminating DNA in whole-genome amplification kits used for metagenomic shotgun sequencing for infection diagnosis. J. Clin. Microbiol. 2017;55:1789–1801. doi: 10.1128/JCM.02402-16. [DOI] [PMC free article] [PubMed] [Google Scholar]
- Thompson J.D., Higgins D.G., Gibson T.J. CLUSTAL W: improving the sensitivity of progressive multiple sequence alignment through sequence weighting, position-specific gap penalties and weight matrix choice. Nucleic Acids Res. 1994;22:4673–4680. doi: 10.1093/nar/22.22.4673. [DOI] [PMC free article] [PubMed] [Google Scholar]
- Thurber R.V., Haynes M., Breitbart M., Wegley L., Rohwer F. Laboratory procedures to generate viral metagenomes. Nat. Protoc. 2009;4:470–483. doi: 10.1038/nprot.2009.10. [DOI] [PubMed] [Google Scholar]
- Tian J., Fan L., Liu H., Liu J., Li Y., Qin Q., Gong Z., Chen H., Sun Z., Zou L., et al. A nearly uniform distributional pattern of heterotrophic bacteria in the Mariana Trench interior. Deep-Sea Res. I: Oceanogr. Res. Pap. 2018;142:116–126. doi: 10.1016/j.dsr.2018.10.002. [DOI] [Google Scholar]
- Ulycznyj P.I., Salmon K.A., Douillard H., DuBow M.S. Characterization of the Pseudomonas aeruginosa transposable bacteriophage D3112 A and B genes. Biochim. Biophys. Acta. 1995;1264:249–253. doi: 10.1016/0167-4781(95)00186-7. [DOI] [PubMed] [Google Scholar]
- von Meijenfeldt F.A.B., Arkhipova K., Cambuy D.D., Coutinho F.H., Dutilh B.E. Robust taxonomic classification of uncharted microbial sequences and bins with CAT and BAT. Genome Biol. 2019;20:217. doi: 10.1186/s13059-019-1817-x. [DOI] [PMC free article] [PubMed] [Google Scholar]
- Wang D., Zhang Y., Zhang Z., Zhu J., Yu J. KaKs_Calculator 2.0: a toolkit incorporating gamma-series methods and sliding window strategies. Dev. Reprod. Biol. 2010;8:77–80. doi: 10.1016/S1672-0229(10)60008-3. [DOI] [PMC free article] [PubMed] [Google Scholar]
- Weinbauer M.G., Brettar I., Höfle M.G. Lysogeny and virus-induced mortality of bacterioplankton in surface, deep, and anoxic marine waters. Limnol. Oceanogr. 2003;48:1457–1465. doi: 10.4319/lo.2003.48.4.1457. [DOI] [Google Scholar]
- Wilhelm S.W., Brigden S.M., Suttle C.A.J.M.E. A dilution technique for the direct measurement of viral production: a comparison in stratified and tidally mixed coastal waters. Microb. Ecol. 2002;43:168–173. doi: 10.1007/s00248-001-1021-9. [DOI] [PubMed] [Google Scholar]
- Wilhelm S.W., Suttle C.A. Viruses and nutrient cycles in the sea. Bioscience. 1999;49:781–788. doi: 10.2307/1313569. [DOI] [Google Scholar]
- Williamson S.J., Allen L.Z., Lorenzi H.A., Fadrosh D.W., Brami D., Thiagarajan M., McCrow J.P., Tovchigrechko A., Yooseph S., Venter J.C. Metagenomic exploration of viruses throughout the Indian Ocean. PLoS One. 2012;7:e42047. doi: 10.1371/journal.pone.0042047. [DOI] [PMC free article] [PubMed] [Google Scholar]
- Williamson S.J., Cary S.C., Williamson K.E., Helton R.R., Bench S.R., Winget D., Wommack K.E. Lysogenic virus-host interactions predominate at deep-sea diffuse-flow hydrothermal vents. ISME J. 2008;2:1112–1121. doi: 10.1038/ismej.2008.73. [DOI] [PubMed] [Google Scholar]
- Xu Z., Wang M., Wu W., Li Y., Liu Q., Han Y., Jiang Y., Shao H., McMinn A., Liu H. Vertical distribution of microbial eukaryotes from surface to the hadal zone of the Mariana Trench. Front. Microbiol. 2018;9:2023. doi: 10.3389/fmicb.2018.02023. [DOI] [PMC free article] [PubMed] [Google Scholar]
- Yang Q., Gao C., Jiang Y., Wang M., Zhou X., Shao H., Gong Z., McMinn A. Metagenomic characterization of the viral community of the South scotia ridge. Viruses. 2019;11:95. doi: 10.3390/v11020095. [DOI] [PMC free article] [PubMed] [Google Scholar]
- Yilmaz S., Allgaier M., Hugenholtz P. Multiple displacement amplification compromises quantitative analysis of metagenomes. Nat. Methods. 2010;7:943–944. doi: 10.1038/nmeth1210-943. [DOI] [PubMed] [Google Scholar]
- Yoshida M., Takaki Y., Eitoku M., Nunoura T., Takai K. Metagenomic analysis of viral communities in (hado)pelagic sediments. PLoS One. 2013;8:e57271. doi: 10.1371/journal.pone.0057271. [DOI] [PMC free article] [PubMed] [Google Scholar]
- Zhang X., Xu W., Liu Y., Cai M., Luo Z., Li M. Metagenomics reveals microbial diversity and metabolic potentials of seawater and surface sediment from a hadal biosphere at the Yap Trench. Front. Microbiol. 2018;9:2402. doi: 10.3389/fmicb.2018.02402. [DOI] [PMC free article] [PubMed] [Google Scholar]
- Zhang Z., Xiao J., Wu J., Zhang H., Liu G., Wang X., Dai L. ParaAT: a parallel tool for constructing multiple protein-coding DNA alignments. Biochem. Biophys. Res. Commun. 2012;419:779–781. doi: 10.1016/j.bbrc.2012.02.101. [DOI] [PubMed] [Google Scholar]
- Zhao Y., Temperton B., Thrash J.C., Schwalbach M.S., Vergin K.L., Landry Z.C., Ellisman M., Deerinck T., Sullivan M.B., Giovannoni S.J.J.N. Abundant SAR11 viruses in the ocean. Nature. 2013;494:357–360. doi: 10.1038/nature11921. [DOI] [PubMed] [Google Scholar]
- Zheng Y., Wang J., Zhou S., Zhang Y., Liu J., Xue C.X., Williams B.T., Zhao X., Zhao L., Zhu X.Y.J.N.C., et al. Bacteria are important dimethylsulfoniopropionate producers in marine aphotic and high-pressure environments. Nat. Commun. 2020;11:4658. doi: 10.1038/s41467-020-18434-4. [DOI] [PMC free article] [PubMed] [Google Scholar]
- Zhong H., Lehtovirta-Morley L., Liu J., Zheng Y., Lin H., Song D., Todd J.D., Tian J., Zhang X.H. Novel insights into the Thaumarchaeota in the deepest oceans: their metabolism and potential adaptation mechanisms. Microbiome. 2020;8:78. doi: 10.1186/s40168-020-00849-2. [DOI] [PMC free article] [PubMed] [Google Scholar]
- Zhou Y.L., Mara P., Cui G.J., Edgcomb V.P., Wang Y. Microbiomes in the Challenger Deep slope and bottom-axis sediments. Nat. Commun. 2022;13:1515. doi: 10.1038/s41467-022-29144-4. [DOI] [PMC free article] [PubMed] [Google Scholar]
- Zimmerman A.E., Howard-Varona C., Needham D.M., John S.G., Worden A.Z., Sullivan M.B., Waldbauer J.R., Coleman M.L. Metabolic and biogeochemical consequences of viral infection in aquatic ecosystems. Nat. Rev. Microbiol. 2020;18:21–34. doi: 10.1038/s41579-019-0270-x. [DOI] [PubMed] [Google Scholar]
Associated Data
This section collects any data citations, data availability statements, or supplementary materials included in this article.
Supplementary Materials
Data Availability Statement
-
•
The raw datasets analyzed during the current study are available in the NCBI repository, the BioProject accession is PRJNA668558.
-
•
This paper does not report original code.
-
•
Any additional information required to reanalyze the data reported in this paper is available from the lead contact upon request