

Abstract
Chronic low back pain (CLBP) is one of the leading causes of pain and disability in adults in the United States and disproportionately burdens non-Hispanic Black (NHB) individuals and females. Approximately 90% of CLBP cases are of unknown cause, and it is imperative that potential causes be explored. It has been reported that diet quality can influence pain state via diet-induced inflammation. The present study assessed the relationship between Dietary Inflammatory Index (DII) and movement evoked-pain severity in people with CLBP and investigated whether race/sex moderated the relationship between DII and movement-evoked pain. Results revealed no significant differences in DII scores between males and females, or between NHB and non-Hispanic White (NHW) participants. Participant sex significantly modified the relationship between DII and movement-evoked pain severity (p=0.0155), such that movement-evoked pain severity was significantly impacted by DII scores in females, but not males. Participant race did not significantly moderate the DII – movement-evoked pain severity relationship. These results suggest that diet-induced inflammation may impact the CLBP experiences of females to a greater degree than males. Further research is needed to determine whether dietary interventions that reduce inflammation improve CLBP outcomes and whether these interventions may be differentially-beneficial based on sex.
Perspective:
This article highlights the impact of diet-induced inflammation in a community-based sample as a whole, as well as stratified in various sociodemographic groups. This work expands our understanding of the influence of diet on pain experience and suggests that modifications to diet may be efficacious treatments for reducing chronic pain.
Keywords: Sex differences, racial differences, diet, inflammation, pain
Introduction
Chronic low back pain (CLBP) is a debilitating pain disorder affecting approximately 13.1% (42.6 million) of the adults in the United States each year (50). Individuals with CLBP are more likely to be female (64) and non-Hispanic Black (NHB) (13), highlighting differences in the prevalence of the disorder. The utilization of health care services by those with CLBP has increased substantially in recent years (27). Previous literature has shown increases in the number of physician, physical therapist and chiropractor visits, spinal injections, back surgeries, and opioid prescriptions within this population (6). However, because the vast majority of those with CLBP do not have an identifiable cause (non-specific CLBP) (23), these treatments are often ineffective, are accompanied by side effects, and/or simply mask the issue rather than provide a solution. Thus, it is imperative that research continue to explore factors that can predispose or exacerbate non-specific CLBP to highlight potential avenues for treatment.
In addition to a long history of natural substances being utilized to alleviate pain (i.e., the opium poppy, willow bark, and coal tar) (54), other aspects of daily living can exacerbate pain. One of the primary means to directly influence inflammatory pathways is through the diet and the interaction of dietary elements with the immune system. Elements of a Standard American Diet (SAD), such as excess consumption of carbohydrates, calories, and saturated fats, have all been implicated in pro-inflammatory processes. Previously, we have shown that the SAD is associated with increased immune system activation, inflammation and pain sensitivity (59, 61), and that dietary intervention is an effective method of reducing pain (57, 58).
We have recently reported that poor-quality dietary patterns increase the relative risk for pain in a nationwide epidemiological sample of Americans (56). In contrast to traditional studies investigating specific nutrients and their impact on diseases, this method takes the complex interactions of various diet elements into account to examine their impact on pain. The Dietary Inflammatory Index (DII) is a novel assessment of diet pattern meant to provide a literature-derived, population-based index to compare diverse populations on the pro- and anti-inflammatory nature of their diets (48). Using a robust literature base, standardized individual intakes, and global intake norms, the DII is a reflection of eating habits used in many epidemiological and clinical studies. Given our previous work (56-59, 61) and the relationships noted between diet, inflammation, and pain, as well as the disparities seen among sociodemographic groups (4, 12, 40), we employed the DII in our CLBP population to categorize diet patterns and the impact of these diets on movement-evoked pain. The goal of the current project was to determine whether the diet consumed by participants contributed to pain sensitivity (as assessed by DII). We hypothesized that DII scores would affect pain sensitivity measures and that the impact of DII would be moderated by both race and sex.
Methods
Participants
This study was part of an ongoing parent project investigating ethnic/racial and socioeconomic differences in CLBP severity and disability (Examining Racial And SocioEconomic Disparities in CLBP; ERASED). The parent project employs a biopsychosocial conceptual rubric that examines biobehavioral, psychological, and sociocultural factors that may help explain differences in CLBP between NHB and non-Hispanic White (NHW) adults (2, 62). The procedures and experimental methods described below are limited to those involved in the current research study. Study participants were recruited via flyers posted at University of Alabama at Birmingham (UAB)-affiliated pain treatment clinics and the surrounding community. Participants presented to the Biobehavioral Pain Research Laboratory (PI: Goodin) for study participation. A description of the study protocol was provided to each participant prior to obtaining their informed consent. A project coordinator screened participants, while both pre-doctoral and undergraduate research assistants were responsible for collection of data. Potential participants were first evaluated via telephone screen and medical record review. Participants were considered eligible if his/her back pain persisted for at least three consecutive months and resulted in pain for at least half the days in the past six months. Additionally, participants were only deemed eligible if he/she had not undergone a surgical intervention or experienced an accident/trauma within the past 12 months, in addition to other stringent inclusion/exclusion criteria that have been cited elsewhere (40). On the day of arrival, participants were given a coronavirus disease 2019 (COVID-19) screening form and temperature check, blood pressure and heart rate assessment. Participants with a temperature above 100.4 F, blood pressure over 150/95 (systolic/diastolic, mmHg), and/or had been exposed to COVID-19 were asked to seek medical attention and reschedule. Because of the short, cross-sectional nature of the study, the COVID-19 pandemic had minimal, if any, effects on participant retention. Height (m) and weight (kg) were measured prior to the administration of the 24-hour Food Recall, as well as a sociodemographic questionnaires that requested information about age, race, sex, and annual household income. We have previously used the Area Deprivation Index (ADI) to assess our pain-related outcomes for our participants (24). With our exploratory analysis, we found no impact of ADI on any of our variables. The ADI did not vary as a function of DII, race, or sex, suggesting that our participant population were relatively homogenous with respect to this variable. Thus, income and education were included independently as continuous ordinal variables. Race and sex were self-reported, and options were given to allow participants to choose as many options as they deemed appropriate. Alternatively, they also had the opportunity to write in their own option for both race and sex. A timeline of events of the current study can be seen in Figure 1. Upon study completion, participants received monetary compensation of $400 USD. All procedures were reviewed and approved by the UAB Institutional Review Board and carried out in a manner consistent with ethical research guidelines as outlined in the Declaration of Helsinki.
Figure 1.
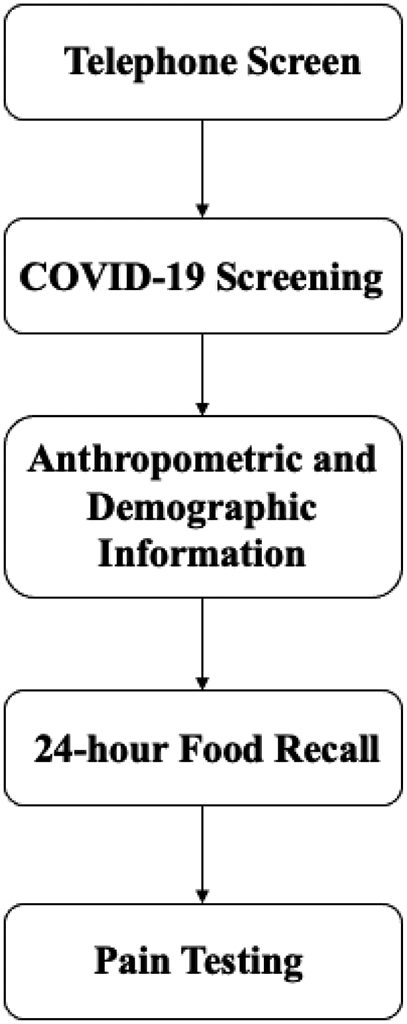
Schematic of the timeline events of the present study.
Dietary Assessment
Study personnel were trained to properly deliver a 24-hour Food Recall to participants. Visual aids such as measuring cups, measuring spoons, and various standardized containers were provided to aid in accuracy of reporting portion sizes. Participants were asked to list, in detail, all food, beverages, condiments, and supplements that they consumed 24 hours prior to completing pain testing, as well as the amount consumed and the location of consumption. The data from the 24-hour Food Recalls were entered into the Nutrition Database System for Research (NDSR) (University of Minnesota, Minneapolis, MN) (17). Nutrition reports containing detailed macronutrient and micronutrient intake were generated and used to calculate the DII for each participant.
The DII parameters were estimated as previously described (48). In short, based on the available dietary intake data available for each participant, a z-score was calculated for each of the food parameters and converted to a centered percentile, based on the world average and standard deviation. The centered percentile value for each food parameter was then multiplied by its respective overall food parameter-specific inflammatory effect score to obtain the food parameter-specific DII score. Finally, all of the food parameter-specific DII scores were summed to create the overall DII score for each participant. For the current study, the following food parameters were used to calculate each participants DII scores: alcohol, vitamin B12, vitamin B6, beta-carotene, caffeine, carbohydrate, cholesterol, calories/energy, total fat, fiber, folic acid, iron, magnesium, monounsaturated fatty acids (MUFA), niacin, omega-3 fatty acids, omega-6 fatty acids, protein, polyunsaturated fatty acids (PUFA), riboflavin, saturated fat, thiamin, trans fat, vitamin A, vitamin C, vitamin D, vitamin E, zinc, and isoflavones.
Movement-Evoked Pain Testing
Bed Task and Box Lift Assessments.
In order to assess pain while completing daily tasks, participants were asked to rate their pain in their lower back getting into and getting out of a bed that was 0.9 m in height. Participants were then asked to rate the pain in their lower back while lifting a weighted box (4 kg for females, and 6.3 kg for males) from the floor onto the bed, and then back to the floor. The 0-100 numeric rating scale was utilized for this purpose (pain: 0 = no pain and 100 = most intense pain imaginable; difficulty: 0 = not difficult at all and 100 = unable to perform).
The Short Physical Performance Battery (SPPB).
The SPPB assesses lower extremity function with three movement tasks: standing balance, 4-meter walking speed, and ability to rise from a chair (20). Specifically, participants completed the following movement tasks in consecutive order: 1) Stand with their feet oriented in the side-by-side, semi-tandem, and tandem positions for 10 seconds each (standing balance); 2) Rise from, and return to, a seated position in a chair five times (repeated chair stands); and 3) Walk a distance of 4 m, twice (GAIT). For each movement, they received a score of 0–4 (total score 0–12) based on their performance. If participants did not feel comfortable completing any of the SPPB tasks, they were given a score of zero. A lower score on the SPPB is indicative of poorer physical function, and greater likelihood of disability. After completion of each movement task, participants were asked to provide a pain intensity rating for any movement-evoked pain experienced during completion of the balance, chair, and walking tests. The 0-100 numeric rating scale was utilized for this purpose as before. The SPPB is standardized and has been well validated for use in populations with CLBP (33).
Timed Up and Go (TUG).
The TUG task is a Centers for Disease Control-derived assessment to assess mobility (43). Participants were instructed to sit in a standard armchair, wear their regular footwear and use their walking aid if needed. A line on the floor was marked with tape 3 m away. Upon commencement, the participant was to stand up from the chair, walk to the line on the floor at their normal pace, turn around, walk back to the chair and sit down again. The experimenter used a stopwatch to measure the time it took for the participant to initiate movement to sitting back down in the seat completely. After completion of the task, participants were asked to provide a pain intensity rating for any movement-evoked pain experienced during completion using the 0-100 numerical rating scale.
Statistical Analysis
Due to the nature of the hypotheses and our previous work, all analyses were carried out with race and sex as variables. T-tests were performed to observe any differences in DII scores. Moderation analyses using linear regression were also performed with DII as the independent variable, pain sensitivity ratings for the tasks as the outcome variables, and race or sex as the moderator. Due to the biopsychosocial nature of pain, it was also important to control for covariates that have also been documented to influence the pain experience to gain a better understanding of the impact of DII score on pain outcomes (28, 29, 42). Thus, covariates considered were age, sex, race, caloric/energy intake, education and income. Three statistical models were utilized for each pain/difficulty rating; Model 1 contains DII as the sole covariate, Model 2 contains DII, sex, and the interaction between DII and sex adjusting for race, age, and caloric intake, Model 3 contains all elements of Model 2, but also adjusts for education and income. The three statistical models were repeated for each pain/difficulty rating with an interaction between DII and race instead of sex. From our sample size, a post-hoc power analysis containing all variables of interest from the parent study determined that we could detect a medium to large effect size with power of 80%. Covariates were not included in the a priori power analysis due to the nature of the research question and were later added to control for biased parameter estimates. The obtained R2 values indicate medium effect sizes for most of the interaction analyses. The remaining analyses were adequately powered for multiple regression with 6 predictors at .80, medium effect, and two-tailed. All analyses performed using SAS 9.4 (SAS Institute, Cary, NC).
Results
Participants
The sample included 78 participants, of whom 53.8% were female and 60% were NHB. Sixty percent of the participants had income above the poverty line, and 34.6% were college graduates or higher. The average age of the sample was 44.25 years (± 12.48 years), with average caloric intake of 1582.58 kcals/day (± 837.11 kcals/day). DII means (± standard deviations), based on sociodemographic groups can be seen in Table 1.
Table 1:
Characteristics of Participants Used in Analysis.
| Variable | Participants (N=78)* (%) |
DII Mean ± Standard Deviation |
|---|---|---|
| Sex | ||
| Female | 42 (53.8) | 2.54 ± 1.77 |
| Male | 36 (46.2) | 2.12 ± 1.84 |
| Race | ||
| Black | 46 (60.0) | 2.51 ± 1.82 |
| White | 32 (40.0) | 2.11 ± 1.78 |
| Age | 44.25 ± 12.48 | - |
| Caloric Intake (kcal/day) | 1582.58 ± 837.11 | - |
| Income | ||
| Above Poverty Line | 46(60.0) | 1.91± 1.80 |
| Below Poverty Line | 30 (38.5) | 2.87 ± 1.64 |
| Education | ||
| College Graduate and above | 27 (34.6) | 1.84 ± 2.05 |
| Partial College and below | 51 (65.4) | 2.61 ± 1.61 |
Note: Variables are displayed with the number of participants in each category with percent frequency of sample in parentheses. Continuous variables presented with mean ± standard deviations, not frequencies.
Moderation Analyses
DII, sex and pain outcomes.
A linear regression model was used to investigate whether the association between DII and pain outcomes varied by sex. After completion of moderation analyses accounting for all covariates, there were significant interactions between sex and DII in the movement-evoked pain tasks, with females reporting greater increases of pain scores per 1 unit change in DII, compared to males. For example, in the Bed Task, the interaction between sex and DII was significant (βfemale = 5.80, 95% CI 1.23, 10.37; βmale=−1.86, 95% CI −6.99, 3.27; pinteraction=0.0155) suggesting that for every 1 unit increase in DII score, there was a 5.8 point increase in pain intensity scores for females and a −1.86 point decrease for males (see Figure 2). The same pattern held for the Box Lift Task pain scores, GAIT pain scores, Balance Test pain scores, Chair Stand pain scores, and TUG pain scores, with females consistently reporting higher β scores than males, though some tasks did not reach significance. Changes in pain rating and difficulty for every 1-unit increase in DII by sex for all of the tasks can be seen in Tables 2 and 3, respectively. Overall, it is apparent that the association between DII and pain/difficulty scores varies by sex, with females showing the greatest impact of DII scores on pain, when compared to males.
Figure 2.

Representative graphs of A. Effect of DII on pain scores; B. Effect of DII on pain scores, stratified by sex with an interaction; and C. Effect of DII on pain scores stratified by race with no interaction.
Table 2:
Estimated Change in Pain Rating for a 1-Unit Increase in DII by Sex
| Task | Model* | Overall(95% CI) |
DII P- Value |
Male (95% CI) | Female (95% CI) |
Interaction P-Value |
R2 |
|---|---|---|---|---|---|---|---|
| Bed Task | Model 1 | 3.76(0.51,7.01) | 0.024 | - | - | - | 0.067 |
| Model 2 | - | - | −0.57(−5.52,4.38) | 6.97(2.53,11.42) | 0.0268 | 0.122 | |
| Model 3 | - | - | −1.55(−6.51,3.41) | 6.27(1.87,10.67) | 0.012 | 0.277 | |
| Model 4 | - | - | −1.86(−6.99,3.27) | 5.80(1.23,10.37) | 0.0155 | 0.290 | |
| Box Lift | Model 1 | 3.10(−0.08,6.29) | 0.056 | - | - | - | 0.054 |
| Model 2 | - | - | 0.62(−4.05,5.29) | 6.24(1.73,10.74) | 0.0885 | 0.110 | |
| Model 3 | - | - | 0.35(−4.43,5.14) | 6.23(1.79,10.7) | 0.0514 | 0.274 | |
| Model 4 | - | - | 0.20(−4.71,5.11) | 5.83(1.26,10.4) | 0.0616 | 0.287 | |
| Balance Test | Model 1 | 4.6(1.07,8.11) | 0.0112 | - | - | - | 0.062 |
| Model 2 | - | - | 2.25(−2.87,7.38) | 6.00(1.18,10.81) | 0.2922 | 0.105 | |
| Model 3 | - | - | 1.39(−3.96,6.73) | 4.72(−0.12,9.55) | 0.3124 | 0.248 | |
| Model 4 | - | - | 0.90(−4.63,6.43) | 4.43(−0.57,9.42) | 0.2905 | 0.249 | |
| GAIT | Model 1 | 3.07(−0.48,6.62) | 0.0892 | - | - | - | 0.032 |
| Model 2 | - | - | −1.19(−6.35,3.98) | 6.68(1.83,11.53) | 0.0299 | 0.101 | |
| Model 3 | - | - | −2.03(−7.47,3.41) | 6.47(1.56,11.4) | 0.0129 | 0.224 | |
| Model 4 | - | - | −2.40(−8.07,3.26) | 6.11(0.99,11.23) | 0.0145 | 0.230 | |
| Chair Stand | Model 1 | 3.59(−0.06,7.23) | 0.0538 | - | - | - | 0.039 |
| Model 2 | - | - | 1.08(−4.23,6.38) | 5.44(−0.62,10.25) | 0.2286 | 0.140 | |
| Model 3 | - | - | −0.58(−6.08,4.93) | 4.89(−0.09,9.88) | 0.115 | 0.228 | |
| Model 4 | - | - | −1.26(−6.97,4.44) | 4.42(−0.76,9.61) | 0.1054 | 0.236 | |
| TUG | Model 1 | 1.9(−1.48,5.29) | 0.2655 | - | - | - | 0.012 |
| Model 2 | - | - | −1.06(−6.04,3.92) | 4.78(0.11,9.46) | 0.0925 | 0.088 | |
| Model 3 | - | - | −0.72(−6.06,4.61) | 5.12(0.29,9.95) | 0.0775 | 0.168 | |
| Model 4 | - | - | −0.58(−6.09,4.93) | 5.10(0.11,10.08) | 0.0897 | 0.19 |
All models use linear regression with pain rating as the outcome. Model 1 contains DII as the sole covariate. Model 2 contains DII, Sex, and an interaction term between sex and DII. Model 3 contains DII, Sex, and the interaction between DII and Sex adjusting for race, age, and calorific intake. Model 4 contains all elements of Model 2, but also adjusts for education and income.
Table 3:
Estimated Change in Difficulty Rating for a 1-Unit Increase in DII by Sex
| Task | Model* | Overall(95% CI) |
DII P- Value |
Male (95% CI) |
Female (95% CI) |
Interaction P-Value |
R2 |
|---|---|---|---|---|---|---|---|
| Bed Task | Model 1 | 5.18(1.49,8.86) | 0.007 | - | - | - | 0.097 |
| Model 2 | - | - | 2.58(−2.97,8.14) | 7.84(2.85,12.84) | 0.1650 | 0.135 | |
| Model 3 | - | - | 1.78(−3.90,7.48) | 7.47(2.46,12.49) | 0.1078 | 0.296 | |
| Model 4 | - | - | 1.32(−4.43,7.07) | 6.67(1.57,11.78) | 0.1292 | 0.313 | |
| Box Lift | Model 1 | 3.06(−0.17,6.3) | 0.0626 | - | - | - | 0.047 |
| Model 2 | - | - | 0.59(−3.97,5.15) | 5.93(1.54,10.33) | 0.097 | 0.123 | |
| Model 3 | - | - | −0.76(−5.42,3.89) | 4.91(0.62,9.21) | 0.054 | 0.308 | |
| Model 4 | - | - | −1.27(−6.16,3.23) | 4.30(−0.07,8.67) | 0.046 | 0.326 | |
| Balance Test | Model 1 | 2.82(−0.62,6.26) | 0.1064 | - | - | - | 0.035 |
| Model 2 | - | - | 0.66(−4.33,5.66) | 5.34(0.65,10.04) | 0.178 | 0.088 | |
| Model 3 | - | - | −0.72(−5.78,4.33) | 4.21(−0.34,8.77) | 0.1166 | 0.293 | |
| Model 4 | - | - | −1.26(−6.34,3.81) | 3.19(−1.40,7.78) | 0.148 | 0.323 | |
| GAIT | Model 1 | 3.74(0.92,6.57) | 0.01 | - | - | - | 0.059 |
| Model 2 | - | - | 1.36(−2.62,5.34) | 4.89(1.15,8.63) | 0.2035 | 0.110 | |
| Model 3 | - | - | 1.28(−2.97,5.53) | 4.25(0.41,8.10) | 0.2573 | 0.257 | |
| Model 4 | - | - | 0.23(−3.96,4.41) | 3.38(−0.41,7.16) | 0.2133 | 0.291 | |
| Chair Stand | Model 1 | 3.14(−0.33,6.62) | 0.0753 | - | - | - | 0.031 |
| Model 2 | - | - | 1.82(−3.34,6.97) | 3.91(−0.76,8.59) | 0.5502 | 0.103 | |
| Model 3 | - | - | −0.03(−4.98,4.91) | 3.21(−1.27,7.69) | 0.2953 | 0.300 | |
| Model 4 | - | - | −0.49(−5.66,4.69) | 2.86(−1.84,7.56) | 0.2896 | 0.302 | |
| TUG | Model 1 | 2.65(−0.27,5.58) | 0.0746 | - | - | - | 0.042 |
| Model 2 | - | - | 2.17(−2.12,6.47) | 3.61(−0.43,7.64) | 0.6289 | 0.074 | |
| Model 3 | - | - | 1.37(−3.00,5.73) | 2.87(−1.06,6.81) | 0.577 | 0.276 | |
| Model 4 | - | - | 0.81(−3.67,5.30) | 2.86(−1.19,6.91) | 0.4494 | 0.285 |
All models use linear regression with difficulty rating as the outcome. Model 1 contains DII as the sole covariate. Model 2 contains sex, DII, and an interaction between sex and DII. Model 3 contains DII, Sex, and the interaction between DII and Sex adjusting for race, age, and calorific intake. Model 4 contains all elements of Model 2, but also adjusts for education and income.
DII, race and pain outcomes.
There were no statistically significant interactions to report between DII and race on the pain or difficulty scores for any task. Changes in pain or difficulty rating and for every 1-unit increase in DII by race can be seen in Tables 4 and 5, respectively. Overall, it is apparent that the association between DII and pain/difficulty scores does not vary by race in our sample.
Table 4:
Estimated Change in Pain Rating for a 1-Unit Increase in DII by Race
| Task | Model* | Overall(95% CI) |
DII P- Value |
Black (95% CI) | White (95% CI) | Interaction P-Value |
R2 |
|---|---|---|---|---|---|---|---|
| Bed Task | Model 1 | 3.76(0.51,7.01) | 0.024 | - | - | - | 0.067 |
| Model 2 | - | - | 4.52(0.36,8.69) | 0.74(−4.49,5.99) | 0.2641 | 0.138 | |
| Model 3 | - | - | 4.37(−0.16,8.89) | 0.79(−4.54,6.12) | 0.2736 | 0.206 | |
| Model 4 | - | - | 4.11(−0.58,8.81) | 0.19(−5.33,5.70) | 0.2398 | 0.225 | |
| Box Lift | Model 1 | 3.10(−0.08,6.29) | 0.056 | - | - | - | 0.054 |
| Model 2 | - | - | 3.74(−0.39,7.88) | 2.10(−2.74,6.93) | 0.6071 | 0.158 | |
| Model 3 | - | - | 3.88(−0.62,8.38) | 3.16(−1.89,8.20) | 0.8157 | 0.24 | |
| Model 4 | - | - | 3.97(−0.68,8.62) | 2.36(−2.83,7.56) | 0.6102 | 0.254 | |
| Balance Test | Model 1 | 4.6(1.07,8.11) | 0.0112 | - | - | - | 0.062 |
| Model 2 | - | - | 5.46(1.09,9.83) | 0.68(−4.56,5.92) | 0.1688 | 0.174 | |
| Model 3 | - | - | 5.32(0.57,10.06) | 0.40(−5.03,5.83) | 0.1401 | 0.251 | |
| Model 4 | - | - | 4.81(−0.12,9.74) | 0.16(−5.52,5.84) | 0.1751 | 0.253 | |
| GAIT | Model 1 | 3.07(−0.48,6.62) | 0.0892 | - | - | - | 0.032 |
| Model 2 | - | - | 3.58(−0.90,8.06) | 0.67(−4.70,6.05) | 0.4107 | 0.140 | |
| Model 3 | - | - | 3.91(−1.15,8.98) | 1.11(−4.69,6.91) | 0.4289 | 0.171 | |
| Model 4 | - | - | 3.64(−1.64,8.92) | 0.64(−5.44,6.73) | 0.412 | 0.180 | |
| Chair Stand | Model 1 | 3.59(−0.06,7.23) | 0.0538 | - | - | - | 0.039 |
| Model 2 | - | - | 3.12(−1.84,8.15) | 2.47(−3.03,7.97) | 0.8601 | 0.072 | |
| Model 3 | - | - | 2.57(−2.53,7.66) | 2.36(−3.29,8.02) | 0.9541 | 0.204 | |
| Model 4 | - | - | 1.89(−3.46,7.24) | 1.95(−3.93,7.84) | 0.9861 | 0.212 | |
| TUG | Model 1 | 1.9(−1.48,5.29) | 0.2655 | - | - | - | 0.012 |
| Model 2 | - | - | 2.68(−1.74,7.09) | −0.59(−5.89,4.71) | 0.3478 | 0.089 | |
| Model 3 | - | - | 3.96(−0.90,8.81) | 0.61(−4.94,6.17) | 0.325 | 0.146 | |
| Model 4 | - | - | 4.09(−0.92,9.10) | 0.53(−5.23,6.30) | 0.3046 | 0.173 |
All models use linear regression with pain rating as the outcome. Model 1 contains DII as the sole covariate. Model 2 contains DII, race, and an interaction term between DII and race. Model 3 contains DII, race, and the interaction between DII and race adjusting for sex, age, and calorific intake. Model 4 contains all elements of Model 2, but also adjusts for education and income.
Table 5:
Estimated Change in Difficulty Rating for a 1-Unit Increase in DII by Race
| Task | Model* | Overall(95% CI) |
DII P- Value |
Black (95% CI) |
White (95% CI) | Interaction P- Value |
R2 |
|---|---|---|---|---|---|---|---|
| Bed Task | Model 1 | 5.18(1.49,8.86) | 0.007 | - | - | - | 0.097 |
| Model 2 | - | - | 6.72(2.24,11.20) | 1.22(−4.42,6.95) | 0.1321 | 0.221 | |
| Model 3 | - | - | 6.99(2.11,11.88) | 1.91(−3.85,7.67) | 0.151 | 0.281 | |
| Model 4 | - | - | 6.78(1.80,11.77) | 0.84(−5.02,6.70) | 0.0953 | 0.317 | |
| Box Lift | Model 1 | 3.06(−0.17,6.3) | 0.0626 | - | - | - | 0.047 |
| Model 2 | - | - | 4.06(0.08,8.05) | 0.94(−3.71,5.59) | 0.3125 | 0.193 | |
| Model 3 | - | - | 3.25(−1.02,7.51) | 0.94(−3.85,5.72) | 0.4333 | 0.276 | |
| Model 4 | - | - | 2.96(−1.49,7.40) | 0.01(−4.95,4.97) | 0.3287 | 0.298 | |
| Balance Test | Model 1 | 2.82(−0.62,6.26) | 0.1064 | - | - | - | 0.035 |
| Model 2 | - | - | 4.73(0.48,8.98) | −0.89(−5.99,5.23) | 0.0955 | 0.162 | |
| Model 3 | - | - | 4.62(0.18,9.06) | −1.00(−6.08,4.08) | 0.0729 | 0.295 | |
| Model 4 | - | - | 3.66(−0.85,8.16) | -2.17(−7.36,3.02) | 0.0641 | 0.331 | |
| GAIT | Model 1 | 3.74(0.92,6.57) | 0.01 | - | - | - | 0.059 |
| Model 2 | - | - | 4.27(0.87,7.68) | 0.32(−3.76,4.40) | 0.1427 | 0.174 | |
| Model 3 | - | - | 4.80(1.04,8.56) | 0.38(−3.93,4.68) | 0.0948 | 0.258 | |
| Model 4 | - | - | 3.80(0.08,7.52) | −0.55(−4.84,3.73) | 0.093 | 0.300 | |
| Chair Stand | Model 1 | 3.14(−0.33,6.62) | 0.0753 | - | - | - | 0.031 |
| Model 2 | - | - | 4.07(−0.54,8.68) | 0.01(−5.04,5.06) | 0.2398 | 0.136 | |
| Model 3 | - | - | 3.20(−1.29,7.70) | −0.04(−5.01,4.95) | 0.3029 | 0.301 | |
| Model 4 | - | - | 2.74(−2.00,7.50) | −0.33(−5.55,4.90) | 0.3429 | 0.304 | |
| TUG | Model 1 | 2.65(−0.27,5.58) | 0.0746 | - | - | - | 0.042 |
| Model 2 | - | - | 4.01(0.47,7.54) | −0.28(−4.52,3.96) | 0.1263 | 0.204 | |
| Model 3 | - | - | 4.08(0.26,7.90) | −0.02(−4.39,4.35) | 0.1273 | 0.296 | |
| Model 4 | - | - | 3.75(−0.21,7.71) | −0.57(−5.13,4.00) | 0.1174 | 0.31 |
All models use linear regression with difficulty rating as the outcome. Model 1 contains DII as the sole covariate. Model 2 contains DII, race, and an interaction between DII and race. Model 3 contains DII, race, and the interaction between DII and race adjusting for sex, age, and calorific intake. Model 4 contains all elements of Model 2, but also adjusts for education and income.
Discussion
Chronic pain is a significant problem in Western society that differentially affects distinct sociodemographic groups (10, 13, 15, 36). Here, we showed that, in a sample of individuals with CLBP, increases in DII were associated with increased pain scores in various movement-evoked pain tasks. In addition, the DII scores differentially impacted pain experienced from evoked tasks based on sex with females showing greater impacts of diet on pain experience. We (4, 12, 52, 53, 55), and others (18, 30, 34, 35, 37, 45, 46), have shown sex differences in pain processing in rodents and humans, but this is the first assessment of the DII on movement-evoked pain. The DII is a population-based, empirically derived index that evaluates the potential pro- or anti-inflammatory effects of dietary intake. Unlike the Healthy Eating Index, the United States Dietary Guidelines, or the Dietary Approaches to Stop Hypertension (DASH) scores, the DII was designed to incorporate research from diverse populations using an array of study designs and assessment tools (65). While the foods influencing an individual’s personal DII score will be unique, in general, consuming foods containing high amounts of refined carbohydrates, alcohol, saturated and trans fats will contribute to more positive, pro-inflammatory scores. On the other hand, foods containing high amounts of bioflavonoids, fiber, vitamins, minerals and healthy PUFAs will contribute to a more negative, or anti-inflammatory, score. The net positive/negative score is representative of greater consumption of either pro- or anti-inflammatory foods. Complete details describing the statistical methods deriving the DII, including foods and weighting properties, can be found elsewhere as outlined by the original authors (22). Studies have shown that the 1-unit DII changes are reflective of differences seen in inflammatory biomarkers and other health-related outcomes (1, 25, 31, 47, 49) strengthening the validity of this measure.
The relationship between pain and diet is well-documented, and there are many elements of the diet that have been reported to activate immune cells and trigger an inflammatory response (41, 60). Excess dietary oils and fatty acids have been shown to participate in lipid oxidation, leading to reactive oxygen species (ROS) and subsequent inflammation (21). Omega-6 PUFAs, such as linoleic and arachidonic acid are precursors for inflammatory prostaglandins (5), and are more often consumed in much higher amounts than anti-inflammatory omega-3 fatty acids (7). Excess carbohydrates increase the presence of Advanced Glycation End Products (AGEs) that bind to immune cells and stimulate a pro-inflammatory response (11). For illustration, subjects fed a carbohydrate-rich breakfast showed significant increases in oxidative stress only hours later (14). In addition, male subjects who consumed a carbohydrate-rich diet for one week showed elevated markers of oxidative stress (8). ROS produced from metabolism have also been shown to bind to the transient receptor potential cation channel subfamily A member 1 (TRPA1) receptor, directly stimulating pain-sensing nociceptors (38). Together, dietary intake can have a pro-inflammatory effect on the body that is meant to be captured in the DII scores. However, there are other biopsychosocial factors influencing diet and metabolic response to nutrients that could explain some of the differences seen within varying sociodemographic groups.
In addition to pro-inflammatory effects, a diet can have anti-inflammatory effects as well. Studies examining a Mediterranean diet have shown that this diet pattern can reduce markers of inflammation in obese individuals (16) and in patients with osteoarthritis (63) or rheumatoid arthritis (32, 51). Interestingly, one study found that the patients on a Mediterranean diet showed significant reductions in inflammatory markers prior to weight loss (44), suggesting that the diet itself was responsible. In our previous clinical trial of adults with knee pain, we showed that a low-carbohydrate diet reduced daily self-reported pain, evoked pain, and oxidative stress, independent of weight loss (57). These data support our hypothesis that diet quality, and not weight loss, has the greatest impact on functional measures of pain, a finding reinforced by a meta-analysis (51). Thus, the link between dietary intake, inflammation/oxidative stress and pain experience is strengthened.
Here we showed that the relationship between sex and pain could be, in part, moderated by diet. Interestingly, DII scores did not significantly differ between males and females despite differential impacts on experienced pain. Given the known differences in various biological systems between males and females, it is possible that the ways in which males and females process and respond to dietary metabolites may be driving underlying effect of diet. For example, differences in the make-up of the gut microbiome between males and females have been reported, even when they follow the same dietary pattern (9). These differences in the gut can lead to different metabolic responses and by-products of food stuffs, potentially activating the immune system in distinct ways (26). We have documented sex differences related to pain processing (53, 54) and it is possible that females may be more susceptible to environmental immune system triggers. In this case, differences in the make-up of the gut microbiome and subsequent metabolic products of nutrients could be enough to activate the immune system and exacerbate inflammation and pain (39).
In the context of race, there is literature that suggests that food intake varies between racial groups (19), but it should be noted that these data can vary based on the study location. In the present study, the sample populations did not differ in their intake of macronutrients (data not shown), and DII scores were comparable between NHWs and NHBs. Unlike males and females, who show metabolic differences to similar diet patterns, the literature is lacking in physiological differences in response to dietary patterns between racial groups, as most research focuses primarily on food-choice behavior (3).
There are a number of factors that may have impacted our findings. There is variability in recollection and reporting when using a 24-hour Food Recall to collect dietary information. While we enacted measures to minimize these effects (i.e., standardized tools and containers to help measure portion sizes), we acknowledge that any self-reported food intake questionnaire is subject to variability. Our sample included only two racial groups and two sexes. Future studies should endeavor to increase the diversity of the sample to include more racial groups, as well as sexual minority groups. In addition, examining the impact of DII scores on movement-evoked pain in other chronic pain conditions will assess the generalizability of the relationships. Finally, while the COVID-19 pandemic did not seem to impact study retention, we acknowledge that it may have affected the diversity of our sample as various individuals may not have been able to participate for a variety of reasons (e.g. at-risk individuals, frontline workers).
CLBP is a devastating and highly debilitating painful disorder that affects a large number of individuals in the United States. We have shown a relationship between diet patterns and risk for pain (56). Our current data support the notion that dietary quality may have an effect on pain outcomes in CLBP and that these outcomes may differentially affect individuals based on sex. Thus, it is important for clinicians to include an assessment of dietary patterns when treating patients, as diet may be working counter to treatments. Furthermore, alterations to anti-inflammatory diets may substantially reduce movement-evoked pain, as seen in our earlier work (57). Importantly, diets are a highly-modifiable factor that contribute directly to health and, in the case of anti-inflammatory diets, may be accompanied by reductions in pain, inflammation, metabolic risk and cardiovascular risk factors. Together, the clinical significance of dietary alteration can have a major impact on health and well-being.
Highlights:
In our sample of CLBP, DII was not different by race or sex.
DII scores had a greater impact on pain severity ratings for women.
Inflammation from diet may have differential effects based on biological sex.
Funding:
This work was supported by the National Institutes of Health grant R01MD010441.
Footnotes
Disclosures: The authors have no conflicts of interest to disclose.
Publisher's Disclaimer: This is a PDF file of an unedited manuscript that has been accepted for publication. As a service to our customers we are providing this early version of the manuscript. The manuscript will undergo copyediting, typesetting, and review of the resulting proof before it is published in its final form. Please note that during the production process errors may be discovered which could affect the content, and all legal disclaimers that apply to the journal pertain.
References
- 1.Adjibade M, Andreeva VA, Lemogne C, Touvier M, Shivappa N, Hébert JR, Wirth MD, Hercberg S, Galan P, Julia C, Assmann KE, Kesse-Guyot E. The Inflammatory Potential of the Diet Is Associated with Depressive Symptoms in Different Subgroups of the General Population. The Journal of nutrition. 147:879–87, 2017. [DOI] [PMC free article] [PubMed] [Google Scholar]
- 2.Aroke EN, Powell-Roach KL, Jaime-Lara RB, Tesfaye M, Roy A, Jackson P, Joseph PV. Taste the Pain: The Role of TRP Channels in Pain and Taste Perception. Int J Mol Sci. 21, 2020. [DOI] [PMC free article] [PubMed] [Google Scholar]
- 3.Bahr PR. Race and nutrition: an investigation of Black-White differences in health-related nutritional behaviours. Sociology of Health & Illness. 29:831–56, 2007. [DOI] [PubMed] [Google Scholar]
- 4.Bartley EJ, King CD, Sibille KT, Cruz-Almeida Y, Riley JL 3rd, Glover TL, Goodin BR, Sotolongo AS, Herbert MS, Bulls HW, Staud R, Fessler BJ, Redden DT, Bradley LA, Fillingim RB. Enhanced Pain Sensitivity Among Individuals With Symptomatic Knee Osteoarthritis: Potential Sex Differences in Central Sensitization. Arthritis care & research. 68:472–80, 2016. [DOI] [PMC free article] [PubMed] [Google Scholar]
- 5.Belury MA, Harris WS. Omega-6 fatty acids, inflammation and cardiometabolic health: Overview of supplementary issue. Prostaglandins, leukotrienes, and essential fatty acids. 139:1–2, 2018. [DOI] [PubMed] [Google Scholar]
- 6.Beyera GK, O'Brien J, Campbell S. Health-care utilisation for low back pain: a systematic review and meta-analysis of population-based observational studies. Rheumatol Int. 39:1663–79, 2019. [DOI] [PubMed] [Google Scholar]
- 7.Blasbalg TL, Hibbeln JR, Ramsden CE, Majchrzak SF, Rawlings RR. Changes in consumption of omega-3 and omega-6 fatty acids in the United States during the 20th century. The American journal of clinical nutrition. 93:950–62, 2011. [DOI] [PMC free article] [PubMed] [Google Scholar]
- 8.Boden G, Homko C, Barrero CA, Stein TP, Chen X, Cheung P, Fecchio C, Koller S, Merali S. Excessive caloric intake acutely causes oxidative stress, GLUT4 carbonylation, and insulin resistance in healthy men. Sci Transl Med. 7:304re7, 2015. [DOI] [PMC free article] [PubMed] [Google Scholar]
- 9.Bolnick DI, Snowberg LK, Hirsch PE, Lauber CL, Org E, Parks B, Lusis AJ, Knight R, Caporaso JG, Svanbäck R. Individual diet has sex-dependent effects on vertebrate gut microbiota. Nature Communications. 5:4500, 2014. [DOI] [PMC free article] [PubMed] [Google Scholar]
- 10.Bonham VL. Race, ethnicity, and pain treatment: striving to understand the causes and solutions to the disparities in pain treatment. J Law Med Ethics. 29:52–68, 2001. [DOI] [PubMed] [Google Scholar]
- 11.Brenner T, Fleming TH, Spranz D, Schemmer P, Bruckner T, Uhle F, Martin EO, Weigand MA, Hofer S. Reactive metabolites and AGE-RAGE-mediated inflammation in patients following liver transplantation. Mediators of inflammation. 2013:501430, 2013. [DOI] [PMC free article] [PubMed] [Google Scholar]
- 12.Bulls HW, Freeman EL, Anderson AJ, Robbins MT, Ness TJ, Goodin BR. Sex differences in experimental measures of pain sensitivity and endogenous pain inhibition. Journal of pain research. 8:311–20, 2015. [DOI] [PMC free article] [PubMed] [Google Scholar]
- 13.Carey TS, Freburger JK, Holmes GM, Jackman A, Knauer S, Wallace A, Darter J. Race, care seeking, and utilization for chronic back and neck pain: population perspectives. The journal of pain : official journal of the American Pain Society. 11:343–50, 2010. [DOI] [PMC free article] [PubMed] [Google Scholar]
- 14.Devaraj S, Wang-Polagruto J, Polagruto J, Keen CL, Jialal I. High-fat, energy-dense, fast-food-style breakfast results in an increase in oxidative stress in metabolic syndrome. Metabolism: clinical and experimental. 57:867–70, 2008. [DOI] [PMC free article] [PubMed] [Google Scholar]
- 15.Elliott AM, Smith BH, Penny KI, Smith WC, Chambers WA. The epidemiology of chronic pain in the community. Lancet. 354:1248–52, 1999. [DOI] [PubMed] [Google Scholar]
- 16.Estruch R Anti-inflammatory effects of the Mediterranean diet: the experience of the PREDIMED study. The Proceedings of the Nutrition Society. 69:333–40, 2010. [DOI] [PubMed] [Google Scholar]
- 17.Feskanich D, Sielaff BH, Chong K, Buzzard IM. Computerized collection and analysis of dietary intake information. Comput Methods Programs Biomed. 30:47–57, 1989. [DOI] [PubMed] [Google Scholar]
- 18.Girard-Tremblay L, Auclair V, Daigle K, Leonard G, Whittingstall K, Goffaux P. Sex differences in the neural representation of pain unpleasantness. The journal of pain : official journal of the American Pain Society. 15:867–77, 2014. [DOI] [PubMed] [Google Scholar]
- 19.Gray MS, Lakkur S, Howard VJ, Pearson K, Shikany JM, Safford M, Gutierrez OM, Colabianchi N, & Judd SE The Association between Residence in a Food Desert Census Tract and Adherence to Dietary Patterns in the REGARDS Cohort. Food and Public Health. 8:79–85, 2018. [PMC free article] [PubMed] [Google Scholar]
- 20.Guralnik JM, Simonsick EM, Ferrucci L, Glynn RJ, Berkman LF, Blazer DG, Scherr PA, Wallace RB. A short physical performance battery assessing lower extremity function: association with self-reported disability and prediction of mortality and nursing home admission. Journal of gerontology. 49:M85–94, 1994. [DOI] [PubMed] [Google Scholar]
- 21.Haggag Mel S, Elsanhoty RM, Ramadan MF. Impact of dietary oils and fats on lipid peroxidation in liver and blood of albino rats. Asian Pac J Trop Biomed. 4:52–8, 2014. [DOI] [PMC free article] [PubMed] [Google Scholar]
- 22.Hébert JR, Shivappa N, Wirth MD, Hussey JR, Hurley TG. Perspective: The Dietary Inflammatory Index (DII)-Lessons Learned, Improvements Made, and Future Directions. Adv Nutr. 10:185–95, 2019. [DOI] [PMC free article] [PubMed] [Google Scholar]
- 23.Iizuka Y, Iizuka H, Mieda T, Tsunoda D, Sasaki T, Tajika T, Yamamoto A, Takagishi K. Prevalence of Chronic Nonspecific Low Back Pain and Its Associated Factors among Middle-Aged and Elderly People: An Analysis Based on Data from a Musculoskeletal Examination in Japan. Asian Spine J. 11:989–97, 2017. [DOI] [PMC free article] [PubMed] [Google Scholar]
- 24.Jackson P, Goodin BR, Long DL, Jablonski R, Penn TM, Sims AM, Quinn T, Overstreet DS, Kempf MC, Rumble DD, Aroke EN. The Area Deprivation Index Corresponds Effectively With Other Measures of Objective Socioeconomic Status in Adults With Chronic Low Back Pain. J Nurs Meas. 2021. [DOI] [PMC free article] [PubMed] [Google Scholar]
- 25.Julia C, Assmann KE, Shivappa N, Hebert JR, Wirth MD, Hercberg S, Touvier M, Kesse-Guyot E. Long-term associations between inflammatory dietary scores in relation to long-term C-reactive protein status measured 12 years later: findings from the Supplémentation en Vitamines et Minéraux Antioxydants (SU.VI.MAX) cohort. Br J Nutr. 117:306–14, 2017. [DOI] [PubMed] [Google Scholar]
- 26.Kau AL, Ahern PP, Griffin NW, Goodman AL, Gordon JI. Human nutrition, the gut microbiome and the immune system. Nature. 474:327–36, 2011. [DOI] [PMC free article] [PubMed] [Google Scholar]
- 27.Kim LH, Vail D, Azad TD, Bentley JP, Zhang Y, Ho AL, Fatemi P, Feng A, Varshneya K, Desai M, Veeravagu A, Ratliff JK. Expenditures and Health Care Utilization Among Adults With Newly Diagnosed Low Back and Lower Extremity Pain. JAMA Network Open. 2:e193676–e, 2019. [DOI] [PMC free article] [PubMed] [Google Scholar]
- 28.Koleck M, Mazaux J-M, Rascle N, Bruchon-Schweitzer M. Psycho-social factors and coping strategies as predictors of chronic evolution and quality of life in patients with low back pain: A prospective study. European journal of pain. 10:1–11, 2006. [DOI] [PubMed] [Google Scholar]
- 29.Lauren KD, Marcel ED, Lucas GF, Siny T, Emily ES- S, Hasan FJ, Shauna PS, Matthew RT, Christopher DS, Aaron L, Russell S, Fan Y, Jacob PB, Edward CN, Bhiken IN. Influence of catastrophizing, anxiety, and depression on in-hospital opioid consumption, pain, and quality of recovery after adult spine surgery. Journal of Neurosurgery: Spine SPI. 28:119–26, 2018. [DOI] [PMC free article] [PubMed] [Google Scholar]
- 30.Mapplebeck JC, Beggs S, Salter MW. Sex differences in pain: a tale of two immune cells. Pain. 157 Suppl 1:S2–6, 2016. [DOI] [PubMed] [Google Scholar]
- 31.McCullough LE, Miller EE, Calderwood LE, Shivappa N, Steck SE, Forman MR, A Mendez M, Maguire R, Fuemmeler BF, Kollins SH, D Bilbo S, Huang Z, Murtha AP, Murphy SK, Hébert JR, Hoyo C. Maternal inflammatory diet and adverse pregnancy outcomes: Circulating cytokines and genomic imprinting as potential regulators? Epigenetics. 12:688–97, 2017. [DOI] [PMC free article] [PubMed] [Google Scholar]
- 32.McKellar G, Morrison E, McEntegart A, Hampson R, Tierney A, Mackle G, Scoular J, Scott JA, Capell HA. A pilot study of a Mediterranean-type diet intervention in female patients with rheumatoid arthritis living in areas of social deprivation in Glasgow. Annals of the rheumatic diseases. 66:1239–43, 2007. [DOI] [PMC free article] [PubMed] [Google Scholar]
- 33.Medina-Mirapeix F, Bernabeu-Mora R, Llamazares-Herran E, Sanchez-Martinez MP, Garcia-Vidal JA, Escolar-Reina P. Interobserver Reliability of Peripheral Muscle Strength Tests and Short Physical Performance Battery in Patients With Chronic Obstructive Pulmonary Disease: A Prospective Observational Study. Arch Phys Med Rehabil. 97:2002–5, 2016. [DOI] [PubMed] [Google Scholar]
- 34.Mogil JS. Sex differences in pain and pain inhibition: multiple explanations of a controversial phenomenon. Nature reviews Neuroscience. 13:859–66, 2012. [DOI] [PubMed] [Google Scholar]
- 35.Monroe TB, Fillingim RB, Bruehl SP, Rogers BP, Dietrich MS, Gore JC, Atalla SW, Cowan RL. Sex Differences in Brain Regions Modulating Pain Among Older Adults: A Cross-Sectional Resting State Functional Connectivity Study. Pain medicine. 2017. [DOI] [PMC free article] [PubMed] [Google Scholar]
- 36.Nguyen M, Ugarte C, Fuller I, Haas G, Portenoy RK. Access to care for chronic pain: racial and ethnic differences. The journal of pain : official journal of the American Pain Society. 6:301–14, 2005. [DOI] [PubMed] [Google Scholar]
- 37.Nicotra L, Tuke J, Grace PM, Rolan PE, Hutchinson MR. Sex differences in mechanical allodynia: how can it be preclinically quantified and analyzed? Frontiers in behavioral neuroscience. 8:40, 2014. [DOI] [PMC free article] [PubMed] [Google Scholar]
- 38.Old EA, Nadkarni S, Grist J, Gentry C, Bevan S, Kim KW, Mogg AJ, Perretti M, Malcangio M. Monocytes expressing CX3CR1 orchestrate the development of vincristine-induced pain. The Journal of clinical investigation. 124:2023–36, 2014. [DOI] [PMC free article] [PubMed] [Google Scholar]
- 39.Peirce JM, Alviña K. The role of inflammation and the gut microbiome in depression and anxiety. Journal of Neuroscience Research. 97:1223–41, 2019. [DOI] [PubMed] [Google Scholar]
- 40.Penn TM, Overstreet DS, Aroke EN, Rumble DD, Sims AM, Kehrer CV, Michl AN, Hasan FN, Quinn TL, Long DL, Trost Z, Morris MC, Goodin BR. Perceived Injustice Helps Explain the Association Between Chronic Pain Stigma and Movement-Evoked Pain in Adults with Nonspecific Chronic Low Back Pain. Pain medicine. 21:3161–71, 2020. [DOI] [PMC free article] [PubMed] [Google Scholar]
- 41.Philpot U, Johnson MI. Diet therapy in the management of chronic pain: better diet less pain? Pain Management. 9:335–8, 2019. [DOI] [PubMed] [Google Scholar]
- 42.Prego-Domínguez J, Khazaeipour Z, Mallah N, Takkouche B. Socioeconomic status and occurrence of chronic pain: a meta-analysis. Rheumatology. 60:1091–105, 2021. [DOI] [PubMed] [Google Scholar]
- 43.Prevention CfDCa. Timed Up and Go (TUG). In: STEADI, editor.: National Center for Injury Prevention and Control; 2017. [Google Scholar]
- 44.Richard C, Couture P, Desroches S, Lamarche B. Effect of the Mediterranean diet with and without weight loss on markers of inflammation in men with metabolic syndrome. Obesity. 21:51–7, 2013. [DOI] [PubMed] [Google Scholar]
- 45.Ross JL, Queme LF, Lamb JE, Green KJ, Jankowski MP. Sex differences in primary muscle afferent sensitization following ischemia and reperfusion injury. Biology of sex differences. 9:2, 2018. [DOI] [PMC free article] [PubMed] [Google Scholar]
- 46.Rovner GS, Sunnerhagen KS, Bjorkdahl A, Gerdle B, Borsbo B, Johansson F, Gillanders D. Chronic pain and sex-differences; women accept and move, while men feel blue. PloS one. 12:e0175737, 2017. [DOI] [PMC free article] [PubMed] [Google Scholar]
- 47.Shivappa N, Hébert JR, Askari F, Kardoust Parizi M, Rashidkhani B. Increased Inflammatory Potential of Diet is Associated with Increased Risk of Prostate Cancer in Iranian Men. Int J Vitam Nutr Res. 86:161–8, 2016. [DOI] [PubMed] [Google Scholar]
- 48.Shivappa N, Steck SE, Hurley TG, Hussey JR, Hébert JR. Designing and developing a literature-derived, population-based dietary inflammatory index. Public health nutrition. 17:1689–96, 2014. [DOI] [PMC free article] [PubMed] [Google Scholar]
- 49.Shivappa N, Stubbs B, Hébert JR, Cesari M, Schofield P, Soysal P, Maggi S, Veronese N. The Relationship Between the Dietary Inflammatory Index and Incident Frailty: A Longitudinal Cohort Study. J Am Med Dir Assoc. 19:77–82, 2018. [DOI] [PMC free article] [PubMed] [Google Scholar]
- 50.Shmagel A, Foley R, Ibrahim H. Epidemiology of Chronic Low Back Pain in US Adults: Data From the 2009-2010 National Health and Nutrition Examination Survey. Arthritis care & research. 68:1688–94, 2016. [DOI] [PMC free article] [PubMed] [Google Scholar]
- 51.Skoldstam L, Brudin L, Hagfors L, Johansson G. Weight reduction is not a major reason for improvement in rheumatoid arthritis from lacto-vegetarian, vegan or Mediterranean diets. Nutrition journal. 4:15, 2005. [DOI] [PMC free article] [PubMed] [Google Scholar]
- 52.Sorge RE, LaCroix-Fralish ML, Tuttle AH, Sotocinal SG, Austin JS, Ritchie J, Chanda ML, Graham AC, Topham L, Beggs S, Salter MW, Mogil JS. Spinal cord Toll-like receptor 4 mediates inflammatory and neuropathic hypersensitivity in male but not female mice. The Journal of neuroscience : the official journal of the Society for Neuroscience. 31:15450–4, 2011. [DOI] [PMC free article] [PubMed] [Google Scholar]
- 53.Sorge RE, Mapplebeck JC, Rosen S, Beggs S, Taves S, Alexander JK, Martin LJ, Austin JS, Sotocinal SG, Chen D, Yang M, Shi XQ, Huang H, Pillon NJ, Bilan PJ, Tu Y, Klip A, Ji RR, Zhang J, Salter MW, Mogil JS. Different immune cells mediate mechanical pain hypersensitivity in male and female mice. Nature neuroscience. 2015. [DOI] [PMC free article] [PubMed] [Google Scholar]
- 54.Sorge RE, Strath LJ. Sex Differences in Pain Responses. Current Opinion in Physiology. 6:75–81, 2018. [Google Scholar]
- 55.Sorge RE, Totsch SK. Sex Differences in Pain. J Neurosci Res. 95:1271–81, 2017. [DOI] [PubMed] [Google Scholar]
- 56.Strath LJ, Brooks MS, Sorge RE, Judd SE. Relationship between diet and relative risk of pain in a cross-sectional analysis of the REGARDS longitudinal study. Pain Manag. 2021. [DOI] [PMC free article] [PubMed] [Google Scholar]
- 57.Strath LJ, Jones CD, Philip George A, Lukens SL, Morrison SA, Soleymani T, Locher JL, Gower BA, Sorge RE. The Effect of Low-Carbohydrate and Low-Fat Diets on Pain in Individuals with Knee Osteoarthritis. Pain medicine. 21:150–60, 2020. [DOI] [PMC free article] [PubMed] [Google Scholar]
- 58.Totsch SK, Meir RY, Quinn TL, Lopez SA, Gower BA, Sorge RE. Effects of a Standard American Diet and an Anti-inflammatory Diet in Male and Female Mice. European journal of pain. 2018. [DOI] [PubMed] [Google Scholar]
- 59.Totsch SK, Quinn TL, Strath LJ, McMeekin LJ, Cowell RM, Gower BA, Sorge RE. The impact of the Standard American Diet in rats: Effects on behavior, physiology and recovery from inflammatory injury. Scand J Pain. 17:316–24, 2017. [DOI] [PubMed] [Google Scholar]
- 60.Totsch SK, Waite ME, Sorge RE. Chapter Fifteen - Dietary Influence on Pain via the Immune System. In: Price TJ, Dussor G, editors. Progress in molecular biology and translational science. 131: Academic Press; 2015. p. 435–69. [DOI] [PubMed] [Google Scholar]
- 61.Totsch SK, Waite ME, Tomkovich A, Quinn TL, Gower BA, Sorge RE. Total Western Diet Alters Mechanical and Thermal Sensitivity and Prolongs Hypersensitivity Following Complete Freund's Adjuvant in Mice. The journal of pain : official journal of the American Pain Society. 17:119–25, 2016. [DOI] [PMC free article] [PubMed] [Google Scholar]
- 62.Trost Z, Sturgeon J, Guck A, Ziadni M, Nowlin L, Goodin B, Scott W. Examining Injustice Appraisals in a Racially Diverse Sample of Individuals With Chronic Low Back Pain. The journal of pain : official journal of the American Pain Society. 20:83–96, 2019. [DOI] [PMC free article] [PubMed] [Google Scholar]
- 63.Veronese N, Stubbs B, Noale M, Solmi M, Luchini C, Maggi S. Adherence to the Mediterranean diet is associated with better quality of life: data from the Osteoarthritis Initiative. The American journal of clinical nutrition. 104:1403–9, 2016. [DOI] [PMC free article] [PubMed] [Google Scholar]
- 64.Wáng YXJ, Wáng J-Q, Káplár Z. Increased low back pain prevalence in females than in males after menopause age: evidences based on synthetic literature review. Quant Imaging Med Surg. 6:199–206, 2016. [DOI] [PMC free article] [PubMed] [Google Scholar]
- 65.Wynder EL, Hébert JR. Homogeneity in nutritional exposure: an impediment in cancer epidemiology. J Natl Cancer Inst. 79:605–7, 1987. [PubMed] [Google Scholar]