

Abstract
The possibility of using levels of specific mRNAs in individual bacteria as indicators of single-cell physiology was investigated. Estimates of the numbers of groEL and tsf mRNAs per cell in Salmonella typhimurium cells in different physiological states were obtained by Northern analysis. The average number of groEL mRNAs per cell was estimated to be 22 in fast-growing cultures and 197 in heat-shocked cultures. The average number of tsf mRNAs per cell was estimated to be 37 in fast-growing cultures, 4 in slow-growing cultures, and 0 in nongrowing cultures. The potential of mRNA-targeted in situ reverse transcription (RT)-PCR to monitor quantitatively different levels of groEL and tsf mRNA in individual cells and thus monitor both specific gene induction and general growth activity was assessed. Neither groEL nor tsf mRNA was present in stationary-phase cells, but it was shown that stationary-phase cells contain other RNA species at high levels, which may provide a possibility for monitoring directly stationary-phase individual cells by the use of in situ RT-PCR. The outcome of the in situ RT-PCR analyses indicated that a population of fast-growing cells is heterogeneous with respect to groEL mRNA single-cell contents, suggesting a cell-cycle-controlled expression of groEL in S. typhimurium, whereas a fast-growing culture is homogeneous with respect to tsf mRNA single-cell contents, suggesting that the level of tsf mRNA is relatively constant during the cell cycle.
Detection of bacteria and monitoring of their activities in situ are of great importance for understanding their role and performance in the environment and are also useful in areas of microbiology such as public health, food technology, and the pharmaceutical industry. In addition, the monitoring of bacteria with information of their physiological states may allow prediction of, or even design of, biological system properties such as productivity, biomass turnover, substrate utilization, or pollutant degradation.
Over the last decade, major advances have been achieved in the application of nucleic-acid-based methods for species-specific detection of microorganisms. The phylogenetic signature sequences of rRNA were recognized early as targets for hybridization (27, 28). The natural amplification of rRNA normally results in excellent sensitivities of hybridization assays, facilitating, for example, in situ identification of individual cells by use of fluorochrome-labeled oligonucleotides (1, 6). Although the correlation between bacterial ribosome content and growth rate (31) is reflected when quantitative rRNA hybridization is applied to bacteria with different growth rates (6, 26), the content of rRNA in individual cells cannot in general be used to directly estimate the actual growth activity of the bacteria (33).
A number of methods have been applied to monitor the activities of bacteria at the single-cell level. Examples include monitoring of substrate uptake (14), growth ability (18), intracellular enzyme activity (7), respiration activity (15, 30, 38), and membrane potential activity (17, 23). All of these methods give information about the general physiological state of the bacteria, but they cannot give detailed information regarding which genes the bacteria expressed at the time of sampling. Recently, methods for the detection of specific mRNAs in individual bacterial cells have been developed (11–13, 34). Since mRNAs are intermediates in gene expression, the detection of specific mRNA in individual cells may provide many-sided information on the physiology of bacteria in situ. In the present report we show that both specific gene expression and general growth activity can be monitored at the single-cell level by the use of mRNA-targeted in situ reverse transcription (RT)-PCR.
MATERIALS AND METHODS
Strains, growth, and heat shock conditions.
Salmonella typhimurium LT2 (21) was used as model organism in these studies. S. typhimurium SL4213 F′ lacY (34) was used in the estimation of the average number of specific mRNAs per cell. Luria-Bertani (LB) broth (4) was used as growth medium throughout, except for in the RNA arbitrarily primed (RAP) PCR experiment, where AB minimal medium (5) supplemented with 0.2 or 0.02% glucose was used.
The SL4213 F′ lacY strain was grown at 37°C for at least 10 generations in the presence of 1 mM isopropyl-β-d-thiogalactopyranoside (IPTG) before the exponential-phase culture was fixed for lac mRNA-targeting Northern analysis and the determination of CFU.
Mid-log-phase S. typhimurium LT2 cells cultivated at 37°C were subjected to heat shock by fourfold dilutions in LB broth preheated to either 45 or 52°C. Stationary-phase cells were established by continued incubation for up to 20 h after the exponential growth had leveled off.
Determinations of CFU were done by diluting the samples in 0.9% NaCl followed by plating on LB agar and counting of colonies.
Primers and radiolabeled probes.
Primers were used for PCR generation of probes for Northern analyses and for seminested in situ RT-PCR detection of mRNA. In addition, a single arbitrarily chosen primer, cST6 (5′-CTTTGTCGTTTTCACCTCGCTG-3′), was used in RNA arbitrarily primed PCR. Based on the sequence of the S. typhi groEL gene (22) and the Escherichia coli tsf gene (2), two sets of primers for seminested PCR amplification of the putative S. typhimurium groEL and tsf genes were designed: groELf (forward-primer), 5′-TCCGCTAACTCCGACGAAAC-3′; groELr (reverse primer), 5′-AGCAACCACGCCTTCTTCTAC-3′; groELi (internal primer), 5′-TCGCTTCTTCAATCTGCTGAC-3′; EF-Tsf (forward primer), 5′-CATATGGCCCCCTTTTTCACTTTT-3′; EF-Tsr (reverse primer), 5′-TGCGGCCTTCAACCATTTTCT-3′; and EF-Tsi (internal primer), 5′-CTCTTCGTCAGCGCCTTTAGCA-3′. The two primers groELi and EF-Tsi were labelled with biotin at the 5′ end during the automated synthesis and were subsequently purified by reversed-phase high-performance liquid chromatography. All primers were tested by PCR with purified S. typhimurium LT2 DNA as the template and were found to give PCR products of the expected sizes: 789 bp with groELf plus groELr, 619 bp with groELf plus groELi, 732 bp with EF-Tsf plus EF-Tsr, and 566 bp with EF-Tsf plus EF-Tsi. The PCR products of groELf plus groELr and EF-Tsf plus EF-Tsr were used as probes in Northern analyses to target the groEL and tsf mRNA molecules, respectively. An 1,167-bp fragment that was PCR generated with previously described primers (lacZf and lacZr) (34) was used to target lac mRNA from the S. typhimurium F′ lacY strain in Northern blots.
Fifty nanograms of all probes for Northern blot analysis were random primer labeled with Ready-To-Go DNA Labeling Beads and [α-32P]dCTP (3,000 Ci/mmol; Amersham Pharmacia Biotech, Hørsholm, Denmark) according to the manufacturers’ instructions. The labelled probes were separated from unincorporated 32P-labelled nucleotides by gel filtration in a NICK column (Amersham Pharmacia Biotech), and the efficiency of labeling was subsequently monitored by thin-layer chromatography.
RNA isolation and Northern analyses.
Total RNA was extracted from 5 × 10⁸ to 5 × 10⁹ cells as previously described (9). Cells were harvested and resuspended in 890 μl of extraction mixture I (80 mM Tris-HCl, pH 7.5; 10 mM MgCl2; 10 mM 2-mercaptoethanol) followed by the addition of 1,110 μl of extraction mixture II (0.9% sodium dodecyl sulfate [SDS], 0.41 mg of proteinase K per ml, 18 mM EDTA, 3.6 mM 1.10-phenanthroline, 0.36 mg of heparin per ml) and incubation at 37°C for 20 min and 65°C for 10 min. One volume of phenol-chloroform-isoamyl alcohol (25:24:1) was added to the extraction mixture, and the resulting aqueous phase was reextracted once with phenol-chloroform-isoamyl alcohol (25:24:1) and once with chloroform. RNA was precipitated with 0.3 M sodium acetate and a 2.5 volume of 96% ethanol overnight at −20°C, washed once in 70% ethanol, and allowed to dry before resuspension in 50 μl of diethylpyrocarbonate (DEPC)-treated distilled H2O. Isolated RNA was kept at −80°C until used.
Separation of RNA fragments in 1.2% formaldehyde agarose gels and subsequent blotting onto Hybond-N+ nylon membranes (Amersham Pharmacia Biotech) was done as previously described (8). All prehybridizations and hybridizations were performed in 0.5 M sodium phosphate (pH 7.2) with 7% SDS at 65°C. Prehybridizations were performed for 3 h, followed by substitution of the prehybridization mixture with fresh prewarmed (65°C) hybridization mixture with heat-denatured radiolabeled probe added. Hybridizations were performed overnight. Washes (three times for 15 min) were done in 20 mM sodium phosphate (pH 7.2) with 1% SDS at 65°C. The washed membrane filters were subsequently autoradiographed and subjected to quantification of radioactive signals from specific bands by using an Electronic Autoradiography Instant Imager device (Packard Instrument Company, Meriden, Conn.).
Estimation of average numbers of mRNAs per cell.
In order to quantify the number of groEL and tsf mRNAs per cell, the same amount of a reference probe (the lacZ mRNA targeting probe) and the two probes for detection of groEL and tsf and mRNA were radiolabeled with 32P to the same specific activity (as determined by thin-layer chromatography). The probes were hybridized to membranes that contained total RNA from the same number of cells in each lane. With the assumption that all of the probes hybridize with equal efficiency to complementary targets, the accumulated counts over time, obtained by quantification of the radioactivity emitted from the specific bands on the hybridized membrane by use of the Instant Imager device, could be quantitatively compared. Counts from the lacZ probe were always set to 20 mRNA per cell (see reference 34 for a detailed explanation on the calculation of this number) and thus it was possible to estimate the average numbers of the different mRNAs per cell by taking into account the differences in the size of the probes. Estimates of mRNA numbers per cell represent the average of two independent quantitative Northern analyses.
mRNA-targeted in situ RT-PCR.
In situ RT-PCR was done essentially as described earlier (34). Since prolonged heat treatments of the cells prior to fixation made it possible to amplify intracellular DNA (data not shown), a DNase I treatment was performed after cell membrane permeabilization in order to avoid signals attributable to DNA amplification. Since biotin-labeled internal primers were used (instead of fluorescein-labeled internal primers), the biotinylated PCR products inside the cells were detected by using a streptavidin-horseradish peroxidase conjugate (sa-HRP) (Dupont/NEN Research Products) in combination with the fluorescence-based tyramide signal amplification system (Dupont/NEN Research Products).
Microscopy and image processing.
Epifluorescence and phase-contrast microscopy and processing of digitized charge-coupled device-camera-captured images was done as described previously (34).
RAP-PCR.
RAP-PCR was performed essentially as described by McClelland and Welsh (24). Approximately 200 and 30 ng RNA from 106 exponentially growing and established stationary-phase cells, respectively, were initially subjected to treatment with 10 U of RNase-free DNase I (Promega) for 4 h at 37°C in 100 μl of DNase I-buffer (40 mM Tris-HCl, pH 7.9; 10 mM NaCl; 6 mM MgCl2; 10 mM CaCl2) to remove traces of DNA. Phenol-chloroform-isoamyl alcohol and chloroform extractions were performed, and the RNA was precipitated with ethanol as described earlier. The RNA pellet was resuspended in 10 μl of DEPC-treated distilled water, and 10 μl of 2× “first-strand reaction mix” (100 mM Tris-HCl, pH 8.3; 100 mM KCl; 8 mM MgCl2; 20 mM dithiothreitol; 0.4 mM concentrations of dATP, dGTP, dCTP, and dTTP; 20 μM cST6; 200 U of Moloney murine leukemia virus [Mo-MuLV] RT [Life Technologies]) was added. Parallel negative controls consisted of exactly the same components except for the Mo-MuLV RT enzyme. Reactions were incubated in a Perkin-Elmer 9600 thermal cycler under the following conditions: ramp over 5 min to 37°C and holding this temperature for 10 min, followed by 2 min at 94°C and cooling to 4°C for 5 min. To each reaction, 20 μl of 2× “second-strand reaction mix” (10 mM Tris-HCl, pH 8.3; 25 mM KCl; 2 mM MgCl2; 2 μCi of [α-32P]dATP [3,000 Ci/mmol; Amersham Pharmacia Biotech]; 4 U of Taq DNA polymerase [Perkin-Elmer]) was now added, and the reactions were cycled through 1 low-stringency step (1 min at 94°C, 5 min at 40°C, and 5 min at 72°C) followed by 35 high-stringency steps (1 min at 94°C, 1 min at 57°C, and 1 min 72°C) in the thermal cycler. Next, 4 μl of each reaction was mixed with 4 μl of loading buffer (95% formamide; 20 mM EDTA; 0.05% bromophenol blue; 0.05 xylene cyanol), heated to 94°C for 2 min, and then cooled to 4°C for 5 min. Finally, 3 μl of each reaction was loaded onto a 6% polyacrylamide–50% urea sequencing gel, and electrophoresis was performed in 1× TBE buffer (Tris borate-EDTA) at 55 W for 2.5 h. The gel was dried and exposed on a Kodak Biomax MR film overnight.
RESULTS AND DISCUSSION
Monitoring of cells expressing a heat-shock-induced gene.
We have previously demonstrated the ability of mRNA-targeted in situ RT-PCR to monitor the presence or absence of lac mRNA in S. typhimurium (34, 35). However, in order to obtain detailed information about the growth physiology of bacteria at the single-cell level, it will be necessary to distinguish between different levels of specific mRNAs instead of just their presence or absence. With the aim of performing quantitative determinations of specific mRNA levels by use of in situ RT-PCR, we chose to target the groEL mRNA in S. typhimurium cells in different physiological states. The groEL gene is part of the ς32-directed heat-shock regulon, it encodes a molecular chaperone, it is expressed at a low level in growing bacteria, and it is induced when the bacteria are exposed to higher temperatures (10). As model cellular physiological states we chose exponential growth at 37°C, heat shock at 45°C, heat-induced death at 52°C, and stationarity at 37°C.
Although the regulation of the groEL gene, as described above, is known, the number of groEL mRNAs per cell in a given physiological state has, to the best of our knowledge, not been reported. In the present study it was important to have information about the number of groEL mRNAs in S. typhimurium cells in different physiological states. Therefore, Northern analysis was performed on samples containing equal numbers of cells that were either growing at 37°C, heat shocked at 45°C or 52°C, or in stationary phase. In order to estimate the number of groEL mRNAs per cell in the different conditions, samples of fully IPTG-induced S. typhimurium F′ lacY cells, in which the number of lac mRNAs per cell had been determined to be approximately 20 (34), was included in the Northern analysis. Figure 1 shows the result of the groEL targeted Northern blot. By quantification of the hybridization signals from the groEL mRNA band in the different lanes and the lac mRNA band in the reference lane, the number of groEL mRNAs per cell was estimated (Table 1). When the cells grew exponentially at 37°C they had an estimated average of approximately 22 groEL mRNAs. At 15 min after the shift to 45°C, the number of groEL mRNAs per cell had increased approximately nine times. At 6 min after the shift to 52°C, this increase was approximately 2.5 times. The level of groEL mRNA at 45°C decreased after the initial burst to a level after 1 h, which was about two times higher than the initial level, in agreement with observations of the transcription of ς32-controlled heat shock genes in E. coli (19, 37). The cells at 45°C, however, were not able to maintain the high number of groEL mRNAs per cell; although they were alive and growing (see Fig. 2), they contained only seven groEL mRNAs per cell 3 h after the temperature shift. When the cells were subjected to 52°C they died (Fig. 2), and the initially increased number of groEL mRNAs per cell started to decrease earlier than in cells at 45°C. When the bacteria entered stationary phase a decrease in the level of groEL mRNAs per cell was observed. In the early stationary phase (approximately 2 h after exponential growth ceased) the groEL mRNA was present in an average number of three per cell, and in the established stationary phase (approximately 20 h after exponential growth ceased) the cells were depleted of groEL mRNA.
FIG. 1.

Northern analysis of groEL mRNA in S. typhimurium LT2 (performed as described in Materials and Methods). The Northern blot contains RNA samples from (A) exponential-phase cells (lane 1), cells incubated at 52°C for 6 min (lane 2), 15 min (lane 3), 60 min (lane 4), 120 min (lane 5), and 180 min (lane 6) and cells incubated at 45°C for 6 min (lane 7), 15 min (lane 8), 60 min (lane 9), and 180 min (lane 10) and (B) exponential-phase cells (lane 1), early-stationary-phase cells (lane 2), and established-stationary-phase cells (lane 3). The size of the major transcript is given at the arrow. The sizes of the major transcripts are given at the arrows.
TABLE 1.
Estimated number of groEL mRNAs per cell in different physiological states
| Temp (°C) | Estimated no. of mRNAs/cell
|
||||||
|---|---|---|---|---|---|---|---|
| Balanced growth | Time after shift from 37°C of:
|
Stationary phase
|
|||||
| 6 min | 15 min | 60 min | 180 min | Early | Established | ||
| 37 | 22 | 3 | 0 | ||||
| 45 | 165 | 197 | 57 | 7 | |||
| 52 | 56 | 21 | 10 | 2 | |||
FIG. 2.

Determination of cfu of heat-shocked S. typhimurium LT2 cells expressed as the percentage of survival relative to the CFU number just before heat shock. Heat shock and CFU determinations were performed as described in Materials and Methods. The solid line corresponds to heat shock at 45°C, and the dotted line corresponds to heat shock at 52°C. The standard deviations of the measurements are indicated by vertical lines.
In parallel with the samples for Northern analysis, samples were also taken for groEL mRNA-targeted in situ RT-PCR. The in situ RT-PCR was performed with reporter-molecule-labeled primers, and intracellular reporter molecules were subsequently detected by use of a fluorogenic assay. As shown in Fig. 3, it was indeed possible to visualize differences in groEL mRNA levels between uninduced cells (Fig. 3A), heat-shock-induced cells (Fig. 3B), and RNase-treated heat-shock-induced cells (Fig. 3C). The population of cells that grew exponentially at 37°C prior to in situ RT-PCR showed heterogeneity with respect to groEL mRNA-conferred fluorescence after in situ RT-PCR (Fig. 3A). This signal heterogeneity was not caused by differences in the permeabilization of the individual cells, since cells from the same culture subjected to tsf mRNA-targeting in situ RT-PCR were homogeneous with respect to fluorescence intensity (see below). We therefore assume that the observed heterogeneity was caused by different levels of groEL mRNA in the individual cells, which may be the result of cell-cycle-controlled expression of groEL in growing cells. A cell cycle temporal regulation of the groEL operon has previously been observed for the gram-negative bacterium Caulobacter crescentus (3). The estimate of 22 groEL mRNAs per cell in growing cells should therefore be considered as an average covering a spectrum of different numbers in individual cells, depending on their cell age at the time of sampling. The fact that we observed cells from the uninduced culture that were comparable in signal intensity to cells that had been RNase treated could mean that cells at a certain point in the cell cycle do not contain groEL mRNA or, alternatively, that the groEL mRNA content in these cells was below the detection limit of the groEL-targeted in situ RT-PCR procedure. Heterogeneity with respect to cell fluorescence was also observed when cells from the culture growing slowly at 45°C for 1 h after the shift from 37°C was subjected to groEL-targeting in situ RT-PCR (data not shown). In the induced sample shown in Fig. 3B, the signal from a few cells was not distinguishable from background signals, and these cells may be dead. Evidence has previously been presented, that about 5% of the cells in a growing Salmonella culture were dead cells (20).
FIG. 3.

Detection of groEL mRNA in S. typhimurium LT2 cells. Cells were treated as described in Materials and Methods. Phase-contrast photomicrographs (top panels) and epifluorescence photomicrographs (bottom panels) of the same fields are shown. (A) Mid-log phase cells. (B) Cells heat shocked at 45°C for 15 min. (C) Cells heat shocked at 45°C for 15 min and RNase-treated prior to the in situ RT-PCR.
Previously, we showed that in situ RT-PCR could be used to distinguish between lac-mRNA-containing and lac-mRNA-free cells in a nonquantitative manner, but it was also suggested that a less-sensitive in situ RT-PCR procedure might be obtained by adjusting one or more of a number of PCR parameters (34). The groEL primer set and template used in the present study may result in a less-efficient PCR performance compared to that used previously for lac mRNA detection. It is possible that the groEL-targeted in situ RT-PCR used here did not reach the point of saturation and that therefore differences in groEL mRNA contents could be visualized.
Monitoring of growing cells.
To determine if single bacterial cells are growing or not is of great importance when bacterial communities are characterized. The ability of mRNA-directed in situ RT-PCR to monitor the growth of bacteria was tested by targeting the tsf mRNA encoding elongation factor EF-Ts. The tsf gene is under stringent control and is coordinated with the synthesis of ribosomal proteins as a function of growth rate in E. coli (25). As model physiological states, we chose fast exponential growth at 37°C, slow growth at 45°C, stationarity at 37°C, and heat-induced death at 52°C.
Numbers of tsf mRNAs per cell in the different physiological states were estimated by Northern analysis, again by using the content of lac mRNA in fully IPTG-induced S. typhimurium F′ lacY cells as a reference sample. Figure 4 shows the tsf-targeted Northern blots, and the estimated numbers of tsf mRNA molecules per cell are presented in Table 2. When the cells were growing exponentially at 37°C (doubling time of 23 min) they contained on average ca. 37 tsf mRNAs. After the shift to 45°C the cells grew with a much increased doubling time (ca. 90 min) (see Fig. 2) with an approximate eightfold reduction of the tsf mRNA level. When shifted to 52°C the level of tsf mRNA per cell declined rapidly, and after 3 h the cells were depleted of tsf mRNA. When the bacteria entered the stationary phase, a fast decrease in the level of tsf mRNAs per cell was observed. Already in the early stationary phase (approximately 2 h after leaving the exponential-growth phase) the culture was largely depleted of tsf mRNA.
FIG. 4.

Northern analysis of tsf mRNA in S. typhimurium LT2 cells (performed as described in Materials and Methods). The Northern blot contains RNA samples from (A) exponential-phase cells (lane 1); cells incubated at 52°C for 6 min (lane 2), 15 min (lane 3), 60 min (lane 4), 120 min (lane 5), and 180 min (lane 6); and cells incubated at 45°C for 6 min (lane 7), 15 min (lane 8), 60 min (lane 9), and 180 min (lane 10) and (B) exponential-phase cells (lane 1), early-stationary-phase cells (lane 2), and established-stationary-phase cells (lane 3). The size of the major transcript is given at the arrow.
TABLE 2.
Estimated number of tsf mRNAs per cell in different physiological states
| Temp (°C) | Estimated no. of mRNAs/cell
|
||||||
|---|---|---|---|---|---|---|---|
| Balanced growth | Time after shift from 37°C of:
|
Stationary phase
|
|||||
| 6 min | 15 min | 60 min | 180 min | Early | Established | ||
| 37 | 37 | <1 | 0 | ||||
| 45 | 30 | 25 | 5 | 4 | |||
| 52 | 23 | 5 | 2 | 0 | |||
The cells in the different physiological states were subjected to tsf mRNA-targeted in situ RT-PCR. Cells that were growing at 37°C prior to sampling were brightly fluorescent after in situ RT-PCR (Fig. 5A), indicating the presence of high levels of tsf mRNA. Cells that had been growing slowly at 45°C for 1 h after the shift from 37°C fluoresced less intensely after being subjected to tsf mRNA-targeted in situ RT-PCR (Fig. 5B), suggesting again that the in situ RT-PCR can be used at least semiquantitatively to distinguish in this case approximately eightfold differences in the mRNA content. Cells in the early stationary phase showed only background fluorescence after being subjected to the tsf mRNA-targeting in situ RT-PCR (Fig. 5C), indicating, in accordance with the Northern blot analyses, that these cells were almost completely depleted of tsf mRNAs already at this point.
FIG. 5.

Detection of tsf mRNA in S. typhimurium LT2 cells. Cells were treated as described in Materials and Methods. Phase-contrast photomicrographs (top panels) and epifluorescence photomicrographs (bottom panels) of the same fields are shown. (A) Mid-log phase cells. (B) Cells heat shocked at 45°C for 60 min (slow growing). (C) Cells in the early stationary phase (2 h after exponential growth ceased).
In contrast to what we observed with the groEL mRNA content in growing cells, the population of fast-growing cells appeared to be homogeneous with respect to tsf mRNA content (Fig. 5A), suggesting that the number of tsf mRNAs per cell is relatively constant during the cell cycle. The apparent heterogeneity with respect to single-cell tsf mRNA contents in the population of cells that were growing slowly at 45°C (Fig. 5B) may be a consequence of the culture not being balanced only 1 h after the shift from 37°C.
Monitoring of stationary-phase cells.
It is of general interest to identify cells that are alive but in stationary phase in complex microbial communities. In order to do this by in situ RT-PCR, a gene which is specifically expressed in the stationary phase should be targeted. Since both the groEL and tsf mRNAs were absent in stationary-phase cells, it was of interest to determine if any mRNAs at all are present in stationary-phase cells. For this purpose, we applied the so-called RAP-PCR procedure (36) to samples containing equal numbers of either mid-log-phase or stationary-phase S. typhimurium cells. Each lane in Fig. 6 contains a RAP-PCR profile corresponding to the presence of a subgroup of RNA molecules PCR amplified with an arbitrarily chosen primer. Corresponding bands in different profiles can be compared quantitatively, assuming that the amount of total RNA in each reaction does not interfere with the amplification efficiency of individual RNA targets. The RAP-PCR profile of stationary-phase cells contain some of the bands also seen in the RAP-PCR profile of exponential-phase cells, and some of the bands have the highest intensities in the RAP-PCR profile of stationary-phase cells (Fig. 6). This indicates that some RNA targets are present in equal amounts per cell in growing and stationary-phase cells and that some RNA targets are present in higher numbers in the stationary-phase cells than in the growing cells. Besides opening the possibility of monitoring stationary-phase cells by the use of in situ RT-PCR, this holds promise for using specific mRNAs as viability markers for single cells, since mRNA is assumed to be depleted in dead cells (16, 29, 32). Work is currently in progress to identify some of the mRNAs which are present in stationary-phase cells.
FIG. 6.
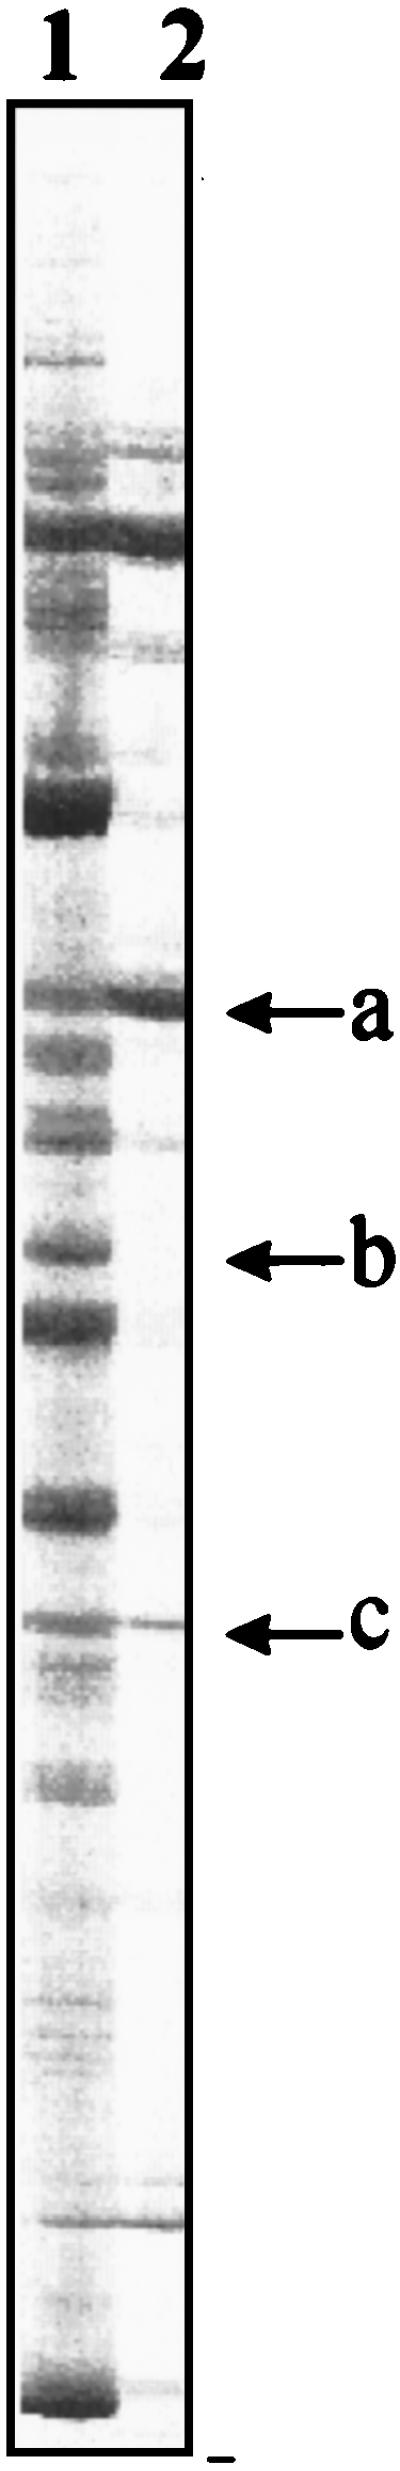
RAP-PCR of total RNA from approximately 106 S. typhimurium LT2 cells in exponential growth (lane 1) and in established stationary phase (lane 2). See Materials and Methods for more details on the procedure. Examples of bands potentially originating from RNA species, which are present in higher number in the stationary phase than in the mid-log phase (a), which disappear in stationary phase (b), and which seem to be present in the same amounts in both stationary and exponential phase (c), are indicated by arrows.
Concluding remarks.
We have shown that levels of specific mRNAs in single cells, monitored by in situ RT-PCR, can be used as indicators of the physiological state of individual bacteria. The groEL and tsf mRNAs belong to different classes of single-cell physiology indicators. The groEL mRNA gives information about a specific physical condition of the bacterium. Analogously, genes induced by other physical stress conditions and genes induced by starvation for a specific compound also belong to this class of indicators. The tsf mRNA provides information about the growth activity of the bacterium, but it gives no detailed information about the local environment sensed by the bacterium. This class of single-cell physiology indicators also includes mRNAs that are synthesized preferentially in stationary-phase cells. We believe that determinations of specific mRNA contents as indicators of single-cell physiology and performance will become a very powerful tool in studies of the biology of microorganisms in complex natural communities.
ACKNOWLEDGMENTS
The expert technical assistance of Torben Kallesøe in performing the RAP-PCR analysis is acknowledged.
This work was supported in part by a grant from the Danish Research and Development Program for Food Technology (FØTEK2).
REFERENCES
- 1.Amann R I, Krumholz L, Stahl D A. Fluorescent-oligonucleotide probing of whole cells for determinative, phylogenetic, and environmental studies in microbiology. J Bacteriol. 1990;172:762–770. doi: 10.1128/jb.172.2.762-770.1990. [DOI] [PMC free article] [PubMed] [Google Scholar]
- 2.An G, Bendiack D S, Mamelack L A, Friesen J D. Organization and nucleotide sequence of a new ribosomal operon in Escherichia coli containing the genes for ribosomal protein S2 and elongation factor Ts. Nucleic Acids Res. 1981;9:4163–4172. doi: 10.1093/nar/9.16.4163. [DOI] [PMC free article] [PubMed] [Google Scholar]
- 3.Avedissian M, Gomes S L. Expression of the groESL operon is cell-cycle controlled in Caulobacter crescentus. Mol Microbiol. 1996;19:79–89. doi: 10.1046/j.1365-2958.1996.347879.x. [DOI] [PubMed] [Google Scholar]
- 4.Bertani G. Studies on lysogenesis. I. The mode of phage liberation by lysogenic Escherichia coli. J Bacteriol. 1951;62:293–300. doi: 10.1128/jb.62.3.293-300.1951. [DOI] [PMC free article] [PubMed] [Google Scholar]
- 5.Clark D J, Maaløe O. DNA replication and the division cycle in Escherichia coli. J Mol Biol. 1967;23:99–112. [Google Scholar]
- 6.DeLong E F, Wickham G S, Pace N R. Phylogenetic stains: ribosomal RNA-based probes for the identification of single-cells. Science. 1989;243:1360–1363. doi: 10.1126/science.2466341. [DOI] [PubMed] [Google Scholar]
- 7.Diaper J-P, Tither K, Edwards C. Rapid assessment of bacterial viability by flow cytometry. Appl Microbiol Biotechnol. 1992;38:268–272. doi: 10.1007/BF00174481. [DOI] [PubMed] [Google Scholar]
- 8.Fourney R M, Miyakoshi J, Day III R S, Paterson M S. Northern blotting: efficient RNA staining and transfer. Focus. 1988;10:5–7. [Google Scholar]
- 9.Gopalakrishna Y, Langley D, Sarkar N. Detection of high levels of polyadenylate-containing RNA in bacteria by the use of single-step RNA isolation procedure. Nucleic Acids Res. 1981;9:3545–3554. doi: 10.1093/nar/9.14.3545. [DOI] [PMC free article] [PubMed] [Google Scholar]
- 10.Grossman A D, Erickson J W, Gross C A. The htpR gene product of E. coli is a sigma factor for heat-shock promoters. Cell. 1984;38:383–390. doi: 10.1016/0092-8674(84)90493-8. [DOI] [PubMed] [Google Scholar]
- 11.Hahn D, Amann R I, Zeyer J. Detection of mRNA in Streptomyces cells by whole-cell hybridization with digoxigenin-labeled probes. Appl Environ Microbiol. 1993;59:2753–2757. doi: 10.1128/aem.59.8.2753-2757.1993. [DOI] [PMC free article] [PubMed] [Google Scholar]
- 12.Hodson R E, Dustman W A, Garg R P, Moran M A. In situ PCR for visualization of microscale distribution of specific genes and gene products in prokaryotic communities. Appl Environ Microbiol. 1995;61:4074–4082. doi: 10.1128/aem.61.11.4074-4082.1995. [DOI] [PMC free article] [PubMed] [Google Scholar]
- 13.Hönerlage W, Hahn D, Zeyer J. Detection of mRNA of nprM in Bacillus megaterium ATCC 14581 grown in soil by whole-cell hybridization. Arch Microbiol. 1995;163:235–241. [Google Scholar]
- 14.Hoppe H-G. Determination and properties of actively metabolizing heterotrophic bacteria in the sea, investigated by means of micro-autoradiography. Mar Biol. 1976;36:291–302. [Google Scholar]
- 15.Iturriaga R, Rheinhiemer G. Eine einfach methode zur auszählung von bakterien mit aktivem elektronentransportsystem in wasser- und sediment-proben. Kiel Meeresforsch. 1975;31:83–86. [Google Scholar]
- 16.Klein P G, Juneja V K. Sensitive detection of viable Listeria monocytogenes by reverse transcription-PCR. Appl Environ Microbiol. 1997;63:4441–4448. doi: 10.1128/aem.63.11.4441-4448.1997. [DOI] [PMC free article] [PubMed] [Google Scholar]
- 17.Kaprelyants A S, Kell D B. Rapid assessment of bacterial viability and vitality by rhodamine 123 and flow cytometry. J Appl Bacteriol. 1992;72:410–422. [Google Scholar]
- 18.Kogure K, Simidu U, Taga N. A tentative direct microscopic method for counting living marine bacteria. Can J Microbiol. 1979;25:415–420. doi: 10.1139/m79-063. [DOI] [PubMed] [Google Scholar]
- 19.Lemaux P G, Herendeen S L, Bloch P, Neidhardt F C. Transient rates of synthesis of individual polypeptides in E. coli following temperature shifts. Cell. 1978;13:427–434. doi: 10.1016/0092-8674(78)90317-3. [DOI] [PubMed] [Google Scholar]
- 20.Lewis P J, Nwoguh C E, Barer M R, Harwood C R, Errington J. Use of digitized video microscopy with a fluorogenic enzyme substrate to demonstrate cell- and compartment-specific gene expression in Salmonella enteritidis and Bacillus subtilis. Mol Microbiol. 1994;13:655–662. doi: 10.1111/j.1365-2958.1994.tb00459.x. [DOI] [PubMed] [Google Scholar]
- 21.Lilleengen K. Typing Salmonella typhimurium by means of bacteriophage. Acta Pathol Microbiol Scand Suppl. 1948;77:11–125. [Google Scholar]
- 22.Lindler L E, Hayes J M. Nucleotide sequence of the Salmonella typhi groEL heat shock gene. Microb Pathog. 1994;17:271–275. doi: 10.1006/mpat.1994.1072. [DOI] [PubMed] [Google Scholar]
- 23.Matsuyama T. Staining of living bacteria with rhodamine 123. FEMS Microbiol Lett. 1984;77:990–994. [Google Scholar]
- 24.McClelland M, Welsh J. RNA fingerprinting using arbitrarily primed PCR. In: Diefenbach C W, Dveksler G S, editors. PCR primer: a laboratory manual. Cold Spring Harbor, N.Y: Cold Spring Harbor Laboratory Press; 1995. pp. 213–234. [Google Scholar]
- 25.Miyajima A, Kaziro Y. Coordination of levels of elongation factors Tu, Ts and G, and ribosomal protein S1 in Escherichia coli. J Biochem. 1978;83:453–462. doi: 10.1093/oxfordjournals.jbchem.a131932. [DOI] [PubMed] [Google Scholar]
- 26.Møller S, Kristensen C S, Poulsen L K, Carstensen J M, Molin S. Bacterial growth on surfaces: automated image analysis for quantification of growth rate-related parameters. Appl Environ Microbiol. 1995;61:741–748. doi: 10.1128/aem.61.2.741-748.1995. [DOI] [PMC free article] [PubMed] [Google Scholar]
- 27.Olsen G J, Lane D J, Giovannoni S J, Pace N R, Stahl D A. Microbial ecology an evolution: a ribosomal RNA approach. Annu Rev Microbiol. 1986;40:337–365. doi: 10.1146/annurev.mi.40.100186.002005. [DOI] [PubMed] [Google Scholar]
- 28.Pace N R, Stahl D A, Lane D J, Olsen G J. The analysis of natural microbial populations by ribosomal RNA sequences. Adv Microb Ecol. 1986;9:1–55. [Google Scholar]
- 29.Patel B K R, Banerjee D K, Butcher P D. Determination of Mycobacterium leprae viability by polymerase chain reaction of 71-kDa heat-shock protein mRNA. J Infect Dis. 1993;168:799–800. doi: 10.1093/infdis/168.3.799. [DOI] [PubMed] [Google Scholar]
- 30.Rodriguez G G, Phipps D, Ishiguro K, Ridgway H F. Use of fluorescent redox probe for direct visualization of actively respiring bacteria. Appl Environ Microbiol. 1992;58:1801–1808. doi: 10.1128/aem.58.6.1801-1808.1992. [DOI] [PMC free article] [PubMed] [Google Scholar]
- 31.Schaechter M, Maaløe O, Kjeldgaard N O. Dependency on medium and temperature of cell size and chemical composition during balanced growth of Salmonella typhimurium. J Gen Microbiol. 1958;19:592–606. doi: 10.1099/00221287-19-3-592. [DOI] [PubMed] [Google Scholar]
- 32.Sheridan G E C, Masters C I, Shallcross J A, Mackey B. Detection of mRNA by reverse transcriptase-PCR as an indicator of viability in Escherichia coli. Appl Env Microbiol. 1998;64:1313–1318. doi: 10.1128/aem.64.4.1313-1318.1998. [DOI] [PMC free article] [PubMed] [Google Scholar]
- 33.Tolker-Nielsen T, Larsen M H, Kyed H, Molin S. Effects of stress treatments on the detection of Salmonella typhimurium by in situ hybridization. Int J Food Microbiol. 1997;35:251–258. doi: 10.1016/s0168-1605(97)01242-7. [DOI] [PubMed] [Google Scholar]
- 34.Tolker-Nielsen T, Holmstrøm K, Molin S. Visualization of specific gene expression in Salmonella typhimurium by in situ PCR. Appl Env Microbiol. 1997;63:4196–4203. doi: 10.1128/aem.63.11.4196-4203.1997. [DOI] [PMC free article] [PubMed] [Google Scholar]
- 35.Tolker-Nielsen T, Holmstrøm K, Boe L, Molin S. Non-genetic population heterogeneity studied by in situ polymerase chain reaction. Mol Microbiol. 1998;27:1099–1105. doi: 10.1046/j.1365-2958.1998.00760.x. [DOI] [PubMed] [Google Scholar]
- 36.Welsh J, Chada K, Dalal S S, Cheng R, Ralph D, McClelland M. Arbitrarily primed PCR fingerprinting of RNA. Nucleic Acids Res. 1992;20:4965–4970. doi: 10.1093/nar/20.19.4965. [DOI] [PMC free article] [PubMed] [Google Scholar]
- 37.Yamamori T, Ito K, Nakamura Y, Yura T. Transient regulation of protein synthesis in Escherichia coli upon shift-up of growth temperature. J Bacteriol. 1978;134:1133–1140. doi: 10.1128/jb.134.3.1133-1140.1978. [DOI] [PMC free article] [PubMed] [Google Scholar]
- 38.Zimmerman R, Iturriaga R, Becker-Birck J. Simultaneous determination of the total number of aquatic bacteria and the number thereof involved in respiration. Appl Env Microbiol. 1978;36:926–935. doi: 10.1128/aem.36.6.926-935.1978. [DOI] [PMC free article] [PubMed] [Google Scholar]