

Abstract
The evolutionary relationship of cells within tissues having a similar function but located in different anatomical sites is of considerable biological interest. The development of single-cell RNA sequencing (scRNA-seq) protocols has greatly enhanced opportunities to address this topic. Here we focus on cells in the epithelium which lines two regions of the human respiratory tract and the male genital ducts to delineate the shared, differentiated functions of the different cell populations. Transcriptomic data were used to assess the gene expression profiles of human bronchial, nasal, and epididymal epithelium (HBE, HNE, and HEE). Bulk RNA-seq showed many shared genes expressed in cells from the nasal and bronchial epithelium and highlighted their divergence from the epididymal epithelium. ScRNA-seq in HBE and HNE cells demonstrated overlapping gene expression patterns within basal and secretory cell populations. Moreover, the distribution of cell types was altered in HNE cells derived from donors with cystic fibrosis (CF) when compared to cells from healthy donors. Next, the HBE and HNE datasets were merged and confirmed intersection of cell type gene expression profiles from the two sites. However, secretory and ciliated cells were the most abundant types in the HBE samples, while more basal cells were seen in the HNE populations. We then merged single-cell data from the epididymis to determine if overlapping functions of these cells corresponded to those in the airway. Of note, only the pulmonary ionocytes/epididymis clear cells showed a strongly conserved identity, which was confirmed by imputation in bulk RNA-seq datasets from the same cells.
Keywords: Single cell RNA-seq, Cell identity, Human epithelia, Nasal, Bronchial, Epididymis, Cystic fibrosis, Cell fraction imputation
1. Introduction
The key function of epithelial tissues throughout the human body is to provide a protective barrier from external insults. However, the epithelial layer also has to perform specific functions relating to its organ site. Our goal was to investigate the cellular basis of common and diverse functions in epithelia lining two distinct regions of the same epithelium, focusing on the respiratory system, and an unrelated epithelium from the male reproductive tract. For example, is it possible to assign differentiated identities to secretory, basal and ciliated cells that show greater similarities between cell types than between tissues of origin? Our focus on lung, nose and epididymis epithelia was guided by their direct involvement in the pathology of cystic fibrosis (CF). Loss of function mutations in the cystic fibrosis transmembrane conductance regulator (CFTR) gene have a profound impact on epithelial fluid secretion. However, the mechanistic contribution of different cell types underlying this defect in each affected epithelium is not fully understood.
In all epithelial tissues the most abundant cell types are secretory, with many cell types producing secretions with site-specific signatures. For example, in the airway epithelium, club cells dominate the secretory compartment and produce a fluid containing protease inhibitors, surfactants, antimicrobial peptides and other components of the innate immune response that are required for airway protection and repair (Rokicki et al., 2016). Airway goblet cells are also secretory epithelial cells that secrete the MUC5B mucin (Ma et al., 2018) and other high molecular weight glycoproteins. In the epididymis epithelium principal cells are the major secretory cell type and produce a fluid that is rich in antimicrobial peptides including multiple defensins together with site-specific protease inhibitors (Leir et al., 2020; Rinaldi et al., 2020; Shi et al., 2021). Apical and narrow cells in the epididymis are also abundant and have secretory functions including releasing cysteine-rich secretory protein (CRISP1) and whey acidic protein four disulphide core domain proteins, which are also protease inhibitors. Many types of motile ciliated cells are evident in epithelial tissues where they perform the critical function of clearing material from the surface of cells (Thomas et al., 2010). Though the structural features in the centriole-cilium proteome of these cells is well defined (Lovera and Luders, 2021), their precise phenotype is highly location-dependent, even within the same epithelium (Mitchison and Valente, 2017). Basal cells, which are located at the basal side of pseudostratified epithelia, in general all expressed keratin 5 (KRT5) and include both cycling cells and importantly the TP63 positive quiescent stem cell population. These stem cells are activated upon epithelial damage and can differentiate into both secretory and ciliated cells populations. Basal cells share a rather similar transcriptional signature in different epithelial tissues in the body (Mandon et al., 2015; Rock et al., 2010). A large number of other cell types are much rarer in epithelial tissues, though many have overlapping functions at different anatomical sites and include neuroendocrine cells and ionocytes/clear cells (Leir et al., 2020; Montoro et al., 2018; Plasschaert et al., 2018). The latter have a unique transcriptional signature with high levels of the cystic fibrosis transmembrane conductance regulator (CFTR), other ion channels such as the V-ATPase hydrogen pump (in clear cells), the epithelial sodium channel (ENaC) and the Forkhead box transcription factor, FOXI1.
Dysfunction of epithelial tissues is the cause of many human diseases in addition to CF, for example common multifactorial diseases such as chronic obstructive pulmonary disease (COPD) and asthma, and also many cancers. Hence, detailed knowledge of cellular identity in epithelia may inform novel therapeutics. However, most experimental assays of epithelial function use in vitro model systems, which do not fully represent the cellularity, physical constraints and microenvironment of epithelia in vivo. In this context, we also wanted to compare identity of the standard primary cell culture systems, which are commonly used to model epithelia in vitro for functional and pharmacological testing, to the epithelial tissues of origin. There is now an abundance of single cell (sc) RNA-seq data sets available for human lung (Carraro et al., 2021; Deprez et al., 2020; Montoro et al., 2018; Okuda et al., 2021; Plasschaert et al., 2018; Travaglini et al., 2020) and nasal cells (Ruiz Garcia et al., 2019). These data provide key information on lung cell identity which facilitate a comparative transcriptomics analysis such as we have performed here. However, we have also generated our own bulk RNA-seq and scRNA data from nasal, bronchial and epididymis epithelial cells to directly address questions of epithelial cell identity.
To define epithelial-specific transcriptional signatures we first used bulk RNA-seq data from nasal, bronchial (Goodale et al., 2017) and epididymis (Browne et al., 2016) epithelial cells, and to increase diversity of the cell signatures also epidermal keratinocytes (Casares et al., 2020). Next, we generated scRNA-seq from the human bronchial epithelial (HBE) and human nasal epithelial (HNE) cells to characterize individual cell types within each culture and the similarities or differences in the expression patterns of marker genes. The HNE samples were stratified by cells derived from healthy patients or patients with CF to identify differences at the cellular subpopulation. HBE and HNE datasets were combined to assess if patterns of gene expression between biologically similar clusters also showed statistical similarity when subjected to one set of variable selection and dimensionality reduction parameters. This analysis was then expanded to include the unrelated human epididymal epithelium (HEE). Finally, we used imputation software to relate the heterogeneous cell subtypes identified in each of the single cell datasets to the bulk datasets, estimating the abundance of member cell types in mixed cell populations.
2. Materials and methods
2.1. Primary human nasal epithelial (HNE) culture
Primary human airway epithelial cells from nasal brushings (2 WT and 2 CF) were collected under University Hospitals Institutional Review Board approval #10–04–14. Cells were expanded at 37 °C on irradiated 3T3 murine fibroblast feeder cells with growth media (F-12/DMEM [3:1] supplemented with 5% heat-inactivated FBS, 25 ng/mL hydrocortisone, 1 mg/mL insulin, 12.5 ng/mL EGF, 8.6 ng/mL cholera toxin, and 24 μg/mL Adenine) with ROCK inhibitor (ROCKi, Y27632 at 16 μg/mL), antibiotics (50 μg/mL gentamicin, 0.25 μg/mL amphotericin B, 100 U/mL Penicillin, and 100 μg /mL Streptomycin), and cry-opreserved upon initial passaging (P1). For air-liquid interface (ALI) culture HNE cell stocks (P1) were expanded on collagen-coated culture dishes in AW#2 medium (F12/DMEM [1:1], supplemented with 2% Ultroser G, penicillin/streptomycin, gentamicin, and fungizone). Harvested cells were seeded (P2) onto collagen-coated 12 mm inserts (Costar 3801) in AW#2 with RI at 4 × 10⁵ cells per insert. Media was replaced with AW#2 without ROCKi 24 h after seeding and cultures expanded for 3–4 days until confluent, when apical media was removed for mucociliary differentiation. Basolateral medium was exchanged for fresh AW#2 medium every other day. After six weeks, the ALI cultures were well differentiated into polarized epithelia. Of note, the cells have not been exposed to ROCKi or hormonal supplements for at least 6 weeks at the time of harvest. For single cell isolation, the cultures were first digested with 0.25% trypsin and 1 mM EDTA at 37 °C for 5 min, and then further digested to single cells using Accutase at 37 °C for 10 min
2.2. Primary human bronchial epithelial (HBE) culture
Passage 1 (P1) primary human bronchial epithelial cells were obtained from the University of North Carolina at Chapel Hill according to their published methods (Fulcher et al., 2005) and under protocol #03–1396 approved by the University of North Carolina at Chapel Hill Biomedical Institutional Review Board. Informed consent was obtained from authorized representatives of all organ donors. Cells were grown on collagen I-coated plastic in bronchial epithelial growth medium (Lonza). Passage 2 primary HBE cells were used for ALI cultures using a protocol similar to that described for HNE above, except PneumaCult-ALI medium (STEMCELL) was used. Cell harvesting for scRNA-seq was as above.
2.3. Bulk RNA-seq of HNE cells and analysis
RNA was isolated from primary HNE cultures using TRIzol (Life Technologies) as described previously (Browne et al., 2016) and RNA-seq was performed by standard protocols (SR 50 bp) on a NovaSeq 6000. Raw reads were aligned with STAR 2.6 (https://github.com/alexd obin/STAR) (Dobin et al., 2013). Aligned reads were then assigned to genomic features with featureCounts version 1.6.3 in the Subread package (http://subread.sourceforge.net/) (Liao et al., 2014) and differential gene expression was analyzed using EdgeR v3.30.3 (Robinson et al., 2010).
2.4. Gene ontology and gene set enrichment analyses
Differentially expressed genes were filtered to enrich for genes with a fold change ≥ 1.5 and Benjamini-Hochberg adjusted p-value ≤ 0.01. RNA-seq gene lists were read into the gProfiler gene ontology program and database (Raudvere et al., 2019). Dot plots for clustered results of each gene ontology term were generated using the Genome wide annotation for Human database and mapped using Entrez Gene identifiers (Carlson, 2019). Statistically significant results were filtered for categories passing a p-value of 0.001 with the Bonferroni correction for multiple testing. Gene set enrichment analysis was performed using clusterProfiler 4.0 (Wu et al., 2021) and the Hallmark human v6.2 database and org.Hs.eg.db 3.13.0 (Liberzon et al., 2015).
2.5. Single cell RNA-seq and analysis
Approximately 3000 cells from 5 HNE (donors AXH023, AXH024, AXH026, AXH029, AXH030) and 2 HBE (donors AXH017, AXH018) samples were used for scRNA-seq using the 10x Genomics Chromium Single Cell 3’ Reagent Kit v3 (HBE), or v3.1 (HNE). Donor age and gender information is shown in Table S1. After quality control using Tapestation, libraries were sequenced on a NovaSeq 6000 machine. Reads were aligned to the hg19 genome package v1.0 using Cell Ranger 3.1.0. Cell-UMI matrices were exported into Seurat v4.0.3 and filtered with the default parameters and a seed specified at 88, min.cells = 3, min.features = 200. Each dataset was then filtered with the following parameters: nFeature_RNA > 1000, nFeature_RNA < 8000, percent.mt < 25. Batch effect correction was then performed using 30 dimensions and 2000 anchor features. Cell neighbors were found using 30 dimensions and unsupervised clustering at a resolution of 0.1 for all tissues. 15 PCA dimensions were reduced using UMAP. Seurat was also used to perform differential gene expression analysis using the ROC method.
2.6. Integrative scRNA-seq and imputation
Seurat objects were generated from 10X matrices using the above filtering and dimensionality reduction parameters for WT HNE, HBE, and HEE individually, combined HBE+HNE, and combined HBE+H-NE+HEE. RDS and differential gene expression datasets for the individual and combined datasets were analyzed using clusterMap (Gao et al., 2019). Each individual dataset was reformatted to specify cluster identities to each barcoded cell. The integrated count data for each gene was then assigned to generate a signature matrix for CIBERSORTx (Newman et al., 2019). Log2 normalized counts per million from the bulk RNA-seq were used as the mixture file in each imputation. Minimum expression value was set to 0 with 1000 iterations per sample.
3. Results
3.1. Human bronchial and nasal epithelial cultures show similar gene expression profiles
We first examined the similarity and divergence of the bulk transcriptome of epithelial cells from the human nose (HNE), lung (HBE) and epididymis (HEE). To achieve this, we performed pairwise comparisons between new bulk data sets from nasal cells (n = 2) bronchial cells (n = 6) (Goodale et al., 2017) (GEO: GSE97036), and our caput epididymis cell data (n = 3) (GEO: GSE72986). Each dataset was also compared primary keratinocyte bulk RNA-seq data (n = 3) (GEO: GSE131565), since these are a substantially divergent epithelial cell type. Results were filtered for differentially expressed genes (DEGs) with a fold change ≥ 2 or ≤ −2 and a false discovery rate (FDR) ≤ 0.01 (Table S2). The number of DEGs in each epithelial culture (columns) in the pairwise comparison compared to those of other origins (rows) are shown in Fig. 1A. When keratinocytes were compared to HBE and HNE cells more than 2000 DEGs were observed for each, but only 579 and 524 DEGs were identified in the reciprocal comparison between HBE and HNE cells, respectively. HEE cells were more similar to keratinocytes with 1558 uniquely expressed genes compared to 2313 and 2327 when compared to HBE and HNE cells, respectively. Principal component analysis confirmed both the similarity between HBE and HNE cells, as well as their significant deviation from the HEE cells and keratinocytes (Fig. 1B). Gene set enrichment analysis (GSEA) was next performed on the DEGs in each pairwise comparison between the epithelial cell types to identify Hallmark pathways (Liberzon et al., 2015) that were differentially enriched. Few ontology categories were identified for genes specific for either HBE or HNE, with only those associated with plasma membrane components being significantly enriched in HNE cells (Fig. 1Ci). These genes include multiple Solute Carrier (SLC) family members such as SLC16A12, SLC12A5, SLC26A2, SLC6A15 and also specific Tetraspanins (TSPAN1, TSPAN8). Of note, the Cystic Fibrosis Transmembrane Conductance Regulator (CFTR) gene was also upregulated in nasal compared to bronchial epithelial cells. In the comparisons against the caput epididymis cells, both HBE (Fig. 1Cii) and HNE (Fig. S1) were enriched for the Hallmark pathway “Cilium or flagellum-dependent cell motility”, showing that they express substantially more cilia-associated genes. These genes include Dynein Axonemal family members (DNAH5, DNAH2, DNAI1, DNAH11, DNAH6, DNAH3). In contrast, HEE cells express more genes associated with the extracellular matrix including numerous collagens (COL6A3, COL8A1, COL14A1, COL1A2, COL25A1) (Fig. 1Ciii). These results illustrate clear differences between the nasal, bronchial and epididymis epithelial cells, with the airway cells having predominant roles in ion transport, secretion and ciliary action, consistent with maintenance of the mucociliary escalator. In contrast, expression of genes in the epididymis cells appears important in maintaining the structural integrity of the male genital ducts, with the other key functions of this epithelium (Leir et al., 2020) being less evident in the bulk RNA-seq data. The 2D culture system for HEE cells and 3D culture of HBE/HNE cells on permeable supports may also contribute to this difference.
Fig. 1.

HBE and HNE cells have similar transcriptomes, which both deviate significantly from HEE cells and keratinocytes. A. Table of genes differentially expressed in one cell type (columns) in the pairwise comparison with another cell type (rows) passing a FDR threshold of 0.01 and a minimum CPM expression value of 4. B. Principal component analysis of bulk RNA-seq datasets. C. Hallmark gene set enrichment analysis for select, significant terms enriched in the pairwise comparison between HNE/HBE (i), HEE/HBE (ii), HNE/HEE (iii).
3.2. Single-cell RNA-seq profiles of human bronchial and nasal epithelial cells
Multiple groups have used scRNA-seq to generate single cell atlases of human airway tissue from the nose, proximal and distal lung, and epithelial cells derived from these tissues grown at ALI (Carraro et al., 2021; Deprez et al., 2020; Plasschaert et al., 2018; Ruiz Garcia et al., 2019; Travaglini et al., 2020). However, little work has been done to compare the shared and contrasting gene expression profiles between nasal and bronchial epithelial cells. We performed scRNA-seq on HBE (n = 2) and HNE (n = 3) cells using the 10X Genomics Chromium platform and subsequently analyzed data with the Seurat analysis pipeline, filtering out cells with > 25% mitochondrial reads and removing ribosomal protein genes. Dimensionality reduction was performed by the Uniform Manifold Approximation and Projection technique (UMAP) (Figs. 2A and 2B) using the same filtering, dimension, and resolution parameters for both cell types. In both HBE and HNE datasets (Fig. S2, Table S3 and S4) we identified the canonical clusters corresponding to secretory, ciliated and basal cells and the CFTR-high, pulmonary ionocytes.
Fig. 2.
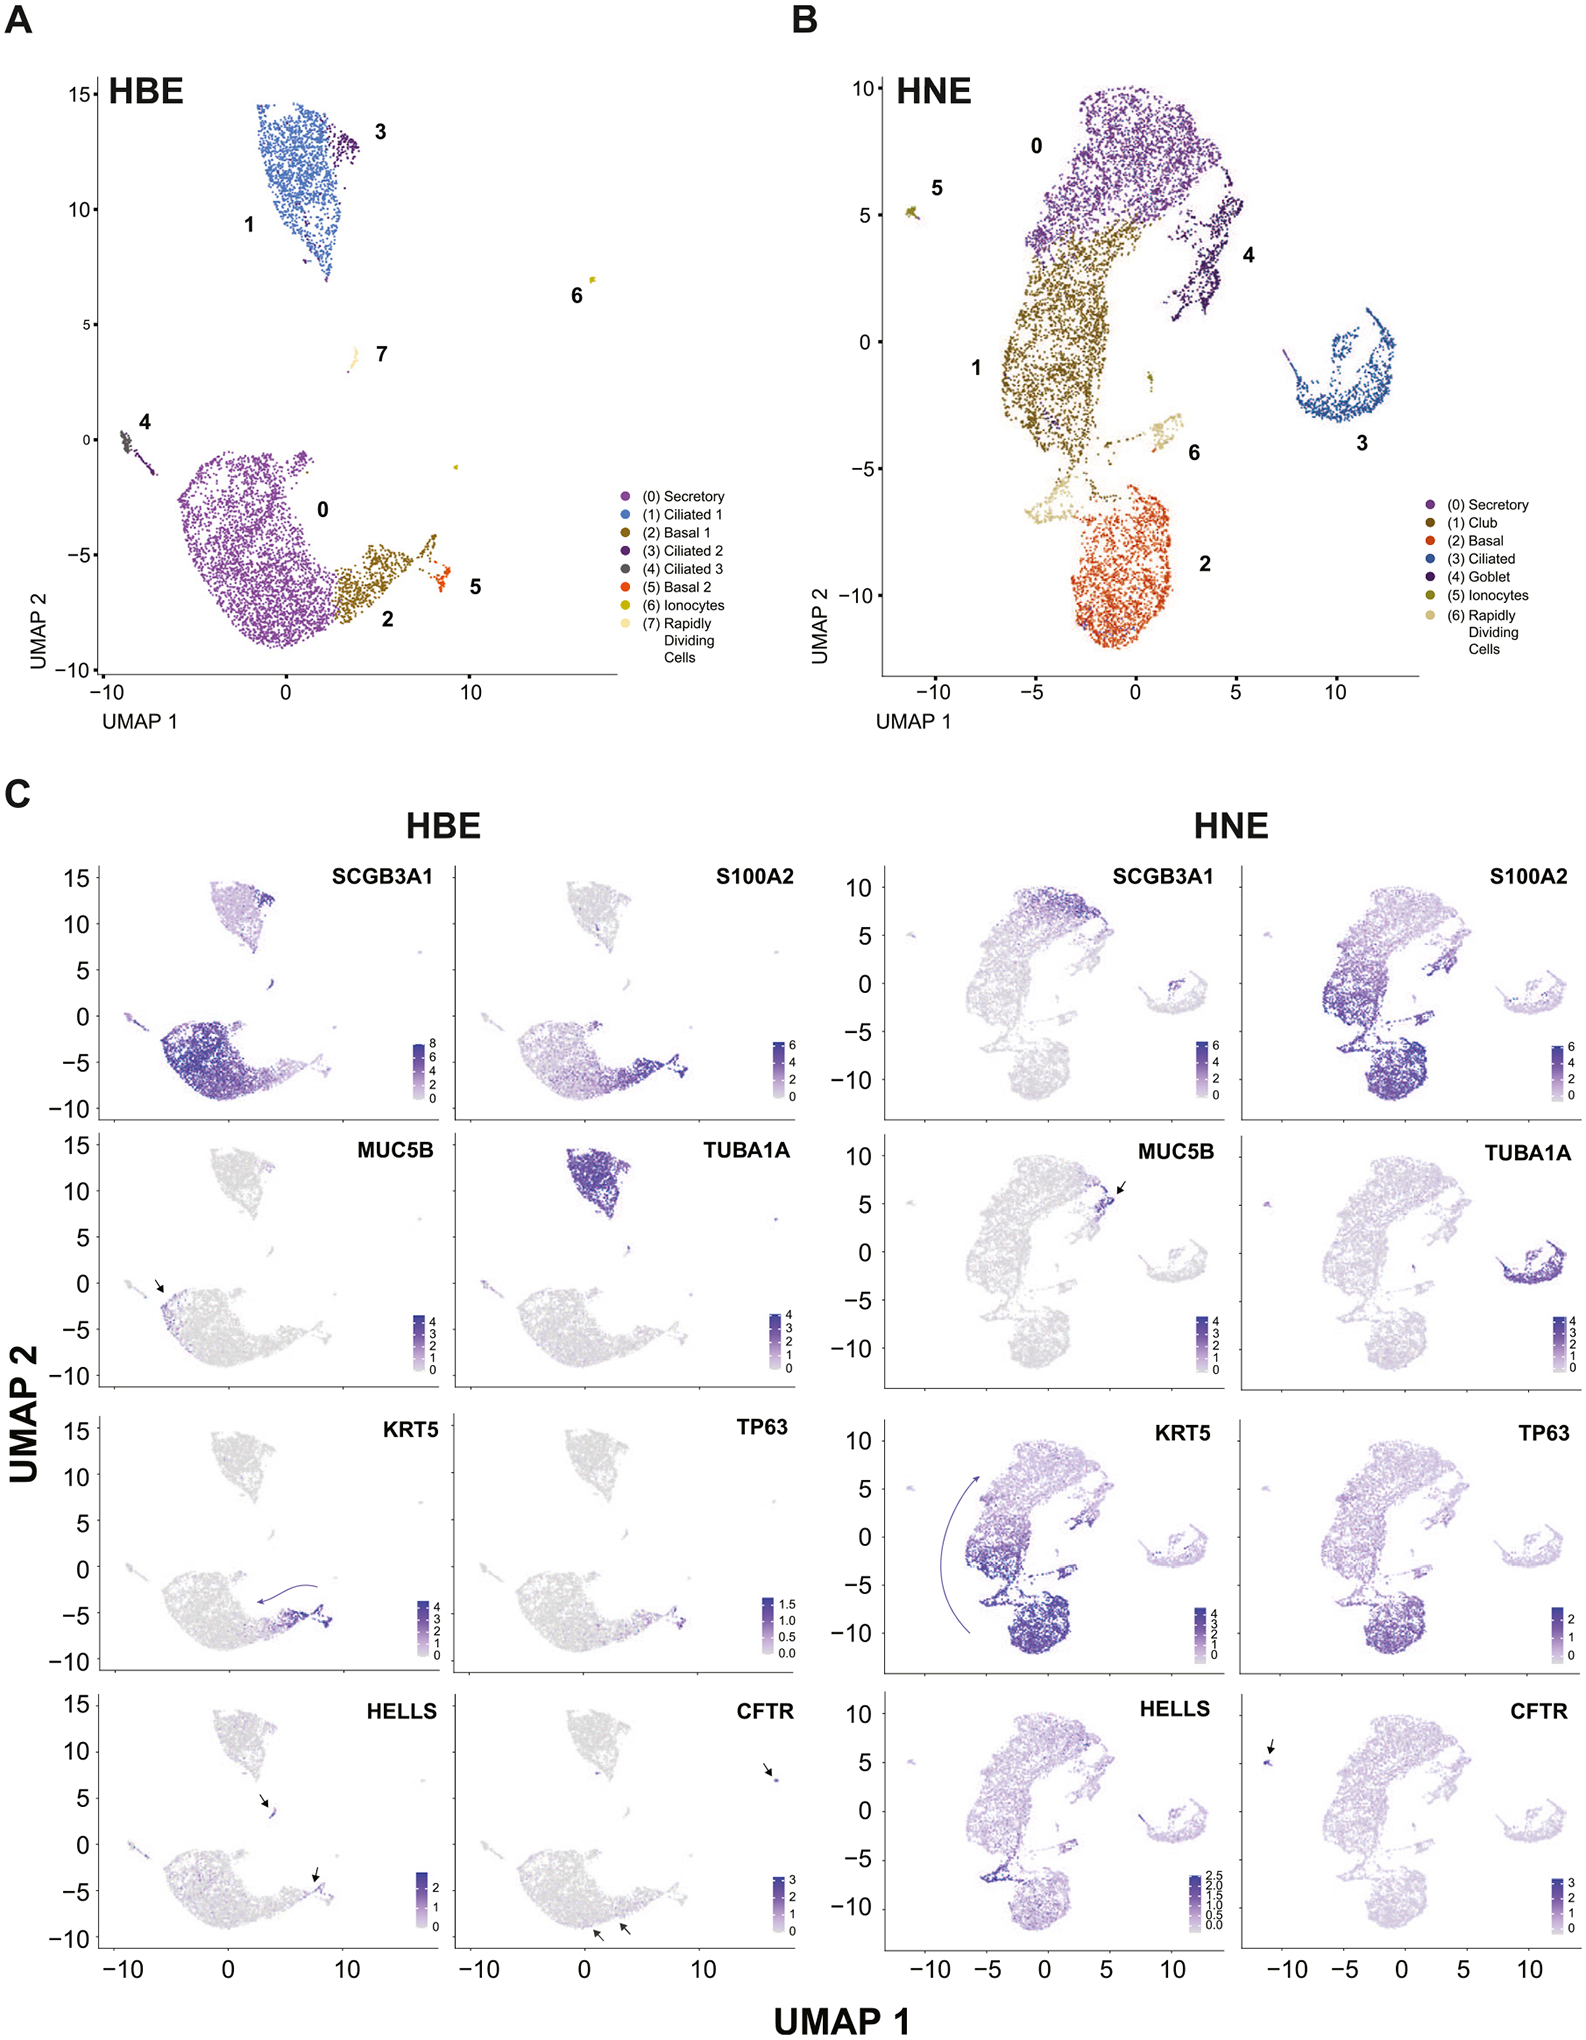
Single-cell RNA-seq reveals substantial overlap in the identities of HBE and HNE cell populations. A B, UMAP dimension reduction plot of HBE (donors AXH017, AXH018) and HNE (donors AXH026, AXH029, AXH030) scRNA-seq. Clusters are labeled by cell identity based on marker genes. C UMAP plots showing normalized log2 expression of SCGB3A1, S100A2, MUC5B, TUBA1A, KRT5, TP63, HELLS, and CFTR in the HBE (left) and HNE (right) datasets.
Secretory cell types are the most abundant in both HBE and HNE, however the distribution of secretory subsets differs between the two. In HBE the largest cluster (0) comprises cells that express secretoglobin family 3 A member 1 (SCGB3A1) (Fig. 2C), the serine protease inhibitor secretory leukocyte peptidase inhibitor (SLP1), which also has antimicrobial properties and another protease inhibitor WAP four disulphide domain core domain 2 (WFDC2) (Fig. S3). This abundance of protease inhibitors likely provides a major protective shield against the impact of infection and inflammation on the airway epithelium (Dey et al., 2018). In contrast in HNE cells there was a clearer separation of different types of secretory epithelial cells. Cells expressing SCGB3A1, SLP1 and WFDC2 (cluster 0) were in a slight majority, but another cluster (1) was also evident with a club cell transcriptome including several members of the serpin family of serine protease inhibitors (SERPINB4/B3/B1) (Fig. S3), secretoglobin family 1 member 1 (SCGB1A1) and transmembrane serine protease 11D (TMPRSS11D) being almost equally abundant. Another subset of secretory cells, specifically goblet cells (cluster 4) marked by the expression of the MUC5B mucin (Fig. 2C), anterior gradient 2 (AGR2) and BPI fold containing family member 1 (BPIFA1), was evident in HNE. These cells did not exhibit differential expression of certain other classical goblet cell markers, suggesting incomplete differentiation. Of note, although dimensionality reduction did not separate goblet cells into a separate cluster in HBE, MUC5B expressing goblet cells are evident as a subset of the secretory cell cluster (Fig. 2C).
In HBE cells, the next most abundant cell types are ciliated cells, which are represented in 3 separate clusters (1, 3 and 4). Cluster 1 includes cells with high expression of canonical markers of mature ciliated cells including tubulin genes such as Tubulin Alpha 1a (TUB1A1) (Fig. 2C) and TUBB4B, tubulin polymerization promoting protein family member 3 (TPP3), calcyphosine (CAPS) (Fig. S3) and the forkhead box transcription family member, (FOXJ1) (Fig. S3). Clusters 3 and 4 contain less mature ciliated cells in which FOXJ1 is not differentially expressed and significant markers include dynein axonemal heavy chain genes such as DNAH5 and DNAH12. Of note in other work (Carraro et al., 2021), similar cells in lung tissue were defined as secretory cell progenitors of ciliated cells. An important DEG in clusters 1, 3 and 4 is HYDIN axonemal central pair apparatus protein (HYDIN), mutations of this gene are causative in one form of primary ciliary dyskinesia (Olbrich et al., 2012). By contrast, only one ciliated cell cluster is seen in HNE cells marked by expression of markers from several stages of differentiation including TPPP3, CAPS (Fig. S3) and DNAH5.
The comparison of basal cell populations in the HBE and HNE cells is particularly interesting. In HBE cells, two distinct basal cell subpopulations (basal 1 and 2) were delineated; both express keratin 5 (KRT5) but only basal cluster 2 shows significant expression of the stem cell marker gene TP63 (Fig. 2C). In contrast, HNE cells showed only one large basal cell cluster (2) with significant expression of both TP63 and KRT5. Among these cells keratin 7 (KRT7) expression is inversely correlated with that of KRT5 along the axis of basal cell differentiation into secretory cells (Fig. S3). The expression signature of the HNE basal cell cluster may be directly influenced by the use of ROCKi during the establishment of cultures and at each passage. For both HBE and HNE the process of stem cell differentiation is evident when following spatial coordinates of TP63 positive basal cells transitioning into KRT5 and S100 Calcium Binding Protein A2 (S100A2) expressing cells (Fig. 2C). S100A2 expression also marks the transition of basal cells into the secretory and club cell clusters for HBE and HNE respectively.
Among the clusters of rarer cells seen in both HBE and HNE are rapidly dividing cells (RDC) (clusters 7 and 6 respectively) identified by Cyclin O (CCNO) and Helicase, and Lymphoid Specific (HELLS) gene expression (Fig. 2C), which are likely a subset of basal cells according to their spatial coordinates. Also evident in both HBE and HNE are pulmonary ionocytes (clusters 6 and 5 respectively) that express FOXI1, ASCL3 and CFTR (Fig. 2C and S3). Consistent with other recent data sets (Carraro et al., 2021) CFTR (Okuda et al., 2021) expression is also seen in the secretory and basal cell compartments of HBE and HNE with highest expression in HNE secretory cells.
Next, to address potential bias arising from the small numbers of HBE donor samples used for scRNA-seq in our analysis we merged our data with equivalent non-CF HBE ALI data from GSE:150674, including only a subset of samples generated by the same protocols. The UMAP plots for the combined analysis of tissue samples (4) and HBE ALI cells (3) from GSE:150674 are shown in Fig. S4, and HBE-ALI cells (3) only in Fig. S5. In both cases we see that our HBE cells fall within the same UMAP space as the clusters identified in the larger dataset (Fig. S4A,B and Fig. S5A,B) thus showing that they have similar single cell gene expression signatures. Moreover, inspection of the feature plots for markers of mature basal (KRT5), secretory (SCGB1A1) and ciliated (FOXJ1) cells and ionocytes (FOXI1) we see robust contributions of our HBE cultures to each cluster (Fig. S4C and S5C). Of note, though the subset of data we used from GSE:150674 included cells that although isolated similarly to our cultures, were grown in different differentiation media (Carraro et al., 2021), the clusters are very similar. An exception is the relative paucity of KRT5 + basal cells in our cultures, which this may also be influenced by the duration of culture at ALI (8 weeks for our cultures and 4 weeks for Carraro et al.). More impactful is the donor-to donor variation since one HBE ALI culture has a dominant contribution to the mature ciliated cluster (FOXJ1 +).
3.3. Comparison of healthy and CF human nasal epithelial cells
Alterations in gene expression profiles across cell populations in the context of disease may further our understanding of key cell types driving the phenotypic change. Duplicate non CF (WT) and CF HNE cells from two passages were combined and analyzed using the same filtering and resolution parameters. Data were then stratified by phenotype with UMAP by cluster and original identity (Fig. 3A and 3B, respectively). Although there were no significant changes between secretory cells from non CF and CF, we observed differences in the distribution of subsets of ciliated cells between non CF and CF and also identified two distinct subsets of basal cells (Table S5). These proportions of CF (total 4006) and non CF (total 4774) cells contributing to each cluster are summarized in Fig. 3C. Focusing first on ciliated cell clusters (3, 5 and 7), approximately equivalent cell numbers are seen in the cluster (3) of fully differentiated ciliated cells marked by high expression of CAPS, sentan, cilia apical structural protein (SNTN), TUBB4B, TPPP3 and FOXJ1. In contrast, cilia cluster 5 has an overrepresentation of CF cells compared to non CF (proportion CF/proportion non CF = 1.402) (Fig. 3C) and DEGs suggest this cluster defines an immature population that despite high levels of TUBB4B expression, lacks differential expression of FOXJ1 and other cilia marker genes and has high expression of the microtubule associated tubulin alpha 1b (TUBA1B). Conversely, CF cells make no contribution to cilia cluster 7 (Fig. 3C), and these non CF cells have an unclear gene expression signature, including energy generation, cilia and microtubule components, and may be an intermediate cell type arising in culture. Next, addressing the basal cell compartment, the most abundant basal-like cluster (1) has a greater relative contribution from non CF cells (proportion CF/proportion non CF = 0.596) (Fig. 3C) but does not correspond to a well-defined cell lineage in vivo. In addition to abundant KRT7 transcripts, which were previously found to be enriched in club cells (Ruiz Garcia et al., 2019), this cluster also shows many immune cell markers including CD47 and multiple HLA components (Fig. S6). This gene expression profile may indicate that this cluster contains basal and immune cells; alternatively these are basal cells contributing to the innate immune response, for example by expression of lipocalin 2 (LCN2) as observed elsewhere (Shaykhiev, 2015). Basal cluster 1 (cluster 2) is identified by canonical markers of basal stem cells, with KRT5 and TP63 among the most significant DEGs, and has overrepresentation of CF cells (proportion CF/proportion non CF = 1.786). Basal 2 cells (cluster 4), which also expressed KRT5 and TP63 in addition to fibulin (FBLN1), show a marked deficit of CF cells compared to non CF (0.250) (Fig. 3C) Several genes were differentially expressed within these clusters including two major keratins as shown in the violin plots in Fig. 3D. Non CF and CF cells expressed greater amounts of keratin 7 (KRT7) and keratin 15 (KRT15), respectively, although the distributions varied between the basal and ciliated subpopulations. Transcripts of the serum amyloid A apolipoprotein genes SAA1 and SAA2, which are involved in the proinflammatory response, were also found in varying abundance between the phenotypes (Fig. 3D). Although CF cells within the basal/immune cell population expressed more SAA1 and SAA2 than non CF cells, in the other basal and ciliated clusters these transcripts were more abundant in non CF cells.
Fig. 3.

CF and non CF HNE cells show altered distribution of basal and ciliated cell subclusters, UMAP plots of merged CF (donors AXH024, AXH030) and non CF (donors AXH023, AXH029) HNE by differential gene expression profiles (A) or phenotypic identity (B). C. Table shows the total number of CF and non CF cells found in each cluster and the ratios of CF to non CF cells as proportion of each cluster. D. Violin plots show the expression of KRT7, KRT15, SAA1, and SAA2 stratified by HNE cell type in CF and non CF samples.
3.4. Combined and comparative analysis of HBE and HNE scRNA-seq datasets
Having examined the identity and separate gene expression profiles of the clusters of HBE and HNE cells, we next embarked on addressing the question of common and diverse functions of the same cell types in the different epithelia. To achieve this, we integrated scRNA-seq datasets from the two HBE and two WT HNE cultures to determine the degrees of similarity for like-clusters. Consistent with the individual profiles, dimensionality reduction with UMAP separated the major cell types within 10 principal components (Fig. 4A) distributed across the canonical clusters (Fig. S7, Table S6) of secretory, ciliated, basal cells, and pulmonary ionocytes. In both basal and basal/immune populations KRT5 and TP63 are DEGs, however the latter is marked by high expression of the laminin genes LAMB3 and LAMC2 which are differentially expressed in the HNE basal cells. The ClusterMap program (Gao et al., 2019) was then used to compare gene expression profiles between HBE and HNE cells and determine the relative contributions of each individual cluster to those in the combined analysis (Fig. 4B). Binary hierarchal clustering using the purity tree cut algorithm showed that the closest neighbor to each of the resulting five clusters in the combined dataset came from the HBE profile, with the exception of the secretory cells, which had a shared profile in both HBE and HNE cells. Secretory and ciliated cells were the more abundant type in the HBE samples, while more basal cells were seen in the HNE (Fig. 4C). Pulmonary ionocytes occurred in the same proportion in both cultures at 1.51% in HBE and 1.59% in HNE (Fig. 4C). Similarities between clusters in the individual and combined datasets were calculated using hierarchical clustering as illustrated by the cluster dendrogram (Fig. 4D). The average height across the cluster dendrogram, defined as 1 minus the height of the merging node of the matching groups, was consistent between all the subtypes with the most significant deviation being observed in the ciliated cells. Cellular subpopulations consistently fell one degree from their biologically equivalent cluster in the HBE and merged dataset (Fig. 4D). This indicates that the marker gene trends within secretory, basal and ciliated cells, RDC, and ionocytes identified in the HBE population are all similar to the equivalent cells in the HNE cultures, with no subpopulation differing substantially.
Fig. 4.

Merged analysis of HBE and HNE cell scRNA-seq data confirms the degree of overlap across all clusters. A. UMAP plot of the merged WT HBE (donors AXH017, AXH018) and WT HNE (donors AXH023, AXH029) datasets, clustered by cellular identity based on marker gene expression. B. Circos plot of the matched subgroups between HBE/HNE cell individual datasets and the merged dataset. The width of the black bars for each cluster represents percentage of cells in that group. C. Table of the total number of HBE and HNE cells found in each subgroup. D. Dendrogram of the hierarchal clustering of subgroups across samples by average binary distance of the expression of marker genes. The similarity of the matched groups is defined as 1 minus the height of the merging node of the matched groups.
3.5. Integration of single cell data from human epididymis epithelium
Our earlier single cells atlas of the human proximal epididymis identified 8 cell type clusters (Leir et al., 2020) including secretory and basal epithelial cells, and rarer clear cells, all of which have overlapping functions with cells in the bronchial and nasal epithelium. Moreover, the epididymis is a major site of organ pathology in CF, which is usually associated with congenital absence of the vas deferens (CABVD) and deficits in other regions of the male genital ducts. Using the same methodology described above for comparing HBE and HNE cells, we merged our HEE scRNA-seq datasets (GEO: GSE148963) with those of HBE and HNE. Data from two donors of the three we analyzed previously were used to maintain sample number consistency between cell types and remove a donor with substantial efferent duct contribution to the caput epididymis tissue sample (Table S7). Dimensionality reduction with UMAP using 15 principal components and a resolution of 0.1 visualized the distribution between 10 clusters (Fig. 5A, Table S8) and tissue of origin (Fig. 5B). Clusters 3, 5, 6, and 9 appear to be HEE specific with cluster 5 projecting across the secretory HBE and HNE clusters (Fig. 5B). ClusterMap comparison reiterated the high degree of similarity between the bronchial and nasal epithelial cell subtypes within the combined results and their substantial contribution to the overall dataset (Fig. 5C). In contrast, HEE clusters showed little overlap with airway cells, with expression profiles contributing only to distinct HEE-specific regions in the combined dataset (Fig. 5C, Fig. S8). This suggests a specialized transcriptome of secretory cells in the epididymis, as required for the unique nature of luminal fluid in the epididymis. Basal cells in the epididymis were also dissimilar to those from the airway epithelium. One cell type that did show strong identity across the epithelial cells from different origins was the ionocyte/clear cell. Average linkage and Jaccard distance indicated degrees of similarity between the FOXI1-expressing cells in all three samples, corresponding to the pulmonary ionocytes in the lung and the clear cells in the epididymis. We next assayed the expression level and percent expression of specific key marker genes for each cell cluster in the individual analyses, in the combined analysis to compare the HBE, HNE, and HEE (Fig. 5D). This proved to be more biologically useful than the bioinformatic predictions from ClusterMap. S100 Calcium Binding Protein A6 (S100A6) that is known to be highly expressed in most epithelia, is consistently expressed and variable between clusters. KRT7 expression, which may identify basal cells differentiating into club cells as noted in the individual analyses, is found in HBE and HNE clusters distinct from those with high KRT5. Clusters 4 and 7 comprise basal-like KRT5+ cells with contribution from all three cell types, although only cluster 4 expressed the stem cell marker TP63. HEE-unique clusters were discernable by high expression of epididymal genes such as lipocalin 12 (LCN12) and homeodomain-only protein homeobox (HOPX), which are markers of principal cells, or vimentin (VIM) in the stromal cells. Notably, one cluster with a consistent gene expression identity was the FOXI1- and CFTR- expressing subpopulation of cluster 8: the ionocytes in the airway and the clear cells in the epididymis. These data suggest that the key site-specific functions of an epithelium are the dominant feature driving gene expression signatures among epithelial cells, hence equivalent cell types from different epithelial tissues do not share a distinct transcriptomic signature. Among exceptions to this observation are the ion pumping ionocyte/clear cells.
Fig. 5.

Specific and shared cell populations in diverse epithelial tissues of origin are detailed in a merged analysis of HBE, HNE, and HEE cell scRNAseq. A. UMAP plot of the merged scRNA-seq data from HBE (donors AXH017, AXH018), HNE (donors AXH023, AXH029), and HEE (AXH009, AXH014) (Leir et al., 2020) marked by cluster. B. UMAP plot of the merged data marked by cellular identity. C. Circos plot of the matched subgroups between individual and merged datasets. D. Dot plot of the expression of genes in each cluster, stratified by cell identity. Several genes are known markers of cellular subtypes such as KRT5 (basal), VIM (stromal), and FOXI1/CFTR (pulmonary ionocytes/clear cells). Color intensity represents average expression of the gene per cell within the cluster and the size of the dot corresponds to the percentage of cells within the cluster expressing the gene.
3.6. Imputation of bulk epithelial gene expression profiles using scRNA-seq data
Although bulk RNA-seq of primary cell cultures provides general information about gene expression profiles in each population, it fails to properly capture the heterogeneity of individual cell lineages. The low level of overlap in gene expression signatures between the HEE and HBE/HNE was identified in both bulk and single-cell analyses, but these do not reveal whether the discrepancy is due to general differences between the cells or the result of dominant contributions by one or more cell subtype. We used the CIBERSORTx tool (Newman et al., 2019) to impute the abundance of individual cell types in the bulk RNA-seq from a signature matrix generated from the corresponding scRNA-seq dataset. For the three epithelia, the proportion of the identity clusters delineated by single-cell sequencing were calculated for each replicate of the corresponding bulk RNA-seq data (Fig. 6). In the two airway cell samples, we found a significant enrichment of secretory and a subset of ciliated cells. Unlike in the HNE cultures which exhibited a more homogenous ciliated cell population, ciliated cells within the bulk HBE dataset were more similar to the dynein-positive ciliated cells rather than the fully differentiated multiciliated, CAPS-expressing population. Relatively little contribution from the basal 1 cells could be identified in the HBE cultures, in contrast to an approximate 17% contribution in the HNE populations. In the HEE cells we observed an even distribution of all subtypes apart from clear cells and sperm. This analysis robustly confirms our observations on the identity, abundance, and relatedness of key epithelial cell types, derived from scRNA-seq data in the previous sections by highlighting the variable presence of the different cellular subpopulations in the bulk transcriptomic data.
Fig. 6.

Imputation identifies the relative contributions of the expression profiles of scRNA-seq clusters in bulk RNA-seq. Enumeration of the proportions of distinct cell subpopulations identified from the single-cell data in replicate, bulk expression profiles for HBE (A), HNE (B), and HEE (C). Each table shows the relative numeric imputation with the empirical p-value, Pearson correlation, and root-mean-square error (RMSE) calculated by comparing imputed fractions in a given mixture dataset with fractions that would have been obtained by random chance.
4. Discussion
Single-cell RNA sequencing technologies have greatly enhanced our understanding of gene expression signatures that identify individual cell types in a heterogeneous complex tissue. These protocols also enable direct comparison of tissues with a similar function that are located in different parts of the body. Such assessments across tissues may further delineate the pathways of development and differentiation of critical cell types at single cell resolution. Here, we focus on epithelial cells from three anatomical sites and examine the concordance between the human bronchial, nasal and epididymal epithelium. These analyses reveal the shared expression profiles of major, functional cellular subpopulations in the tissues and the different distributions of these cells, including in the context of CF.
Extensive work has compared the similarity of gene expression in the human bronchial and nasal epithelium (Deprez et al., 2020; Ghosh et al., 2020; Nguyen et al., 2018). This relationship is important both in the context of the healthy and diseased airways, the response to bacterial or viral infection, and the development of therapeutics for airway disease. The very few genes that are differentially expressed between bulk RNA-seq for HBE and HNE cells include several ion transporters and other genes encoding proteins that are associated with the plasma membrane. This may reflect site-specific differences in the composition of epithelial surface fluid in different parts of the respiratory tree. Epididymal epithelial cells together exhibit a much more similar gene expression profile to keratinocytes than to airway epithelial cells from either nose or lung. Genes encoding components of cilia and ciliated cells appear to be the most differentially expressed between the airway and epididymal epithelium, predominating in the former. Since airway epithelium is of endodermal origin, male genital ducts of mesodermal origin and skin keratinocytes derived from the ectoderm, the similarities and differences in bulk gene expression profiles do not correlate with the embryonic origins of the epithelia.
Analysis at single-cell resolution confirmed the high degree of similarity between HBE and HNE cells, though we observed unique distributions of known cell subtypes that may contribute to biological differences between the epithelia at different airway sites. HBE cultures were dominated by in SLPI-expressing secretory cells and several clusters of ciliated cells, which were marked by FOXJ1 or dynein expression. In contrast, the HNE cultures showed a greater abundance of basal cells (KRT5 positive) including the stem cell population expressing TP63. Also, a goblet cell population identified by MUC5B mucin and BPIFA1 (SPLUNC1) (Bingle and Craven, 2002) transcripts was evident in HNE cells and distinct from the main secretory cell population. The relatively low cell numbers analyzed for each epithelium could have contributed to the differences observed between HBE and HNE cell populations. Also, the slightly different culture media used for HNE cells may influence cell differentiation/identity as it includes ROCKi both at establishment of cultures and transiently at each passage. Moreover, the profound impact of different culture media on differentiation of primary airway cells has been observed elsewhere (Ruiz Garcia et al., 2019; Saint-Criq et al., 2020). Earlier studies cultured differentiating 3D cultures of HNE cells in Bronchial epithelial growth medium (BEGM, Lonza) and used a 1:1 DMEM:BEBM (basal medium) with BEGM supplements for the ALI cultures (Ruiz Garcia et al., 2019; Saint-Criq et al., 2020). Here we used F12/DMEM [1:1], supplemented with 2% Ultroser G, which may account for some variation between our data and previous HNE data. Additionally, donor-to-donor variation in HBE and HNE cell cultures is a source of substantial variability and cannot be excluded on a small sample number. Both HBE and HNE cells exhibited a clear axis of stem cell differentiation into secretory cells, as shown in the UMAPs by the gradient of expression from TP63 and KRT5 positive cells transitioning into cells with secretory cell markers. In the comparison between HBE and HNE cells, CFTR expression was consistently highest in FOXI1, ASCL3 marked ionocytes, though it was a more abundant transcript in the secretory cell compartment of HNE than HBE cells.
The existence of altered epithelial cell states in cystic fibrosis airways was established prior to the development of single cell sequencing technologies (Rock et al., 2010) and likely reflects the prolonged cycle of infection, inflammation and repair that contributes to airway remodeling (Hirota and Martin, 2013). Some of these changes may be recapitulated in cultured HBE and HNE cells, for example a deficit of basal cells was seen in differentiated CF HBE cells (Zoso et al., 2019). More recently, scRNA-seq analyses have provided further insights into alterations in the CF airway, which may have therapeutic relevance. Increased numbers of epithelial cells transitioning into certain ciliated and secretory subsets were observed in one study (Carraro et al., 2021), along with a decrease in cycling basal cells. Our findings comparing cultured HNE cells from non CF and CF donors also suggested differences in the basal cell compartment. We identified two distinct basal cell subgroups in the combined analysis, both expressing TP63 and KRT5, but separately clustering for high expression of KRT7 (non CF) or KRT15 (CF) respectively, among other markers. We also found a population of ciliated cells unique to the non CF samples with high expression of ATPase subunit (ATP5B, ATP5G1, ATP5G3, ATP6V0B) genes. Of additional interest in the CF airway is the presence of a pro-inflammatory profile that has been reported in multiple studies (Cantin et al., 2015). Here we monitored expression of the pro-inflammatory markers SAA1 and SAA2 and though CF cells within the basal-like cell population expressed more SAA1 and SAA2 than non CF cells, in the other basal and ciliated clusters these transcripts were more abundant in non CF cells. These observations suggest a complex response to the cell culture environment that may mask any inherent phenotypic properties associated with CF. Also of interest in the comparison between HNE cells from non CF and CF donors was that higher passage HNE cells (P4) predominately contributed to the secretory cell clusters, apparently loosing ciliated cells with time in culture (Fig. S9).
Merging single-cell datasets across epithelial cells from different tissue origins allows us to simultaneously identify any clusters that may be specific to one location as well as identify patterns of gene expression shared between sites. As expected from the bulk and separate scRNA-seq analysis, the HBE and HNE cellular subpopulations exhibited a high degree of concordance. We found that the secretory, basal, ciliated cells, and ionocytes all clustered with their similar cell types within less than 10 principal components. Ciliated cell clusters 2 and 3 from the independent HBE dataset, corresponding to ciliated cells with higher expression of dynein genes, deviated significantly from the fully differentiated ciliated cell cluster (FOXJ1-high) shared between the two tissues. As we observed in the comparison of bulk RNA-seq data, most highly expressed marker genes of known importance in the airway or epididymis were still found primarily expressed in either of those two lineages with little overlap. Despite this, variations in our data were still contained within 10 principal components and the epididymis-specific clusters did not deviate from the airway-specific clusters, except for the principal and apical/narrow cells. Of particular interest are clusters 5 and 6. Cluster 5 is found within two dimensions of UMAP topological space, primarily diverging from the airway secretory cell clusters 0 and 2 by a third dimension (Fig. S10). The only marker gene identified is Metallothionein 1 G (MT1G), an isoform of Metallothionein 1 that maintains homeostasis of essential metals (Andrews, 2000) and was found to have a potential tumor-suppressor role (Wang et al., 2019). MT1G is primarily expressed in the efferent duct and stromal cells of the epididymis (Fig. S11). Cluster 6 is found proximal to the secretory cells and the airway-unique ciliated cells, with Prolactin Induced Protein (PIP) as the only identified marker gene. PIP is only expressed at high levels in the efferent duct, though at lower abundance than MTG1. The strongest concordance in all three tissues was the rare FOXI1 and CFTR expressing cluster 8. This may indicate that the pulmonary ionocytes and the clear cells represent highly similar cell types with the same function in the tissues. Together, these results seem to indicate that although the most abundant cell types of the epididymis exhibit unique expression profiles compared to the airway epithelium, the basal cells and certain other cell types may share a degree of similarity.
Discrepancy is often observed between bulk RNA-seq and single-cell RNA-seq results due to the relative abundance of different cellular subpopulations in the bulk data. Abundant cell types may dominate sequencing signatures and cell type diversity may dilute the contribution of rare cell types. The CIBERSORTx machine learning method highlighted this variability in each of the HBE, HNE, and HEE cell data sets analyzed here. The significant enrichment of ciliated cells in both the HBE and HNE bulk data provides an explanation for the earlier finding that gene ontology terms associated with the cilia were the most enriched in the comparison against HEE. Additionally, the dominant secretory cell signature in HNE cells compared to HBE cells may reflect differences in the expression of certain solute carrier family members. The most consistent result of the imputation, consistent with the scRNA-seq data, is the minor but detectable contribution by the ionocytes/clear cells in the tissues.
In conclusion, by merging data from three different epithelial tissues we were able to directly address the question of the differentiated identity of individual epithelial cell types. Our results suggest that in general, each tissue confers a stronger identity on cells with common functions than the inherent differentiated properties of those cells. This results in different transcriptomic signatures for secretory, ciliated and basal cells when they are located at different anatomical sites. However, some rare, highly specialized cell types maintain a transcriptional identity that is site independent.
Supplementary Material
Acknowledgements
We thank, Dr. Calvin U Cotton and Kelly Cholewa for HNE cells and Dr Scott Randell for HBE cells. Also, Katrina Diener at the University of Colorado Anschutz Medical Campus Genomics Core for 10X sequencing and Dr Pieter Faber at the University of Chicago Genomics Core for RNA-seq.
Funding
This work was supported by the National Institutes of Health (R01 HL094585; R01 HD068901; [A.H.]; T32 GM008056 [A.P.]; R44HL134012 [Dr C.U. Cotton]; and the Cystic Fibrosis Foundation (Leir 17G0 and Harris 18P0). The funders had no role in the design of the study, in the collection, analysis, or interpretation of the data, in the writing of the manuscript, or in the decision to publish the results. The content is solely the responsibility of the authors and does not necessarily represent the official views of the National Institutes of Health.
Footnotes
Conflict of interest
The authors declare no conflict of interest. The funders had no role in the design of the study, in the collection, analyses, or interpretation of the data, in the writing of the manuscript, or in the decision to publish the results.
Appendix A. Supporting information
Supplementary data associated with this article can be found in the online version at doi:10.1016/j.ejcb.2022.151231.
Data Availability
Data generated in this work are available at NCBI GEO:GSE191061
References
- Andrews GK, 2000. Regulation of metallothionein gene expression by oxidative stress and metal ions. Biochem. Pharm 59, 95–104. [DOI] [PubMed] [Google Scholar]
- Bingle CD, Craven CJ, 2002. PLUNC: a novel family of candidate host defence proteins expressed in the upper airways and nasopharynx. Hum. Mol. Genet 11, 937–943. [DOI] [PubMed] [Google Scholar]
- Browne JA, Yang R, Eggener SE, Leir SH, Harris A, 2016. HNF1 regulates critical processes in the human epididymis epithelium. Mol. Cell Endocrinol 425, 94–102. [DOI] [PMC free article] [PubMed] [Google Scholar]
- Cantin AM, Hartl D, Konstan MW, Chmiel JF, 2015. Inflammation in cystic fibrosis lung disease: Pathogenesis and therapy. J. Cyst. Fibros 14, 419–430. [DOI] [PubMed] [Google Scholar]
- Carlson M, 2019. org.Hs.eg.db: Genome wide annotation for Human. R package version 3.8.2
- Carraro G, Langerman J, Sabri S, Lorenzana Z, Purkayastha A, Zhang G, Konda B, Aros CJ, Calvert BA, Szymaniak A, Wilson E, Mulligan M, Bhatt P, Lu J, Vijayaraj P, Yao C, Shia DW, Lund AJ, Israely E, Rickabaugh TM, Ernst J, Mense M, Randell SH, Vladar EK, Ryan AL, Plath K, Mahoney JE, Stripp BR, Gomperts BN, 2021. Transcriptional analysis of cystic fibrosis airways at single-cell resolution reveals altered epithelial cell states and composition. Nat. Med 27, 806–814. [DOI] [PMC free article] [PubMed] [Google Scholar]
- Casares L, Garcia V, Garrido-Rodriguez M, Millan E, Collado JA, Garcia-Martin A, Penarando J, Calzado MA, de la Vega L, Munoz E, 2020. Cannabidiol induces antioxidant pathways in keratinocytes by targeting BACH1. Redox Biol 28, 101321. [DOI] [PMC free article] [PubMed] [Google Scholar]
- Deprez M, Zaragosi LE, Truchi M, Becavin C, Ruiz Garcia S, Arguel MJ, Plaisant M, Magnone V, Lebrigand K, Abelanet S, Brau F, Paquet A, Pe’er D, Marquette CH, Leroy S, Barbry P, 2020. A Single-Cell Atlas of the Human Healthy Airways. Am. J. Respir. Crit. Care Med 202, 1636–1645. [DOI] [PubMed] [Google Scholar]
- Dey T, Kalita J, Weldon S, Taggart CC, 2018. Proteases and their inhibitors in chronic obstructive pulmonary disease. J. Clin. Med 7. [DOI] [PMC free article] [PubMed] [Google Scholar]
- Dobin A, Davis CA, Schlesinger F, Drenkow J, Zaleski C, Jha S, Batut P, Chaisson M, Gingeras TR, 2013. STAR: ultrafast universal RNA-seq aligner. Bioinformatics 29, 15–21. [DOI] [PMC free article] [PubMed] [Google Scholar]
- Fulcher ML, Gabriel S, Burns KA, Yankaskas JR, Randell SH, 2005. Well-differentiated human airway epithelial cell cultures. Methods Mol. Med 107, 183–206. [DOI] [PubMed] [Google Scholar]
- Gao X, Hu D, Gogol M, Li H, 2019. ClusterMap: compare multiple single cell RNA-Seq datasets across different experimental conditions. Bioinformatics 35, 3038–3045. [DOI] [PubMed] [Google Scholar]
- Ghosh D, Ding L, Bernstein JA, Mersha TB, 2020. The Utility of Resolving Asthma Molecular Signatures Using Tissue-Specific Transcriptome Data. G3 (Bethesda) 10, 4049–4062. [DOI] [PMC free article] [PubMed] [Google Scholar]
- Goodale BC, Rayack EJ, Stanton BA, 2017. Arsenic alters transcriptional responses to Pseudomonas aeruginosa infection and decreases antimicrobial defense of human airway epithelial cells. Toxicol. Appl. Pharm 331, 154–163. [DOI] [PMC free article] [PubMed] [Google Scholar]
- Hirota N, Martin JG, 2013. Mechanisms of airway remodeling. Chest 144, 1026–1032. [DOI] [PubMed] [Google Scholar]
- Leir SH, Yin S, Kerschner JL, Cosme W, Harris A, 2020. An atlas of human proximal epididymis reveals cell-specific functions and distinct roles for CFTR. Life Sci. Alliance 3 (11), e202000744. [DOI] [PMC free article] [PubMed] [Google Scholar]
- Liao Y, Smyth GK, Shi W, 2014. featureCounts: an efficient general purpose program for assigning sequence reads to genomic features. Bioinformatics 30, 923–930. [DOI] [PubMed] [Google Scholar]
- Liberzon A, Birger C, Thorvaldsdottir H, Ghandi M, Mesirov JP, Tamayo P, 2015. The Molecular Signatures Database (MSigDB) hallmark gene set collection. Cell Syst 1, 417–425. [DOI] [PMC free article] [PubMed] [Google Scholar]
- Lovera M, Luders J, 2021. The ciliary impact of nonciliary gene mutations. Trends Cell Biol 31, 876–887. [DOI] [PubMed] [Google Scholar]
- Ma J, Rubin BK, Voynow JA, 2018. Mucins, mucus, and goblet cells. Chest 154, 169–176. [DOI] [PubMed] [Google Scholar]
- Mandon M, Hermo L, Cyr DG, 2015. Isolated rat epididymal basal cells share common properties with adult stem cells. Biol. Reprod 93, 1–15. [DOI] [PMC free article] [PubMed] [Google Scholar]
- Mitchison HM, Valente EM, 2017. Motile and non-motile cilia in human pathology: from function to phenotypes. J. Pathol 241, 294–309. [DOI] [PubMed] [Google Scholar]
- Montoro DT, Haber AL, Biton M, Vinarsky V, Lin B, Birket SE, Yuan F, Chen S, Leung HM, Villoria J, Rogel N, Burgin G, Tsankov AM, Waghray A, Slyper M, Waldman J, Nguyen L, Dionne D, Rozenblatt-Rosen O, Tata PR, Mou H, Shivaraju M, Bihler H, Mense M, Tearney GJ, Rowe SM, Engelhardt JF, Regev A, Rajagopal J, 2018. A revised airway epithelial hierarchy includes CFTR-expressing ionocytes. Nature 560, 319–324. [DOI] [PMC free article] [PubMed] [Google Scholar]
- Newman AM, Steen CB, Liu CL, Gentles AJ, Chaudhuri AA, Scherer F, Khodadoust MS, Esfahani MS, Luca BA, Steiner D, Diehn M, Alizadeh AA, 2019. Determining cell type abundance and expression from bulk tissues with digital cytometry. Nat. Biotechnol 37, 773–782. [DOI] [PMC free article] [PubMed] [Google Scholar]
- Nguyen NTT, Contreras-Moreira B, Castro-Mondragon JA, Santana-Garcia W, Ossio R, Robles-Espinoza CD, Bahin M, Collombet S, Vincens P, Thieffry D, van Helden J, Medina-Rivera A, Thomas-Chollier M, 2018. RSAT 2018: regulatory sequence analysis tools 20th anniversary. Nucleic Acids Res 46, W209–W214. [DOI] [PMC free article] [PubMed] [Google Scholar]
- Okuda K, Dang H, Kobayashi Y, Carraro G, Nakano S, Chen G, Kato T, Asakura T, Gilmore RC, Morton LC, Lee RE, Mascenik T, Yin WN, Barbosa Cardenas SM, O’Neal YK, Minnick CE, Chua M, Quinney NL, Gentzsch M, Anderson CW, Ghio A, Matsui H, Nagase T, Ostrowski LE, Grubb BR, Olsen JC, Randell SH, Stripp BR, Tata PR, O’Neal WK, Boucher RC, 2021. Secretory cells dominate airway CFTR expression and function in human airway superficial epithelia. Am. J. Respir. Crit. Care Med 203, 1275–1289. [DOI] [PMC free article] [PubMed] [Google Scholar]
- Olbrich H, Schmidts M, Werner C, Onoufriadis A, Loges NT, Raidt J, Banki NF, Shoemark A, Burgoyne T, Al Turki S, Hurles ME, Consortium UK, Kohler G, Schroeder J, Nurnberg G, Nurnberg P, Chung EM, Reinhardt R, Marthin JK, Nielsen KG, Mitchison HM, Omran H, 2012. Recessive HYDIN mutations cause primary ciliary dyskinesia without randomization of left-right body asymmetry. Am. J. Hum. Genet 91, 672–684. [DOI] [PMC free article] [PubMed] [Google Scholar]
- Plasschaert LW, Zilionis R, Choo-Wing R, Savova V, Knehr J, Roma G, Klein AM, Jaffe AB, 2018. A single-cell atlas of the airway epithelium reveals the CFTR-rich pulmonary ionocyte. Nature 560, 377–381. [DOI] [PMC free article] [PubMed] [Google Scholar]
- Raudvere U, Kolberg L, Kuzmin I, Arak T, Adler P, Peterson H, Vilo J, 2019. g: Profiler: a web server for functional enrichment analysis and conversions of gene lists (2019 update). Nucleic Acids Res 47, W191–W198. [DOI] [PMC free article] [PubMed] [Google Scholar]
- Rinaldi VD, Donnard E, Gellatly K, Rasmussen M, Kucukural A, Yukselen O, Garber M, Sharma U, Rando OJ, 2020. An atlas of cell types in the mouse epididymis and vas deferens. Elife 9, e55474. [DOI] [PMC free article] [PubMed] [Google Scholar]
- Robinson MD, McCarthy DJ, Smyth GK, 2010. edgeR: a Bioconductor package for differential expression analysis of digital gene expression data. Bioinformatics 26, 139–140. [DOI] [PMC free article] [PubMed] [Google Scholar]
- Rock JR, Randell SH, Hogan BL, 2010. Airway basal stem cells: a perspective on their roles in epithelial homeostasis and remodeling. Dis. Model Mech 3, 545–556. [DOI] [PMC free article] [PubMed] [Google Scholar]
- Rokicki W, Rokicki M, Wojtacha J, Dzeljijli A, 2016. The role and importance of club cells (Clara cells) in the pathogenesis of some respiratory diseases. Kardiochir. Torakochirurgia Pol 13, 26–30. [DOI] [PMC free article] [PubMed] [Google Scholar]
- Ruiz Garcia S, Deprez M, Lebrigand K, Cavard A, Paquet A, Arguel MJ, Magnone V, Truchi M, Caballero I, Leroy S, Marquette CH, Marcet B, Barbry P, Zaragosi LE, 2019. Novel dynamics of human mucociliary differentiation revealed by single-cell RNA sequencing of nasal epithelial cultures. Development 146 (20), dev177428. [DOI] [PMC free article] [PubMed] [Google Scholar]
- Saint-Criq V, Delpiano L, Casement J, Onuora JC, Lin J, Gray MA, 2020. Choice of differentiation media significantly impacts cell lineage and response to CFTR modulators in fully differentiated primary cultures of cystic fibrosis human airway epithelial cells. Cells 9 (9), 2137. [DOI] [PMC free article] [PubMed] [Google Scholar]
- Shaykhiev R, 2015. Multitasking basal cells: combining stem cell and innate immune duties. Eur. Respir. J 46, 894–897. [DOI] [PMC free article] [PubMed] [Google Scholar]
- Shi J, Fok KL, Dai P, Qiao F, Zhang M, Liu H, Sang M, Ye M, Liu Y, Zhou Y, Wang C, Sun F, Xie G, Chen H, 2021. Spatio-temporal landscape of mouse epididymal cells and specific mitochondria-rich segments defined by large-scale single-cell RNA-seq. Cell Disco 7, 34. [DOI] [PMC free article] [PubMed] [Google Scholar]
- Thomas J, Morle L, Soulavie F, Laurencon A, Sagnol S, Durand B, 2010. Transcriptional control of genes involved in ciliogenesis: a first step in making cilia. Biol. Cell 102, 499–513. [DOI] [PubMed] [Google Scholar]
- Travaglini KJ, Nabhan AN, Penland L, Sinha R, Gillich A, Sit RV, Chang S, Conley SD, Mori Y, Seita J, Berry GJ, Shrager JB, Metzger RJ, Kuo CS, Neff N, Weissman IL, Quake SR, Krasnow MA, 2020. A molecular cell atlas of the human lung from single-cell RNA sequencing. Nature 587, 619–625. [DOI] [PMC free article] [PubMed] [Google Scholar]
- Wang Y, Wang G, Tan X, Ke K, Zhao B, Cheng N, Dang Y, Liao N, Wang F, Zheng X, Li Q, Liu X, Liu J, 2019. MT1G serves as a tumor suppressor in hepatocellular carcinoma by interacting with p53. Oncogenesis 8, 67. [DOI] [PMC free article] [PubMed] [Google Scholar]
- Wu T, Hu E, Xu S, Chen M, Guo P, Dai Z, Feng T, Zhou L, Tang W, Zhan L, Fu X, Liu S, Bo X, Yu G, 2021. clusterProfiler 4.0: a universal enrichment tool for interpreting omics data. Innovation 2, 100141. [DOI] [PMC free article] [PubMed] [Google Scholar]
- Zoso A, Sofoluwe A, Bacchetta M, Chanson M, 2019. Transcriptomic profile of cystic fibrosis airway epithelial cells undergoing repair. Sci. Data 6, 240. [DOI] [PMC free article] [PubMed] [Google Scholar]
Associated Data
This section collects any data citations, data availability statements, or supplementary materials included in this article.
Supplementary Materials
Data Availability Statement
Data generated in this work are available at NCBI GEO:GSE191061