

Abstract
The largemouth bass (Micropterus salmoides) has become a cosmopolitan species due to its widespread introduction as game or domesticated fish. Here a high-quality chromosome-level reference genome of M. salmoides was produced by combining Illumina paired-end sequencing, PacBio single molecule sequencing technique (SMRT) and High-through chromosome conformation capture (Hi-C) technologies. Ultimately, the genome was assembled into 844.88 Mb with a contig N50 of 15.68 Mb and scaffold N50 length of 35.77 Mb. About 99.9% assembly genome sequences (844.00 Mb) could be anchored to 23 chromosomes, and 98.03% assembly genome sequences could be ordered and directed. The genome contained 38.19% repeat sequences and 2693 noncoding RNAs. A total of 26,370 protein-coding genes from 3415 gene families were predicted, of which 97.69% were functionally annotated. The high-quality genome assembly will be a fundamental resource to study and understand how M. salmoides adapt to novel and changing environments around the world, and also be expected to contribute to the genetic breeding and other research.
Subject terms: Genome, Agricultural genetics
| Measurement(s) | genome assemble |
| Technology Type(s) | Illumina paired-end sequencing, PacBio single molecule sequencing technique (SMRT) and High-through chromosome conformation capture (Hi-C) technologies |
| Sample Characteristic - Organism | Micropterus floridanus |
Background & Summary
The largemouth bass, Micropterus salmoides (Perciformes, Centrarchidae), is a native of North America introduced in other parts of the world, including the Iberian Peninsula, Italy, Mexico and China, either as a game or farmed fish1–3. It is now one of the top ten most common aquatic species in every continent, except Antarctica4,5, and has been listed among the top 100 invasive species6, with temperature and hydrologic changes as main predictors of its distribution1,7. Although its main habitat is freshwater lakes and rivers, it colonizes brackish waters, such as in the Gulf of Mexico and the Atlantic coasts of North America8. Largemouth bass has been introduced into China from the US in 19832, and it has become one of the main aquaculture species in China for its fast growth2,9.
The whole genome information is the basis for studying the nature of organisms, including advantages during biological invasions and adaptation to extreme environments such as hypoxia10–12, climate change13,14, temperature15,16 and salinity17,18. With the development of sequencing technology, genome research has been studied more deeply and accurately19. More and more fish genomes have been decoded, such as yellow perch (Perca flavescens)20, golden pompano (Trachinotus ovatus)21 and dark sleeper (Odontobutis potamophila)22, etc. Moreover, the Nile tilapia and Pacific bluefin tuna genome have been re-sequenced to improve the genome assembly and fill the previously missed gaps23,24. These genome studies have greatly elevated our understanding about genetics, environmental adaptive selection, and evolutionary history of the target species. These more detailed genomic data can also facilitate studies on nutritional requirements, disease control and prevention, and to improve traits of economic interest25–27.
In the present study, a novel high-quality chromosome-level genome assembly of largemouth bass was generated by single-molecule real-time sequencing combined with Illumina paired-end sequencing and Hi-C (Fig. 1). The final assembled genome size of M. salmoides was 844.88 Mb with an N50 contig length of 15.30 Mb and scaffold N50 length of 35.77 Mb. A total of 844.00 Mb assembled genome sequences were anchored on 23 chromosomes. The genome contained 38.19% repeat sequences and 2693 noncoding RNAs. A total of 26,370 protein-coding genes from 3415 gene families were predicted, of which 97.69% were functionally annotated.
Fig. 1.

The pipelines overview of the largemouth bass chromosome-level genome assembly. Chrs: chromosomes.
Methods
Ethics statement
All experiments were performed according to the Guidelines for the Care and Use of Laboratory Animals in China. The sampled fish in this study was approved by the Institutional Animal Care and Use Committee (IACUC) of the College of Animal Science and Technology of Sichuan Agricultural University, Sichuan, China, under permit No. DKY-YS13287.
Sequencing libraries
Tissues from a two-year-old adult female largemouth bass (body weight 1487 g, length 36 cm), obtained from an aquaculture farm of Chongzhou, Sichuan province, China, were used to construct genomic DNA sequencing libraries (muscle) and transcriptome sequencing libraries (liver, brain, muscle, heart, kidney, gill, and gonad). All the tissues were stored in liquid nitrogen until use.
For short-read sequencing, genomic DNA was extracted from 500 mg of muscle using cetyl trimethylammonium bromide (CTAB) before chloroform purification. The genomic DNA was sonicated to a fragment size of 350 bp and the paired-end genomic library was prepared following the Illumina standard protocol, including terminal repair, polyA and adaptor addition, target fragment selection and PCR processes (Illumina, San Diego, CA, USA). The resulted library was quality checked using Agilent Bioanalyser 2100 and qPCR, and sequenced on an Illumina NovaSeq 6000 sequencing platform with paired-end 150 bp read layout.
For long-read sequencing, genomic DNA (~8 µg) was sheared into a large fragment by g-TUBE (Covaris), purified and recovered by AMpure PB magnetic beads, and used to construct single-molecule real-time bell (SMRTbell) sequencing libraries by the SMRTbell Template Prep Kit 2.0 (PacBio)28. The end-repaired fragments were size-selected using the Blue Pippin Size-Selection System (Sage Science, MA, USA), and damage-repaired using the SMRTbell Damage Repair Kit (PacBio). Then the products were combined polymerase using the PacBio DNA/Polymerase Kit before sequenced on the PacBio Sequel platform.
The full-length transcriptome was used to generate RNA data for gene prediction from a sample pool consisting of muscle, liver, gonad, kidney, gut, blood, and gills. Total RNA was extracted by TRIzol extraction reagent (Invitrogen, USA) according to the manufacturer’s protocol. RNA purity was checked using the NanoPhotometer spectrophotometer (IMPLEN, CA, USA). RNA concentration was measured using Qubit RNA Assay Kit in Qubit 2.0 Flurometer (Life Technologies, CA, USA). Then, these tissues RNA were equally mixed to product cDNA using the SMARTer PCR cDNA Synthesis Kit and sequencing by one SMRT flow cell on the PacBio Sequel platform. Raw reads were processed into error corrected reads of insert (ROIs) using Iso-seq pipeline with minFullPass = 0 and minPredictedAccuracy = 0.90. Next, full-length, non-chemiric (FLNC) transcripts were determined by searching for the polyA tail signal and the 5′ and 3′ cDNA primers in ROIs. Full-length consensus sequences obtained from ICE (Iterative Clustering for Error Correction) were polished using Quiver. Finally, Full-length transcriptome sequencing yielded 20 Gb of clean data, including 26,369 high-quality consensus isoforms sequences with an average length of 2,895 bp.
Genome survey and assembly
The size, heterozygosity, and repetitive sequences in the M. salmoides genome were estimated by the analysis of k-mer frequency distribution of Illumina paired-end reads using the kmer_freq_stat script (Biomarker Technologies, Beijing, China), based on the formula G = (N k-mer - Nerror_k-mer)/D (where G: genome size; N k-mer: the number of k-mers; Nerror_k-mer: the number of depth 1 k-mers; D: the k-mer depth). After removing the k-mers with abnormal depth, a total of 49.16 M k-mers were obtained with a k-mers peak at a depth of 56 (Fig. 2). A total of 58.51 Gb high-quality filtered data was generated from the Illumina short read DNA library, with 66.94 × genome coverage, a Q20 of 96.63% and a Q30 of 91.36% (Table 1). The genome size was estimated at 874.14 Mb, with 0.12% heterozygosity, 30.03% repetitive sequences, and 40.88% GC content (Table 1).
Fig. 2.
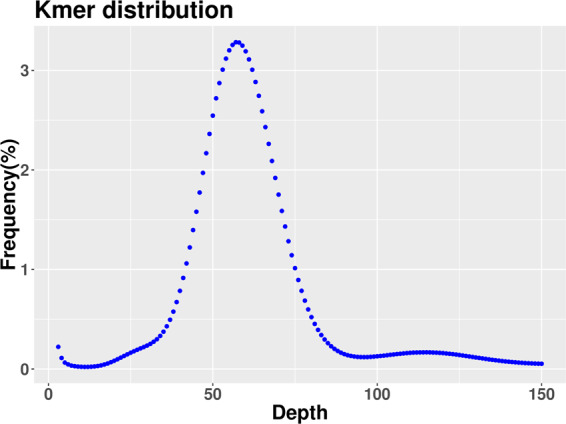
K‐mer distribution of M. salmoides genome sequencing reads. The K-mers distribution (K = 19) was constructed using 350 bp library data. A total of 49,157,214,151 K-mers were used for genomic length estimation after the removal of the K-mers with abnormal depth. The peak 19‐mer depth was 56, and the genome size was calculated as 49,157,214,151/56 = 874.14 Mb.
Table 1.
M. salmoides genome sequencing statistics.
| Library | Sequencing platform | Clean data (Gb) | Depth (×) | Contig N50 (Mb) | GC content (%) | Q20 (%) | Q30 (%) | Genome size (Mb) |
|---|---|---|---|---|---|---|---|---|
| Short reads | Illumina NovaSeq 6000 | 58.51 | 66.94 | — | 40.88 | 96.63 | 91.36 | 874.14 |
| Long reads | PacBio Sequel | 94.69 | 112.07 | 15.68 | 40.78 | — | — | 844.88 |
| Hi-C | Illumina NovaSeq 6000 | 77.53 | 94.06 | 15.30 | 40.78 | 97.59 | 93.49 | 844.00 |
For long-read sequencing, reads longer than 500 bp generated by the PacBio Sequel platform were collected and a de novo genome was assembled initially using SMARTdenovo29 based on the data corrected by Canu v. 1.530. Subsequently, three rounds of refinement of the de novo genome were performed using Pilon31 by Illumina short read sequencing data. Finally, the long-read SMRTbell library generated a total of 94.69 Gb (112.07 × genome coverage) with a reads N50 of 35.34 kb and an average read length of 24.75 kb. After error correction and assembly, an 844.88 Mb genome was assembled from 265 contigs with a N50 of 15.68 Mb (Table 1).
Hi-C analysis and chromosome assembly
Hi-C libraries were prepared as previously reported32,33. Briefly, muscle tissue cells were fixed with formaldehyde to maintain the 3D structure of DNA in cells and the cells were digested using restriction endonuclease Hind III. Then, biotin-labeled bases were introduced using the DNA terminal repair mechanism. DNA (4 µg) was fragmented by a Covaris S220 focused-ultrasonicator (Gene Company Limited, Hong Kong) and 300–700 bp fragments were recovered. The DNA fragments containing interaction relationships were captured by streptavidin immunomagnetic beads for library construction. Library concentration and insert size were determined using the Qubit 3.0 and LabChip GX platforms (PerkinElmer), respectively. qPCR was used to estimate the effective concentration of the library. High quality Hi-C libraries were sequenced on the Illumina NovaSeq 6000 sequencing platform, and the sequencing data were used for chromosome-level assembly34. The software Burrows-Wheeler Aligner (BWA-MEM v. 0.7.10-r789) was used to align the sequencing pair-end clean reads with the sequence of the assembled genome to obtain the uniquely mapped read pairs35. The uniquely mapped read pairs were processed using HiC-Pro36. The genome contigs, split into 50 kb segments, combined with uniquely matched Hi-C data, were clustered, ordered and directed onto the pseudochromosomes using LACHESIS34 with the following parameters: CLUSTER_MIN_RE_SITES = 30; CLUSTER_MAX_LINK_DENSITY = 2; CLUSTER_NONINFORMATIVE_RATIO = 2; ORDER_MIN_N_RES_IN_TRUN = 68; ORD-ER_MIN_N_RES_I-N_SHREDS = 67. Finally, the chromosome assemblies were cut into 100 kb bins of equal lengths and the interaction signals generated by the valid mapped read pairs between each bin were visualized in a heat map.
In total, 277.88 million read pairs (77.53 Gb clean data; 94.06 × coverage of the genome) were generated from the Hi-C library (Table 1), of which 77.26% were uniquely mapped on the assembled genome. Of the unique mapped read pairs, 60.67% were the valid interaction pairs (130.26 million), which were used for the next Hi-C assembly (Table S1). A total of 844.00 Mb (99.9%) assembled genome sequences were anchored on 23 chromosomes, and the order and direction of 827.39 Mb (98.03%) sequences could be determined. The detailed distribution of each chromosome sequence was shown in Table 2. The heat map of the Hi-C assembly interaction bins is consistent a genome assembly of excellent quality (Fig. 3). Finally, the genome size of M. salmoides was assembled at 844.88 Mb, while contig N50 and scaffold N50 were 15.30 Mb and 35.77 Mb, respectively (Table 1).
Table 2.
The sequence distribution of each chromosome using Hi-C technology.
| Group | Cluster Num | Cluster Len | Order Num | Order Len |
|---|---|---|---|---|
| Chr01 | 5 | 40,821,207 | 4 | 40,732,462 |
| Chr02 | 15 | 42,659,052 | 9 | 42,039,393 |
| Chr03 | 7 | 37,588,897 | 6 | 37,343,944 |
| Chr04 | 13 | 40,393,715 | 9 | 39,732,765 |
| Chr05 | 15 | 39,747,164 | 6 | 38,411,921 |
| Chr06 | 10 | 36,025,099 | 6 | 35,600,334 |
| Chr07 | 9 | 34,881,373 | 6 | 34,516,066 |
| Chr08 | 2 | 37,271,896 | 2 | 37,271,896 |
| Chr09 | 5 | 37,188,422 | 4 | 37,114,295 |
| Chr10 | 4 | 36,011,566 | 3 | 35,768,921 |
| Chr11 | 11 | 33,902,165 | 5 | 33,113,071 |
| Chr12 | 15 | 35,527,541 | 8 | 34,268,756 |
| Chr13 | 5 | 33,494,735 | 4 | 33,265,410 |
| Chr14 | 11 | 34,134,741 | 8 | 33,564,293 |
| Chr15 | 24 | 37,902,394 | 11 | 35,937,762 |
| Chr16 | 9 | 32,104,916 | 6 | 31,675,598 |
| Chr17 | 7 | 32,964,910 | 4 | 32,674,911 |
| Chr18 | 26 | 34,562,858 | 13 | 33,055,325 |
| Chr19 | 31 | 41,218,652 | 16 | 38,871,204 |
| Chr20 | 6 | 32,259,510 | 5 | 32,214,040 |
| Chr21 | 3 | 28,886,792 | 3 | 28,886,792 |
| Chr22 | 18 | 56,175,891 | 7 | 54,208,627 |
| Chr23 | 15 | 28,271,698 | 8 | 27,127,050 |
| Total (Ratio %) | 266 (97.08) | 843995194 (99.9) | 153 (57.52) | 827394836 (98.03) |
Note: Chr01-23 represent 23 chromosomes; Cluster Num: the number of sequences located on a chromosome; Cluster Len: the length of sequence located on a chromosome; Order Num: the number of sequences of the direction can be determined; Order Len: the sequence length of the direction can be determined.
Fig. 3.

Hi-C assembly of chromosome interactive heat map. Chr01 - Chr23 are the abbreviations of 23 Chromosome. The abscissa and ordinate represent the order of each bin on the corresponding chromosome group. The colour block illuminates the intensity of interaction from yellow (low) to red (high).
Repeats prediction
The repetitive elements of the M. salmoides genome were identified and annotated using RepeatModeler2 containing RECON37 and RepeatScout38. The derived repetitive sequences were searched against curated libraries and the repetitive DNA element databases Repbase39, REXdb40 and Dfam41. The LTR retrotransposon retriever42 was applied to identify the output from LTRharvest43 and LTR_FINDER44. The results were combined and deduplicated, and the repetitive elements were finalized by RepeatMasker45. About 38.19% M. salmoides genome was repetitive sequences, composed mainly of class II transposable elements (Table 3).
Table 3.
The repeat sequence statistics of assembled genome.
| Type | Number | Length (bp) | Rate (%) |
|---|---|---|---|
| Class I: Retroelement | 522983 | 121796357 | 14.42 |
| DIRS | 20880 | 6630621 | 0.78 |
| LINE | 234381 | 60698831 | 7.18 |
| LTR/Caulimovirus | 88 | 7962 | 0.00 |
| LTR/Copia | 12013 | 2607825 | 0.31 |
| LTR/ERV | 47996 | 6147308 | 0.73 |
| LTR/Gypsy | 103367 | 26357115 | 3.12 |
| LTR/Ngaro | 16775 | 2880533 | 0.34 |
| LTR/Pao | 13115 | 2271034 | 0.27 |
| LTR/Unknown | 37371 | 10223745 | 1.21 |
| LTR/Viper | 61 | 3732 | 0.00 |
| SINE | 36936 | 3967651 | 0.47 |
| Class II: DNA transposon | 1033511 | 198005683 | 23.44 |
| Academ | 1422 | 193616 | 0.02 |
| CACTA | 77241 | 10508494 | 1.24 |
| Crypton | 16505 | 2182911 | 0.26 |
| Dada | 7317 | 1072578 | 0.13 |
| Ginger | 4624 | 459506 | 0.05 |
| Helitron | 24163 | 10814282 | 1.28 |
| IS3EU | 3766 | 495816 | 0.06 |
| Kolobok | 31541 | 7047090 | 0.83 |
| MITE | 33 | 1774 | 0.00 |
| Maverick | 6547 | 1489673 | 0.18 |
| Merlin | 3162 | 472124 | 0.06 |
| Mutator | 6833 | 746138 | 0.09 |
| Novosib | 12838 | 1115265 | 0.13 |
| P | 15516 | 3779929 | 0.45 |
| PIF-Harbinger | 72041 | 15425212 | 1.83 |
| PiggyBac | 14753 | 2257482 | 0.27 |
| Sola | 7027 | 701813 | 0.08 |
| Stowaway | 1 | 57 | 0.00 |
| Tc1-Mariner | 115093 | 29999050 | 3.55 |
| Unknown | 128215 | 21996228 | 2.60 |
| Zator | 1443 | 282595 | 0.03 |
| Zisupton | 26754 | 4017294 | 0.48 |
| hAT | 456676 | 82946756 | 9.82 |
| Satellite | 4604 | 769122 | 0.09 |
| Unknown | 11211 | 2133201 | 0.25 |
| Total | 1572309 | 322704363 | 38.19 |
Note: Type: the type of repetitive sequence (Class I: retrotransposons; Class II: DNA transposon); Number: the number of repetitive sequences; Length: the total length of predicted repetitive sequences; Rate (%): the proportion of repetitive sequences in the total genome.
Genes prediction and annotation
The prediction of the genome gene structure was based on three different strategies: ab initio-based, homolog-based, and unigene-based. Genscan46, Augustus v2.447, GlimmerHMM v3.0.448, GeneID v1.449 and SNAP (version 2006-07-28)50 were used to perform ab initio-based prediction. GeMoMa v1.3.151,52 was used for prediction based on homologous species. Hisat v2.0.453 and Stringtie v1.2.354 were used for assembly based on reference transcripts, and TransDecoder v2.0 and GeneMarkS -t v5.155 were used for gene prediction. PASA v2.0.256 was used to predict unigene sequences based on unreferenced assembly of full-length transcriptome data. Finally, EVM v1.1.157 was used to integrate the prediction results obtained by the above three methods, and PASA v2.0.2 was used to modify the final gene models. A total of 26,370 protein-coding genes were predicted by integrating the prediction of ab initio, homology-based and RNA-seq strategies (Table S2), with average gene length of 14,483 bp, exon length of 2,601 bp, coding sequence of 1,724 bp and intron length of 11,882 bp (Table 4). Finally, 25,760 genes (97.69% of the total) were successfully annotated GO, KEGG, KOG, TrEMBL, and NR database (Table S3).
Table 4.
The basic information statistics of assembled genome.
| Item | Count |
|---|---|
| Gene Number | 26,370 |
| Gene Length (bp) | 381,932,021 |
| Average Gene Length (bp) | 14,483.58 |
| Exon Length (bp) | 68,599,926 |
| Average Exon Length (bp) | 2,601.44 |
| Exon Number | 260,466 |
| Average Exon Number | 9.88 |
| CDS Length (bp) | 45,485,238 |
| Average CDS Length (bp) | 1,724.89 |
| CDS Number | 253,748 |
| Average CDS Number | 9.62 |
| Intron Length (bp) | 313,332,095 |
| Average Intron Length (bp) | 11,882.14 |
| Intron Number | 234,096 |
| Average Intron Number | 8.88 |
Blastn searches using the Rfam database58, as input against the M. salmoides genome was used to identify microRNA and rRNA and tRNAscan-SE59 was used to identify tRNA. Non-coding RNAs were predicted to be 2,639, including 633 microRNAs (miRNA) of 84 families, 230 rRNA genes of 4 families and 1,830 tRNA genes of 25 families (Table S4). Pseudogenes were predicted in the following way. The predicted protein sequences were used to search for homologous gene sequences (putative genes) through BLAT alignment60. Then GeneWise61 was used to search for immature termination codons and code-shifting mutations in the gene sequences to obtain pseudogenes. In total, 986 pseudogenes were identified with a total length of 5,885,501 bp and an average length of 5,969 bp (Table S4).
Data Records
The sequencing data (Full-length transcriptome, Hi-C, Illumina and PacBio) have been deposited in SRA (Sequence Read Archive) database as SRR1288657562, SRR1288657663, SRR1288657764, and SRR1288657865. The assembly genome data was deposited in GenBank66. The assembly genome data, gene CDS and Exon data and functional annotations were also stored in Figshare67.
Technical Validation
The assembly was evaluated using three criteria: the mapping of Illumina reads, core gene integrity, and BUSCO assessment. The Benchmarking Universal Single Copy Orthologs were searched in CEGMA v2.568 and BUSCO v 3.069 to evaluate the conserved core genes in the genome. The Illumina reads fully (99.54%) mapped to the assembled genome, including 97.78% of paired-end reads. A total of 445 out of in 458 conserved eukaryotic core genes from the CEGMA database were found in the assembled genome (Table S5). Finally, 97.49% of the complete BUSCOs were included in the assembled genome (Table S5). In summary, this is a high-quality de novo assembly reference genome.
Supplementary information
Author contributions
Song Yang managed the grants, supervised the laboratory work, and led the design of this study. Kuo He, Liulan Zhao and Zihao Yuan performed bioinformatics and also drafted the manuscript. Adelino Canario, Qiao Liu, Siyi Chen, Jiazhong Guo, Wei Luo, and Lisen Li revised the manuscript. Dongmei Zhang, Haoxiao Yan participated in the tissue sampling. All authors read and approved the final manuscript.
Code availability
All commands and pipelines used in data processing were executed according to the manual and protocols of the corresponding bioinformatics software.
Competing interests
The authors declare no competing interests.
Footnotes
Publisher’s note Springer Nature remains neutral with regard to jurisdictional claims in published maps and institutional affiliations.
These authors contributed equally: Kuo He, Liulan Zhao, Zihao Yuan.
Supplementary information
The online version contains supplementary material available at 10.1038/s41597-022-01601-1.
References
- 1.Bae M-J, Murphy CA, García-Berthou E. Temperature and hydrologic alteration predict the spread of invasive Largemouth Bass (Micropterus salmoides) Sci. Total Environ. 2018;639:58–66. doi: 10.1016/j.scitotenv.2018.05.001. [DOI] [PubMed] [Google Scholar]
- 2.Bai J, Dijar L-C, Quan Y, Liang S. Taxonomic status and genetic diversity of cultured largemouth bass Micropterus salmoides in China. Aquaculture. 2008;278:27–30. doi: 10.1016/j.aquaculture.2008.03.016. [DOI] [Google Scholar]
- 3.García-Berthou E, et al. Introduction pathways and establishment rates of invasive aquatic species in Europe. Can. J. Fish. Aquat. Sci. 2005;62:453–463. doi: 10.1139/f05-017. [DOI] [Google Scholar]
- 4.García-Berthou, E. Ontogenetic diet shifts and interrupted piscivoryin introduced largemouth bass (Micropterus salmoides). Int. Rev. Hydrobiol. 87, 353–363, 10.1002/1522-2632(200207)87:4%3C353::AID-IROH353%3E3.0.CO;2-N (2002).
- 5.Sun JL, et al. Interactive effect of thermal and hypoxia on largemouth bass (Micropterus salmoides) gill and liver: Aggravation of oxidative stress, inhibition of immunity and promotion of cell apoptosis. Fish and Shellfish Immunology. 2020;98:923–936. doi: 10.1016/j.fsi.2019.11.056. [DOI] [PubMed] [Google Scholar]
- 6.Lowe, S., Browne, M., Boudjelas, S. & Poorter, M. D. 100 of the World’s Worst Invasive Alien Species A selection from the Global Invasive Species Database. The Invasive Species Specialist Group, 12 pp, https://www.researchgate.net/publication/273442552_100_of_the_World’s_Worst_Invasive_Alien_Species_A_Selection_From_the_Global_Invasive_Species_Database (2000).
- 7.Letizia CM, et al. The role of alien fish (the centrarchid Micropterus salmoides) in lake food webs highlighted by stable isotope analysis. Freshwat. Biol. 2018;63:1130–1142. doi: 10.1111/fwb.13122. [DOI] [Google Scholar]
- 8.Glover DC, DeVries DR, Wright RA. Effects of temperature, salinity and body size on routine metabolism of coastal largemouth bass Micropterus salmoides. J. Fish Biol. 2012;81:1463–1478. doi: 10.1111/j.1095-8649.2012.03385.x. [DOI] [PubMed] [Google Scholar]
- 9.Zhou Y-L, Guo J-L, Tang R-J, Ma H-J, Lin S-M. High dietary lipid level alters the growth, hepatic metabolism enzyme, and anti-oxidative capacity in juvenile largemouth bass Micropterus salmoides. Fish Physiol. Biochem. 2020;46:125–134. doi: 10.1007/s10695-019-00705-7. [DOI] [PubMed] [Google Scholar]
- 10.Gou X, et al. Whole-genome sequencing of six dog breeds from continuous altitudes reveals adaptation to high-altitude hypoxia. Genome Res. 2014;24:1308–1315. doi: 10.1101/gr.171876.113. [DOI] [PMC free article] [PubMed] [Google Scholar]
- 11.Huerta-Sa´nchez E, et al. Altitude adaptation in Tibetans caused by introgression of Denisovan-like DNA. Nature. 2014;512:194–197. doi: 10.1038/nature13408. [DOI] [PMC free article] [PubMed] [Google Scholar]
- 12.Sun JL, et al. Acute hypoxia changes the mode of glucose and lipid utilization in the liver of the largemouth bass (Micropterus salmoides) Sci. Total Environ. 2020;713:135157. doi: 10.1016/j.scitotenv.2019.135157. [DOI] [PubMed] [Google Scholar]
- 13.Hoffmann AA, Sgro CM. Climate change and evolutionary adaptation. Nature. 2011;470:479–485. doi: 10.1038/nature09670. [DOI] [PubMed] [Google Scholar]
- 14.Dam HG. Evolutionary adaptation of marine zooplankton to global change. Annual review of marine science. 2013;5:349–370. doi: 10.1146/annurev-marine-121211-172229. [DOI] [PubMed] [Google Scholar]
- 15.Cruz ALB, et al. Similar temperature dependencies of glycolytic enzymes: an evolutionary adaptation to temperature dynamics? BMC Syst. Biol. 2012;6:151. doi: 10.1186/1752-0509-6-151. [DOI] [PMC free article] [PubMed] [Google Scholar]
- 16.Chen Z, Narum SR. Whole genome resequencing reveals genomic regions associated with thermal adaptation in redband trout. Mol. Ecol. 2021;30:162–174. doi: 10.1111/mec.15717. [DOI] [PubMed] [Google Scholar]
- 17.Sun C, et al. Chromosome-level genome assembly for the largemouth bass Micropterus salmoides provides insights into adaptation to fresh and brackish water. Molecular Ecology Resources. 2021;21:301–315. doi: 10.1111/1755-0998.13256. [DOI] [PubMed] [Google Scholar]
- 18.Xiong, Y. et al. Comparisons of Salinity Adaptation in Terms of Growth, Body Composition, and Energy Budget in Juveniles of Rainbow and Steelhead Trouts (Oncorhynchus mykiss). J. Ocean Univ. China 18, 10.1007/s11802-019-3770-4 (2019).
- 19.Gao Y, et al. Single-molecule Real-time (SMRT) Isoform Sequencing (Iso-Seq) in Plants: The Status of the Bioinformatics Tools to Unravel the Transcriptome Complexity. Current Bioinformatics. 2019;14:566–573. doi: 10.2174/1574893614666190204151746. [DOI] [Google Scholar]
- 20.Feron R, et al. Characterization of a Y-specific duplication/insertion of the anti-Mullerian hormone type II receptor gene based on a chromosome-scale genome assembly of yellow perch, Perca flavescens. Molecular Ecology Resources. 2020;20:531–543. doi: 10.1111/1755-0998.13133. [DOI] [PMC free article] [PubMed] [Google Scholar]
- 21.Zhang DC, et al. Chromosome-level genome assembly of golden pompano (Trachinotus ovatus) in the family Carangidae. Scientific Data. 2019;6:216. doi: 10.1038/s41597-019-0238-8. [DOI] [PMC free article] [PubMed] [Google Scholar]
- 22.Jia Y, et al. A Chromosome-Level Genome Assembly of the Dark Sleeper Odontobutis potamophila. Genome Biology and Evolution. 2021;13:evaa271. doi: 10.1093/gbe/evaa271. [DOI] [PMC free article] [PubMed] [Google Scholar]
- 23.Conte MA, Gammerdinger WJ, Bartie KL, Penman DJ, Kocher TD. A high quality assembly of the Nile Tilapia (Oreochromis niloticus) genome reveals the structure of two sex determination regions. BMC Genomics. 2017;18:341. doi: 10.1186/s12864-017-3723-5. [DOI] [PMC free article] [PubMed] [Google Scholar]
- 24.Suda A, et al. Improvement of the Pacific bluefin tuna (Thunnus orientalis) reference genome and development of male-specific DNA markers. Scientific Reports. 2019;9:14450. doi: 10.1038/s41598-019-50978-4. [DOI] [PMC free article] [PubMed] [Google Scholar]
- 25.Shi CM, Zhao H, Zhai XL, Chen YJ, Lin SM. Linseed oil can decrease liver fat deposition and improve antioxidant ability of juvenile largemouth bass, Micropterus salmoides. Fish Physiol. Biochem. 2019;45:1513–1521. doi: 10.1007/s10695-019-00636-3. [DOI] [PubMed] [Google Scholar]
- 26.Camus A, Griffin M, Armwood A, Soto E. A Spontaneous Outbreak of Systemic Edwardsiella piscicida Infection in Largemouth Bass Micropterus salmoides (Lacepede, 1802) in California, USA. J. Fish Dis. 2019;42:759–763. doi: 10.1111/jfd.12961. [DOI] [PubMed] [Google Scholar]
- 27.Zhu Q, Wang Y, Feng J. Rapid diagnosis of largemouth bass ranavirus in fish samples using the loop-mediated isothermal amplification method. Mol. Cell. Probes. 2020;52:101569. doi: 10.1016/j.mcp.2020.101569. [DOI] [PubMed] [Google Scholar]
- 28.Korlach J, et al. Real-time DNA sequencing from single polymerase molecules. Methods Enzymol. 2010;472:431–455. doi: 10.1016/S0076-6879(10)72001-2. [DOI] [PubMed] [Google Scholar]
- 29.Liu H, Wu S, Li A, Ruan J. SMARTdenovo: a de novo assembler using long noisy reads. GigaByte. 2021;2021:1–9. doi: 10.46471/gigabyte.15. [DOI] [PMC free article] [PubMed] [Google Scholar]
- 30.Koren S, et al. Canu: scalable and accurate long-read assembly via adaptive k-mer weighting and repeat separation. Genome Res. 2017;27:722–736. doi: 10.1101/gr.215087.116. [DOI] [PMC free article] [PubMed] [Google Scholar]
- 31.Walker BJ, et al. Pilon: an integrated tool for comprehensive microbial variant detection and genome assembly improvement. PLoS One. 2014;9:e112963. doi: 10.1371/journal.pone.0112963. [DOI] [PMC free article] [PubMed] [Google Scholar]
- 32.Rao SSP, et al. A 3D map of the human genome at kilobase resolution reveals principles of chromatin looping. Cell. 2014;159:1665–1680. doi: 10.1016/j.cell.2014.11.021. [DOI] [PMC free article] [PubMed] [Google Scholar]
- 33.Gong, G. et al. Chromosomal-level assembly of yellow catfish genome using third-generation DNA sequencing and Hi-C analysis. Gigascience 7, 10.1093/gigascience/giy120 (2018). [DOI] [PMC free article] [PubMed]
- 34.Burton JN, et al. Chromosome-scale scaffolding of de novo genome assemblies based on chromatin interactions. Nat. Biotechnol. 2013;31:1119–1125. doi: 10.1038/nbt.2727. [DOI] [PMC free article] [PubMed] [Google Scholar]
- 35.Li H, Durbin R. Fast and accurate short read alignment with Burrows-Wheeler transform. Bioinformatics. 2009;25:1754–1760. doi: 10.1093/bioinformatics/btp324. [DOI] [PMC free article] [PubMed] [Google Scholar]
- 36.Servant N, et al. HiC-Pro: an optimized and flexible pipeline for Hi-C data processing. Genome Biology. 2015;16:259. doi: 10.1186/s13059-015-0831-x. [DOI] [PMC free article] [PubMed] [Google Scholar]
- 37.Bao Z, Eddy SR. Automated de novo identification of repeat sequence families in sequenced genomes. Genome Res. 2002;12:1269–1276. doi: 10.1101/gr.88502. [DOI] [PMC free article] [PubMed] [Google Scholar]
- 38.Price AL, Jones NC, Pevzner PA. De novo identification of repeat families in large genomes. Bioinformatics. 2005;21:i351–i358. doi: 10.1093/bioinformatics/bti1018. [DOI] [PubMed] [Google Scholar]
- 39.Bao W, Kojima KK, Kohany O. Repbase Update, a database of repetitive elements in eukaryotic genomes. Mob. DNA. 2015;6:11. doi: 10.1186/s13100-015-0041-9. [DOI] [PMC free article] [PubMed] [Google Scholar]
- 40.Neumann P, Novák P, Hoštáková N, Macas J. Systematic survey of plant LTR-retrotransposons elucidates phylogenetic relationships of their polyprotein domains and provides a reference for element classification. Mob. DNA. 2019;10:1. doi: 10.1186/s13100-018-0144-1. [DOI] [PMC free article] [PubMed] [Google Scholar]
- 41.Wheeler TJ, et al. Dfam: a database of repetitive DNA based on profile hidden Markov models. Nucleic Acids Res. 2013;41:D70–D82. doi: 10.1093/nar/gks1265. [DOI] [PMC free article] [PubMed] [Google Scholar]
- 42.Ou S, Jiang N. LTR_retriever: A Highly Accurate and Sensitive Program for Identification of Long Terminal Repeat Retrotransposons. Plant Physiol. 2018;176:1410–1422. doi: 10.1104/pp.17.01310. [DOI] [PMC free article] [PubMed] [Google Scholar]
- 43.Ellinghaus D, Kurtz S, Willhoeft U. LTRharvest, an efficient and flexible software for de novo detection of LTR retrotransposons. BMC Bioinformatics. 2008;9:18. doi: 10.1186/1471-2105-9-18. [DOI] [PMC free article] [PubMed] [Google Scholar]
- 44.Ou S, Jiang N. LTR_FINDER_parallel: parallelization of LTR_FINDER enabling rapid identification of long terminal repeat retrotransposons. Mob. DNA. 2019;10:48. doi: 10.1186/s13100-019-0193-0. [DOI] [PMC free article] [PubMed] [Google Scholar]
- 45.Tarailo-Graovac, M. & Chen, N. Using RepeatMasker to Identify Repetitive Elements in Genomic Sequences. Curr. Protoc. Bioinformatics 25, 10.1002/0471250953.bi0410s25 (2009). [DOI] [PubMed]
- 46.Driscoll DA, Hardy CM. Dispersal and phylogeography of the agamid lizard Amphibolurus nobbi in fragmented and continuous habitat. Mol. Ecol. 2005;14:1613–1629. doi: 10.1111/j.1365-294X.2005.02509.x. [DOI] [PubMed] [Google Scholar]
- 47.Stanke M, Waack S. Gene prediction with a hidden Markov model and a new intron submodel. Bioinformatics. 2003;19:ii215–ii225. doi: 10.1093/bioinformatics/btg1080. [DOI] [PubMed] [Google Scholar]
- 48.Majoros WH, Pertea M, Salzberg SL. TigrScan and GlimmerHMM: two open source ab initio eukaryotic gene-finders. Bioinformatics. 2004;20:2878–2879. doi: 10.1093/bioinformatics/bth315. [DOI] [PubMed] [Google Scholar]
- 49.Alioto T, Blanco E, Parra GI, Guigo R. Using geneid to Identify Genes. Curr. Protoc. Bioinformatics. 2018;64:e56. doi: 10.1002/cpbi.56. [DOI] [PubMed] [Google Scholar]
- 50.Shapiro MD, et al. Genetic and developmental basis of evolutionary pelvic reduction in threespine sticklebacks. Nature. 2004;428:717–723. doi: 10.1038/nature02415. [DOI] [PubMed] [Google Scholar]
- 51.Keilwagen J, et al. Using intron position conservation for homology-based gene prediction. Nucleic Acids Res. 2016;44:e89. doi: 10.1093/nar/gkw092. [DOI] [PMC free article] [PubMed] [Google Scholar]
- 52.Keilwagen J, Hartung F, Paulini M, Twardziok SO, Grau J. Combining RNA-seq data and homology-based gene prediction for plants, animals and fungi. BMC Bioinformatics. 2018;19:189. doi: 10.1186/s12859-018-2203-5. [DOI] [PMC free article] [PubMed] [Google Scholar]
- 53.Kim D, Langmead B, Salzberg SL. HISAT: a fast spliced aligner with low memory requirements. Nat. Methods. 2015;12:357–360. doi: 10.1038/nmeth.3317. [DOI] [PMC free article] [PubMed] [Google Scholar]
- 54.Pertea M, et al. StringTie enables improved reconstruction of a transcriptome from RNA-seq reads. Nat. Biotechnol. 2015;33:290–295. doi: 10.1038/nbt.3122. [DOI] [PMC free article] [PubMed] [Google Scholar]
- 55.Tang S, Lomsadze A, Borodovsky M. Identification of protein coding regions in RNA transcripts. Nucleic Acids Res. 2015;43:e78. doi: 10.1093/nar/gkv227. [DOI] [PMC free article] [PubMed] [Google Scholar]
- 56.Campbell MA, Haas BJ, Hamilton JP, Mount SM, Buell CR. Comprehensive analysis of alternative splicing in rice and comparative analyses with Arabidopsis. BMC Genomics. 2006;7:327. doi: 10.1186/1471-2164-7-327. [DOI] [PMC free article] [PubMed] [Google Scholar]
- 57.Haas BJ, et al. Automated eukaryotic gene structure annotation using EVidenceModeler and the Program to Assemble Spliced Alignments. Genome Biology. 2008;9:R7. doi: 10.1186/gb-2008-9-1-r7. [DOI] [PMC free article] [PubMed] [Google Scholar]
- 58.Griffiths-Jones S, et al. Rfam: annotating non-coding RNAs in complete genomes. Nucleic Acids Res. 2005;33:D121–D124. doi: 10.1093/nar/gki081. [DOI] [PMC free article] [PubMed] [Google Scholar]
- 59.Lowe TM, Eddy SR. tRNAscan-SE: a program for improved detection of transfer RNA genes in genomic sequence. Nucleic Acids Res. 1997;25:955–964. doi: 10.1093/nar/25.5.955. [DOI] [PMC free article] [PubMed] [Google Scholar]
- 60.Kent WJ. BLAT–the BLAST-like alignment tool. Genome Res. 2002;12:656–664. doi: 10.1101/gr.229202. [DOI] [PMC free article] [PubMed] [Google Scholar]
- 61.She R, Chu JS-C, Wang K, Pei J, Chen N. GenBlastA: enabling BLAST to identify homologous gene sequences. Genome Res. 2009;19:143–149. doi: 10.1101/gr.082081.108. [DOI] [PMC free article] [PubMed] [Google Scholar]
- 62.2021. NCBI Sequence Read Archive. SRR12886575
- 63.2021. NCBI Sequence Read Archive. SRR12886576
- 64.2021. NCBI Sequence Read Archive. SRR12886577
- 65.2021. NCBI Sequence Read Archive. SRR12886578
- 66.Song Y, 2022. Micropterus salmoides isolate LMB-001, whole genome shotgun sequencing project. GenBank. JAKUMD000000000.1
- 67.Kuo H. 2022. Largemouth bass chromosome-level reference genome. figshare. [DOI]
- 68.Parra G, Bradnam K, Korf I. CEGMA: a pipeline to accurately annotate core genes in eukaryotic genomes. Bioinformatics. 2007;23:1061–1067. doi: 10.1093/bioinformatics/btm071. [DOI] [PubMed] [Google Scholar]
- 69.Simão FA, Waterhouse RM, Ioannidis P, Kriventseva EV, Zdobnov EM. BUSCO: assessing genome assembly and annotation completeness with single-copy orthologs. Bioinformatics. 2015;31:3210–3212. doi: 10.1093/bioinformatics/btv351. [DOI] [PubMed] [Google Scholar]
Associated Data
This section collects any data citations, data availability statements, or supplementary materials included in this article.
Data Citations
- 2021. NCBI Sequence Read Archive. SRR12886575
- 2021. NCBI Sequence Read Archive. SRR12886576
- 2021. NCBI Sequence Read Archive. SRR12886577
- 2021. NCBI Sequence Read Archive. SRR12886578
- Song Y, 2022. Micropterus salmoides isolate LMB-001, whole genome shotgun sequencing project. GenBank. JAKUMD000000000.1
- Kuo H. 2022. Largemouth bass chromosome-level reference genome. figshare. [DOI]
Supplementary Materials
Data Availability Statement
All commands and pipelines used in data processing were executed according to the manual and protocols of the corresponding bioinformatics software.