

Abstract
Objective or Purpose:
To utilize a deep learning (DL) model trained via federated learning (FL), a method of collaborative training without sharing patient data, to delineate institutional differences in clinician diagnostic paradigms and disease epidemiology in retinopathy of prematurity (ROP).
Design:
Evaluation of a diagnostic test or technology
Subjects, Participants, and/or Controls:
5,245 patients with wide-angle retinal imaging from the neonatal intensive care units of 7 institutions as part of the Imaging and Informatics in ROP (i-ROP) study. Images were labeled with the clinical diagnosis of plus disease (plus, pre-plus, no plus) that was documented in the chart, and a reference standard diagnosis (RSD) determined by three image-based ROP graders and the clinical diagnosis.
Methods, Intervention or Testing:
Demographics (birthweight [BW], gestational age [GA]), and clinical diagnoses for all eye exams were recorded from each institution. Using a FL approach, a DL model for plus disease classification was trained using only the clinical labels. The three class probabilities were then converted into a vascular severity score (VSS) for each eye exam, as well as an “institutional VSS” in which the average of the VSS values assigned to patients’ higher severity (“worse”) eyes at each exam was calculated for each institution.
Main Outcome Measures:
We compared demographics, clinical diagnosis of plus disease, and institutional VSS between institutions using the McNemar Bowker test, two-proportion Z test and one-way ANOVA with post-hoc analysis by Tukey-Kramer test. Single regression analysis was performed to explore the relationship between demographics and VSS.
Results:
We found that the proportion of patients diagnosed with pre-plus disease varied significantly between institutions (p<0.00l). Using the DL-derived VSS trained on the data from all institutions using FL, we observed differences in the institutional VSS, as well as level of vascular severity diagnosed as no plus (p<0.001) across institutions. A significant, inverse relationship between the institutional VSS and the mean GA was found (p=0.049, adjusted R2=0.49).
Conclusions:
A DL-derived ROP VSS developed without sharing data between institutions using FL identified differences in the clinical diagnosis of plus disease, and overall levels of ROP severity between institutions. FL may represent a method to standardize clinical diagnosis and provide objective measurement of disease for image-based diseases.
Keywords: retinopathy of prematurity, federated learning, deep learning, epidemiology
Introduction
Retinopathy of prematurity (ROP) is typically diagnosed by an eye exam at the bedside in neonatal intensive care units (NICU) around the world. The disease is classified according to the International Classification of ROP (ICROP) into zone, stage, and plus disease.1 According to clinical trials, the presence of plus disease, based on comparison to a reference standard, is the most important feature determining the need for treatment in ROP. Even prior to the routine use of photo documentation, it was clear that clinicians did not always apply this diagnosis consistently.2 However, it was not clear how widespread the variability in practice might be or how frequently it may affect treatment decisions.
In the past 10–20 years, digital fundus imaging has permitted photo documentation of disease and paved the way for not only ROP telemedicine, but also many studies of inter-clinician diagnostic differences.3–8 Based on these studies, the ICROP, 3rd edition recognized that pre-plus and plus disease represent a continuous spectrum of vascular abnormality with clinical agreement at the ends of the spectrum, but significant diagnostic disagreement in the middle.1 Development of large multi-institutional datasets of images has enabled the establishment of reference standard diagnoses (RSD) and the use of deep learning (DL) models for automated diagnosis of plus disease.
One application of these models has been the development and evaluation of a ROP vascular severity score (VSS). The VSS correlates well with the zone, stage, and extent of pathology in ROP, essentially serving as a surrogate marker for the overall severity of ROP. The VSS has also been used to compare inter- and intra-observer differences in the diagnosis of plus disease, monitor disease progression, response to treatment, and improve risk modeling in ROP.9–13 These applications were all enabled by the use of DL based on the development of a multi-institutional dataset with RSD labels, however this approach is not always feasible. Besides the cost of developing and maintaining centralized data storage, there are privacy and institutional data sharing obstacles that limit the generalizability of this approach for this and other diseases.
Federated learning (FL) is an approach to collaborative train DL models across institutions without sharing data between them. Recent work by Lu et al has demonstrated that for the task of plus disease classification, FL using clinical labels alone (without an RSD and without developing a centralized database) can create a plus disease classifier that performs equivalently to a model developed using a centralized, RSD-based approach. In this paper, we evaluate whether a VSS based on this FL model may facilitate comparison of plus disease diagnosis and overall disease severity between institutions. If successful, this may represent a generalizable approach to assess clinician diagnostic paradigms as well as disease severity for epidemiological evaluation across institutions without sharing of patient data.
Methods
Dataset
We utilized the multicenter Imaging and Informatics in Retinopathy of Prematurity (i-ROP) dataset, composed of 5,245 ROP fundus images collected from premature infants in the neonatal intensive care units of 7 academic institutions between July 2011 and December 2016. This study was approved by institutional review boards at William Beaumont Hospital (Royal Oak, MI), Cedars-Sinai Medical Center (Los Angeles, CA), Children’s Hospital Los Angeles (Los Angeles, CA), Columbia University College of Physicians & Surgeons (New York, NY), Weill Cornell Medical College (New York, NY), University of Miami (Miami, FL) and Oregon Health & Science Institute (Portland, OR). Written informed consent was obtained from parents of all infants whose images were included in the dataset in the study, and the research conforms to the Declaration of Helsinki. All institutions adhered to standard imaging protocol, using a commercially available camera (RetCam; Natus Medical Incorporated, Pleasanton, CA). Only the posterior field of view was used for all experiments. Electronic records were reviewed for demographic information including gestational age and birthweight for each patient represented in the dataset.
Comparison of clinical diagnosis with reference standard diagnosis
We based our experiments on two sets of ground truth: the “clinical” label and a consensus reference standard diagnosis (RSD). Clinical labels were designated at time of bedside evaluation by the examining physician at each institution and subsequently put into the medical record. RSDs were based on the consensus diagnosis between three independent, masked image graders, which was then validated by the original clinical diagnosis. In cases where there was a discrepancy between the original clinical diagnosis and the three graders’ majority, a moderator reviewed the records with all three image readers again to reach a consensus for the RSD as previously described.14 For comparison of disease epidemiology based on clinical diagnosis, we compared the maximum category of plus (no plus, pre-plus, or plus) obtained for each baby during ROP screening. The proportions of pre-plus and plus disease by clinical diagnosis versus RSD were compared using McNemar-Bowker test with subsequent two-proportion Z testing. Quantitative information regarding patient birth weight (BW), gestational age (GA) and disease severity distribution were organized and compared between institutions using descriptive statistics including mean, median, standard deviation (SD) and range.
Federated learning model development
Lu et al described the development of four different models trained using multi-institutional data: centralized data hosting versus FL, and clinical labels versus RSD utilizing the ResNet-18 architecture.15 For this paper, we utilized the model developed using a FL approach based only on the clinical labels. That is, we used a model trained without use of a centralized data repository or expert RSD process, which represents a more realistic and scalable application of FL for clinical classification models. The point of this analysis was not to evaluate the performance of the FL algorithm, but to explore the clinical applications of this approach. The training process, including separation of training and testing populations was fully described in Lu et al.15 Briefly, our dataset was partitioned into a held-out testing set of 2,183 images (42%) and a development set of 3,062 images (58%), which was further divided into a training set (29%) and tuning set (28%). Relevant image vessel segments were highlighted in a pre-processing step utilizing a previously-trained U-Net.14,16 Our FL experiments utilized a variant of federated model averaging. At the start of each round of training, a copy of the global model was shared with each institution to initialize that institution’s local model. Each local model is then trained for a set number of epochs, and the model checkpoint from the epoch with the best validation performance, as measured by area under the receiver operating characteristic curve (AUROC), is chosen to be aggregated into the global model at the end of the round. The PyTorch framework was used for software implementation with data augmentation operations provided by the MONAI library and all experiments were performed on a Nvidia GTX 1080 Ti GPU.17
Comparison of clinical diagnosis of plus disease
We first used the output of the FL model to apply a VSS to each image in the dataset, using methods previously published.9,10,11,12,18 Simply, using the three class probability (P) output of this model (for classification of no plus, pre-plus, plus), each image was assigned a VSS using the following equation: [1× P(normal)] + [5 × P(pre-plus)] + [9 × P(plus)]. We used a FL approach to generate the VSS based on the clinical diagnosis of each image to compare objective differences in the clinical diagnosis of pre-plus and plus disease at each institution. For all clinical exams, we compared the VSS values assigned to the patients’ higher severity (“worse”) eyes with their corresponding clinical labels across institutions using one-way ANOVA. Post-hoc analysis was performed with Tukey-Kramer test to draw pairwise comparisons.
Comparison of inter-institutional disease severity
We then analyzed the distribution of disease at each institution by representing images from each eye exam with a VSS and compared mean vascular severity of all “worse” eyes at each institution (institutional VSS) using one-way ANOVA. Post-hoc analysis was performed with Tukey-Kramer test to draw pairwise comparisons. Simple linear regression was performed to explore the relationship between the most common demographic risk factors for ROP (BW and GA), and overall measured ROP severity using the institutional VSS.
Results
Patient demographics
A total of 867 patients and 1686 eyes across 7 institutions were represented by the 5245 images included in the dataset (Table 1). BW and GA varied significantly by institution. The mean (± SD) birth weight was 967g (±327g) (one-way ANOVA, p<0.001), and mean GA was 27.3 weeks (±2.4 weeks) (one-way ANOVA, p<0.01).
Table 1:
Dataset Demographics and Disease Severity Prevalence
| Site A | Site B | Site C | Site D | Site E | Site F | Site G | All Sites | P value | |
|---|---|---|---|---|---|---|---|---|---|
| Babies | 143 | 92 | 19 | 177 | 58 | 149 | 229 | 867 | N/A |
| Eyes | 281 | 175 | 35 | 343 | 109 | 297 | 446 | 1686 | N/A |
| Images | 911 | 328 | 61 | 727 | 248 | 1344 | 1626 | 5245 | N/A |
| Exams | 143 | 92 | 19 | 177 | 58 | 149 | 229 | 867 | N/A |
| BW (mean ± SD) | 937.2±321.2 | 1102.5±323.3 | 770.1±322.2 | 881.9±282.8 | 799.8±232.2 | 963.3±336.8 | 1058.5±334 | 967.1±327.3 | *<0.001 |
| GA (mean ± SD) | 27.1±2.3 | 28.3±2.0 | 26.1±2.8 | 26.8±2.2 | 25.9±2.1 | 27.4±2.3 | 27.9±2.4 | 27.3±2.4 | <0.001 |
| Institutional VSS (mean ± SD) | 1.75±1.19 | 1.27±0.14 | 1.74±1.19 | 1.86±1.36 | 2.38±1.55 | 1.73±1.01 | 1.82±1.35 | 1.78±1.23 | <0.001 |
| Prevalence Plus (RSD) | 13 (18.3%) | 0 (0%) | 2 (2.82%) | 14 (19.7%) | 13 (18.3%) | 10 (14.1%) | 19 (26.8%) | 71 | *>1.00 |
| Prevalence Plus (Clinical) | 13 (18.6%) | 0 (0%) | 1 (1.43%) | 10 (14.3%) | 10 (14.3%) | 11 (15.7%) | 25 (35.7%) | 70 | *>1.00 |
| Prevalence Pre-Plus (RSD) | 19 (14.1%) | 1 (0.74%) | 7 (5.2%) | 25 (18.5%) | 20 (14.8%) | 27 (20.0%) | 36 (26.7%) | 135 | ***<0.001 |
| Prevalence Pre-Plus (Clinical) | 17 (23.9%) | 2 (2.82%) | 0 (0%) | 15 (21.1%) | 6 (8.45%) | 1 (1.41%) | 30 (42.3%) | 71 | ***<0.001 |
Total number of babies, eyes and images represented in each site’s dataset. Average BW, GA and vascular severity score (± SD) are shown, with p value from one way ANOVA comparing variance between all sites for these measurements. Prevalence of RSD and Clinical plus and pre-plus disease diagnoses for the “worse” eye of each exam in the dataset are shown as a raw value, and as a percent of the total number of “worse eye” diagnoses. P values from two proportion Z test comparing prevalence of each severity class by RSD and Clinical grading are shown.
BW = birth weight, GA = gestational age, SD = standard deviation, VSS = vascular severity score, RSD = reference standard diagnosis,
One way ANOVA,
Two proportion Z Test comparing prevalence between Clinical and RSD Plus gradings,
Two proportion Z Test comparing prevalence between Clinical and RSD Pre-plus gradings
Comparison of clinical diagnoses and reference standard diagnosis between institutions
The overall proportions of clinical diagnoses between patients in the clinical and RSD-labeled datasets were significantly different (McNemar-Bowker test: p<0.001). The proportion of patients that developed plus disease was 70/867 (8.1%) by clinical diagnosis and 71/867 (8.2%) by RSD (Two proportion Z test, p > 1.00). The prevalence of pre-plus disease was significantly lower by clinical diagnosis 71/867 (8.2%) than by RSD 135/867 (15.6%) (Two proportion Z test, p < 0.001). Even though the overall prevalence of plus disease was the same by clinical diagnosis versus RSD, there were differences at the institutional-level. The difference between the proportion of eyes with a clinical diagnosis of plus, versus an RSD of plus ranged from 0% (Site B) to 8.9% (Site G). For pre-plus, the difference was even more notable, ranging from 2.08% (Site B) to 15.6% (Site G).
Comparison of clinical diagnosis of plus disease
Using the FL model described by Lu et al, we applied a VSS to each image in the dataset, and compared it to the categorical clinical diagnosis of plus disease at each institution.15 We explored mean VSS for each category between institutions (Figure 1), finding significant differences in diagnostic paradigms for no plus (One way ANOVA: p<0.001, F = 10.18), but not pre-plus or plus disease. During pairwise comparison of institutions, 9 / 21 (42.9%) significant differences were found for the diagnoses of no plus. Figure 2 shows an example of one eye whose clinical diagnoses did not match the corresponding RSD, and there was a disconnect between the clinical diagnosis and DL-derived VSS.
Figure 1: Distribution of vascular severity score by clinical diagnosis by clinical site.

Box and whisker plot illustrating median (central line), lower and upper quartiles (vertical box bounds) and range (vertical whiskers) of “worse” eye vascular severity scores (VSS) for all exams at each participating site for no plus (A), pre-plus (B) and plus (C) disease. Outliers are represented by scattered dots. Comparison of VSS distribution between institutions for each severity level revealed a significant difference in no plus grading (One way ANOVA: p<0.001, F = 10.18). During pairwise comparison of institutions, 9 / 21 (42.9%) significant differences were found for “no plus” diagnosis.
Figure 2: Variability in plus disease severity grading.

Representative fundus photo of disagreement between clinical diagnosis, reference standard diagnosis (RSD) and vascular severity score (VSS). This image was diagnosed as “no plus” by the clinician at the bedside (Site F), but had a RSD of “pre-plus”, and a VSS of 8.5.
Comparison of inter-institutional disease severity
Using the FL model described by Lu et al, we applied a VSS to each image in the dataset, and evaluated the overall population at each institution for objective differences in disease severity.15 We found the institutional VSS (the mean VSS for all eye exams in an institution’s dataset) to vary significantly by institution (One way ANOVA, p<0.001, F = 5.33), with post-hoc analysis revealing significant differences in 7/21 (33.3%) pairwise comparisons (Figure 3). We additionally explored the relationship between institutional VSS, and the mean BW and GA of that population. Simple linear regression revealed a significant, inverse relationship between the institutional VSS and GA (p=0.049, adjusted R2=0.49), but not GA (p=0.10, adjusted R2=0.34). (Figure 4).
Figure 3: Distribution of vascular severity scores per site.
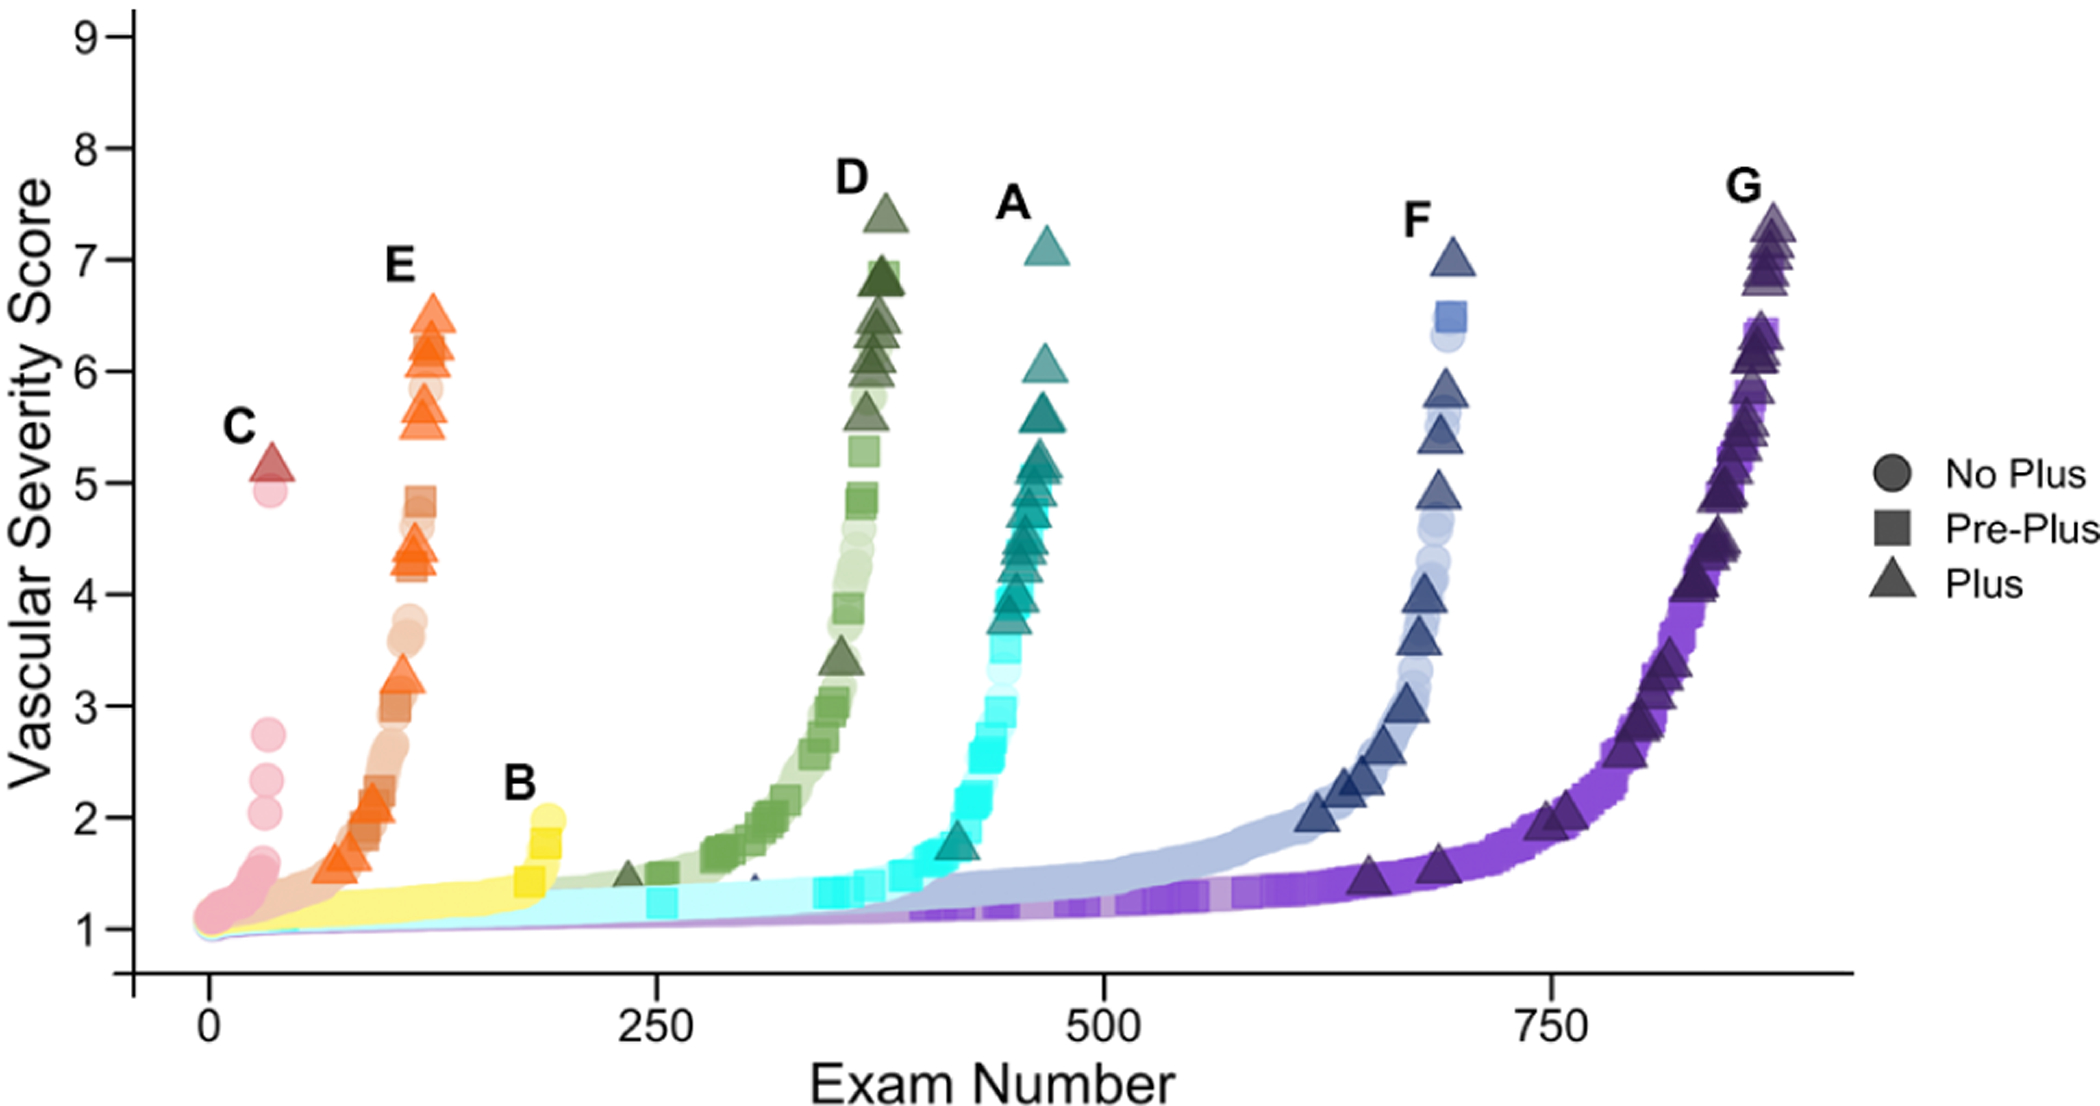
These plots illustrate the distribution of “worse” eye vascular severity scores (VSS) from each eye exam at each site. For each site, VSS scores are ranked from lowest to highest, and color coded for each of three clinical diagnoses of plus disease. The plots reveal differences in overall ROP severity (e.g. Site B had comparably few exams, and no plus cases), as well as differences in the clinical diagnosis of pre-plus and plus disease (e.g. Site F had very few cases of pre-plus diagnosed even though they had similar VSS distribution to other sites).
Figure 4: Relationship between institutional vascular severity score and mean population birth weight and gestational age.
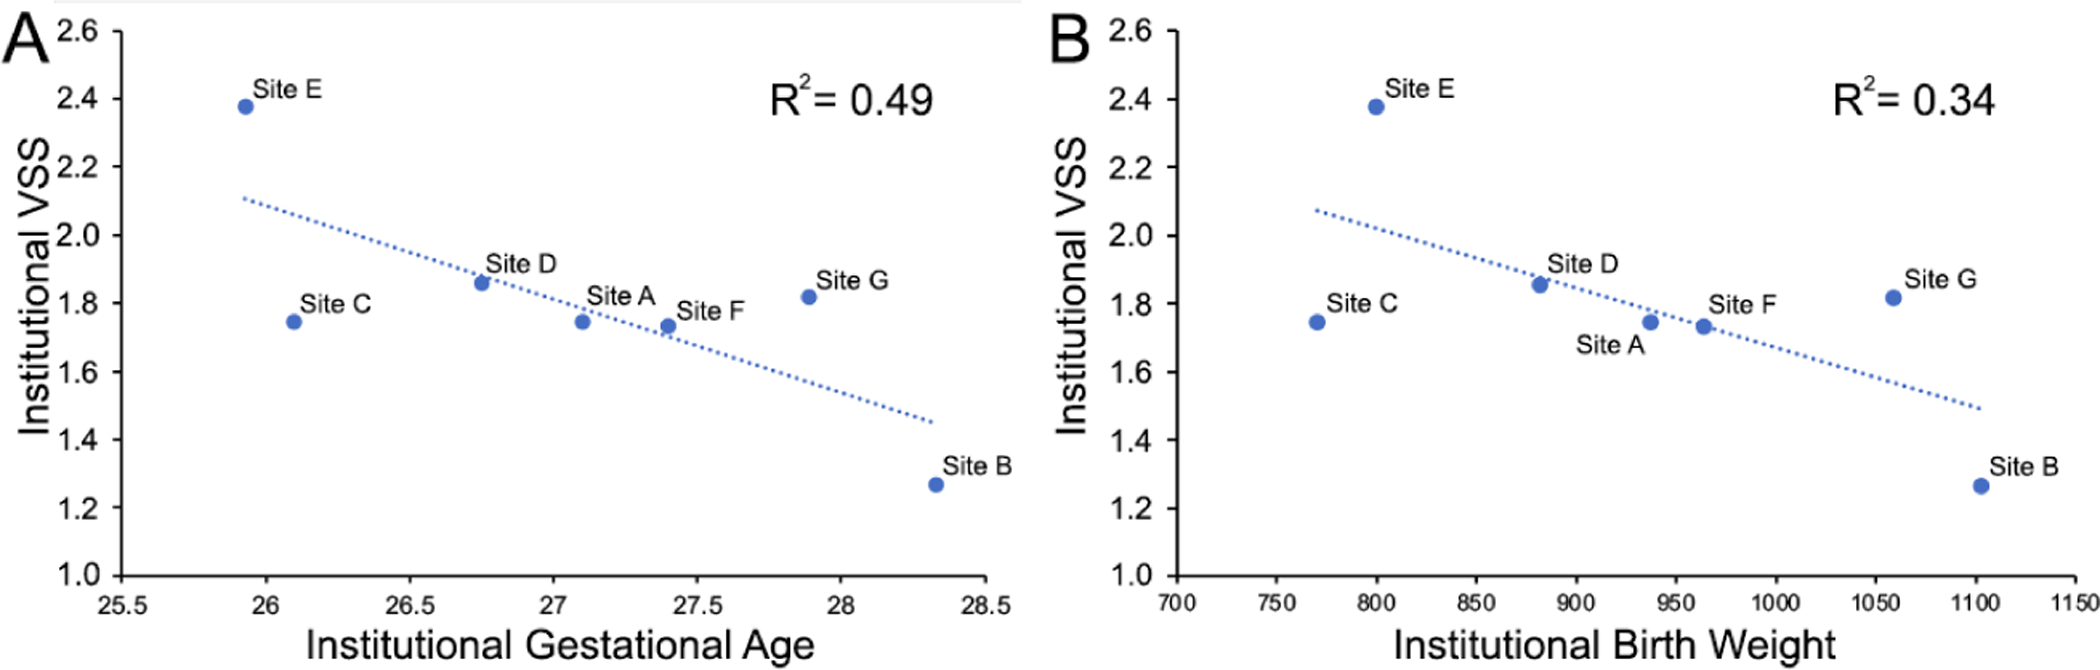
Simple linear regression revealed a significant, inverse relationship between the institutional vascular severity score (VSS) and (A) gestational age (p=0.049), adjusted R2=0.49), but not (B) birth weight (p=0.10, adjusted R2=0.34).
Discussion
When comparing clinical diagnoses between institutions, it is difficult to tease out whether observed differences stem from variability in clinical diagnoses, true differences in disease severity between institutions, or a combination of both. In this paper, we utilized an objective ROP vascular severity score, developed using federated learning, to compare clinical disease diagnoses and disease epidemiology between institutions. With the acknowledged limitation that this experiment was simulated FL using real multi-institutional data, in application this approach would not require sharing of data across institutions nor did it require consensus labeling of multiple ROP experts to work as well as previous models trained using a centralized, RSD-based process, a conclusion explored in Lu et al.15,16 Using the VSS developed on the clinical labels, we found differences between institutions in the level of objective severity corresponding to the clinical diagnoses of “no plus disease”, suggesting differing diagnostic paradigms across clinicians. Additionally, we found higher measured levels of ROP (by institutional VSS) at hospitals with lower GA populations, suggesting a potential application of FL for epidemiologic evaluations.
Differences in clinical diagnoses affect the ability to do clinical research, evaluate disease epidemiology, and allocate resources in health care systems. Without the use of photo-documentation and a rigorous RSD process, it would have been more challenging to determine whether differences in categorical labels between institutions in this study were due to underlying demographic risk and true differences in disease severity, or clinical diagnosis. When we compared disease severity prevalence by clinical diagnosis at the bedside to the RSD, the most apparent difference was in the diagnosis of pre-plus disease, suggesting that on average clinicians tend to not record pre-plus disease as a clinical diagnosis, despite a differing RSD consensus (some institutions varied more than others). It is notable that 16 years following the incorporation of pre-plus into disease classification, and the recognition that pre-plus and plus run a spectrum, there remains wide variability in the use of this label for the same level of disease across institutions. However, prior to the use of photo-documentation and the development of the VSS, it was not possible to convincingly demonstrate this. Specifically, it is not that “pre-plus” does not occur at these institutions (e.g. Site F), but that it is not diagnosed consistently across institutions. As these results demonstrate, one approach to evaluating these differences is to create centralized databases of images and have multiple graders evaluate each image in an RSD process. However, this process is time-consuming and limited by data sharing and privacy concerns, rendering the RSD process impractical in most multi-institutional collaborative situations.
In this paper, we evaluated another way to objectively assess differences in disease diagnosis using a VSS that was trained on multi-institutional data without that data being centralized, and without an RSD. Using this VSS, we found differences in the level of vascular severity diagnosed as no plus disease across academic institutions in the i-ROP cohort (Figure 1). These results are similar to Choi et al, which looked at individual examiners (rather than institutions) using the same dataset.13 However, because this VSS was created without centralized data collection, it may represent an approach to evaluate and standardize clinical diagnosis across institutions without data sharing and for other diseases that are based on subjective and qualitative diagnostic examinations. Remarkably, as Figure 1 demonstrates, this model was able to assign a vascular severity score to eyes despite the clinical label potentially being “wrong” relative to the RSD. FL provides a feasible means of iteratively learning from a larger quantity of training data across institutions, enabling models to separate out the signal from the noise, a form of weakly supervised learning. The result is that the FL model is able to learn when a clinical label may be at odds with the label that might be applied to the same image at another institution. Once the FL model is trained, it could be shared with each of the individual sites as an educational tool to benchmark and refine the diagnostic paradigms of each individual clinician with the goal of harmonizing diagnosis.
We also used this FL-derived severity score to evaluate the level of disease at each institution. Previously, we used a similar measurement of “population-level” disease severity to compare level of ROP across NICUs in India, and demonstrated that NICUs that had access to oxygen sensors and blenders, and therefore could better optimize primary prevention, had lower calculated ROP severity.19 In the US, there may be fewer outliers when it comes to primary prevention, but the use of a similar metric could help identify temporal and geographic variation in disease severity.20 Geographically, it would also allow hospitals to compare their rates of ROP severity to their counterparts, stratified by BW and GA, and provide an objective measurement of disease severity as the healthcare system may transition more towards value-based care. One of the challenges of the value-based care model is that there may be incentives to increase the level of complexity/diagnostic severity which is hard to audit without an objective measure of disease severity. Temporally, this measure could evaluate the population-level dynamics of disease severity, either from evolving diagnostic paradigms, or environmental factors or changes in care practices, such as from a large-scale clinical trial.21
A key limitation of our study lies in the fact that each institutions’ datasets are not entirely population-based. Participating sites’ enrollment protocols varied, introducing a possibility of population bias in their cohorts. While some included most or all eligible patients regardless of disease severity, others may have only included patients exceeding certain tiers of severity or complexity, or according to availability of coordinators. Thus, this study functions more as a proof of concept, than a reflection of the participating institutions’ true epidemiologic differences. Nonetheless, the fact that there was a significant relationship between the demographics of each cohort and the overall ROP severity is remarkable. A second limitation is that this “problem” (the development of a VSS) was known to be solvable based on prior work and it may be that the FL approach does not work for other image-based classification problems. Specifically, the VSS assumes that disease classification is ordinal. However, if the disease classes of interest do not fall along a single axis of severity, an alternative approach may be needed.
In this paper we demonstrated that a vascular severity score for ROP, developed using a federated learning approach on multi-institutional data with point-of-care single-clinician labels, has promise for objectively assessing differences in clinician diagnostic paradigms and disease severity across institutions. In comparison to a centrally-hosted model trained on RSD labels, this model training approach does not require any central process or consensus of experts, making it much more feasible to implement. Importantly, we demonstrate the utility of this approach as a proof-of-concept within ophthalmology, with the hope of inspiring further application for other ophthalmic diseases.
Financial Support:
This work was supported by grants R01 EY19474, R01 EY031331, R21 EY031883, and P30 EY10572 from the National Institutes of Health (Bethesda, MD), and by unrestricted departmental funding and a Career Development Award (JPC) from Research to Prevent Blindness (New York, NY). The sponsors or funding organizations had no role in the design or conduct of this research.
Conflicts of Interest:
Drs. Campbell, Chan, and Kalpathy-Cramer receive research support from Genentech (San Francisco, CA). Dr. Chiang previously received research support from Genentech.
The i-ROP DL system has been licensed to Boston AI Lab (Boston, MA) by Oregon Health & Science University, Massachusetts General Hospital, Northeastern University, and the University of Illinois, Chicago, which may result in royalties to Drs. Chan, Campbell, Brown, and Kalpathy-Cramer in the future.
Dr. Campbell was a consultant to Boston AI Lab (Boston, MA).
Dr. Chan is on the Scientific Advisory Board for Phoenix Technology Group (Pleasanton, CA), a consultant for Alcon (Ft Worth, TX).
Dr. Chiang was previously a consultant for Novartis (Basel, Switzerland), and was previously an equity owner of InTeleretina, LLC (Honolulu, HI).
Drs. Chan and Campbell are equity owners of Siloam Vision.
Members of the i-ROP research consortium:
Oregon Health & Science University (Portland, OR): Michael F. Chiang, MD, Susan Ostmo, MS, Sang Jin Kim, MD, PhD, Kemal Sonmez, PhD, J. Peter Campbell, MD, MPH, Robert Schelonka, MD, Aaron Coyner, PhD. University of Illinois at Chicago (Chicago, IL): RV Paul Chan, MD, Karyn Jonas, RN, Bhavana Kolli, MHA. Columbia University (New York, NY): Jason Horowitz, MD, Osode Coki, RN, Cheryl-Ann Eccles, RN, Leora Sarna, RN. Weill Cornell Medical College (New York, NY): Anton Orlin, MD. Bascom Palmer Eye Institute (Miami, FL): Audina Berrocal, MD, Catherin Negron, BA. William Beaumont Hospital (Royal Oak, MI): Kimberly Denser, MD, Kristi Cumming, RN, Tammy Osentoski, RN, Tammy Check, RN, Mary Zajechowski, RN. Children’s Hospital Los Angeles (Los Angeles, CA): Thomas Lee, MD, Aaron Nagiel, MD, Evan Kruger, BA, Kathryn McGovern, MPH, Dilshad Contractor, Margaret Havunjian. Cedars Sinai Hospital (Los Angeles, CA): Charles Simmons, MD, Raghu Murthy, MD, Sharon Galvis, NNP. LA Biomedical Research Institute (Los Angeles, CA): Jerome Rotter, MD, Ida Chen, PhD, Xiaohui Li, MD, Kent Taylor, PhD, Kaye Roll, RN. University of Utah (Salt Lake City, UT): Mary Elizabeth Hartnett, MD, Leah Owen, MD. Stanford University (Palo Alto, CA): Darius Moshfeghi, MD, Mariana Nunez, B.S., Zac Wennber-Smith, B.S.. Massachusetts General Hospital (Boston, MA): Jayashree Kalpathy-Cramer, PhD. Northeastern University (Boston, MA): Deniz Erdogmus, PhD, Stratis Ioannidis, PhD. Asociacion para Evitar la Ceguera en Mexico (APEC) (Mexico City): Maria Ana Martinez-Castellanos, MD, Samantha Salinas-Longoria, MD, Rafael Romero, MD, Andrea Arriola, MD, Francisco Olguin-Manriquez, MD, Miroslava Meraz-Gutierrez, MD, Carlos M. Dulanto-Reinoso, MD, Cristina Montero-Mendoza, MD.
Footnotes
Meeting Presentation: This work is not under consideration for presentation, and has not previously been presented at any meeting.
References
- 1.Chiang MF, Quinn GE, Fielder AR, et al. International Classification of Retinopathy of Prematurity, Third Edition. Ophthalmology. 2021;128:e51–e68. [DOI] [PMC free article] [PubMed] [Google Scholar]
- 2.Reynolds JD, Dobson V, Quinn GE, et al. Evidence-based screening criteria for retinopathy of prematurity: natural history data from the CRYO-ROP and LIGHT-ROP studies. Arch Ophthalmol. 2002;120:1470–1476. [DOI] [PubMed] [Google Scholar]
- 3.Campbell JP, Ryan MC, Lore E, et al. Diagnostic Discrepancies in Retinopathy of Prematurity Classification. Ophthalmology. 2016;123:1795–1801. [DOI] [PMC free article] [PubMed] [Google Scholar]
- 4.Slidsborg C, Forman JL, Fielder AR, et al. Experts do not agree when to treat retinopathy of prematurity based on plus disease. Br J Ophthalmol. 2012;96:549–553. [DOI] [PubMed] [Google Scholar]
- 5.Quinn GE, Ells A, Capone A Jr, et al. Analysis of Discrepancy Between Diagnostic Clinical Examination Findings and Corresponding Evaluation of Digital Images in the Telemedicine Approaches to Evaluating Acute-Phase Retinopathy of Prematurity Study. JAMA Ophthalmol. 2016;134:1263–1270. [DOI] [PMC free article] [PubMed] [Google Scholar]
- 6.Chiang MF, Jiang L, Gelman R, et al. Interexpert agreement of plus disease diagnosis in retinopathy of prematurity. Arch Ophthalmol. 2007;125:875–880. [DOI] [PubMed] [Google Scholar]
- 7.Richter GM, Williams SL, Starren J, et al. Telemedicine for retinopathy of prematurity diagnosis: evaluation and challenges. Surv Ophthalmol. 2009;54:671–685. [DOI] [PMC free article] [PubMed] [Google Scholar]
- 8.Al-Khaled T, Valikodath NG, Patel SN, et al. Addressing the Third Epidemic of Retinopathy of Prematurity Through Telemedicine and Technology: A Systematic Review. J Pediatr Ophthalmol Strabismus. 2021;58:261–269. [DOI] [PMC free article] [PubMed] [Google Scholar]
- 9.Taylor S, Brown JM, Gupta K, et al. Monitoring Disease Progression With a Quantitative Severity Scale for Retinopathy of Prematurity Using Deep Learning. JAMA Ophthalmol. 2019. [DOI] [PMC free article] [PubMed] [Google Scholar]
- 10.Bellsmith KN, Brown J, Kim SJ, et al. Aggressive Posterior Retinopathy of Prematurity: Clinical and Quantitative Imaging Features in a Large North American Cohort. Ophthalmology. 2020;127:1105–1112. [DOI] [PMC free article] [PubMed] [Google Scholar]
- 11.Gupta K, Campbell JP, Taylor S, et al. A Quantitative Severity Scale for Retinopathy of Prematurity Using Deep Learning to Monitor Disease Regression After Treatment. JAMA Ophthalmol. 2019. [DOI] [PMC free article] [PubMed] [Google Scholar]
- 12.Coyner A, Chen JS, Singh P, Schelonka RL, Jordan BK, McEvoy CT, Anderson JE, Chan RVP, Sonmez K, Erdogmus D, Chiang MF, Kalpathy-Cramer J, Campbell JP. Single-exam Risk Prediction of Severe Retinopathy of Prematurity. Pediatrics (In press). [DOI] [PMC free article] [PubMed] [Google Scholar]
- 13.Choi RY, Brown JM, Kalpathy-Cramer J, et al. Variability in Plus Disease Identified Using a Deep Learning-Based Retinopathy of Prematurity Severity Scale. Ophthalmol Retina. 2020;4:1016–1021. [DOI] [PMC free article] [PubMed] [Google Scholar]
- 14.Ryan MC, Ostmo S, Jonas K, et al. Development and Evaluation of Reference Standards for Image-based Telemedicine Diagnosis and Clinical Research Studies in Ophthalmology. AMIA Annu Symp Proc. 2014;2014:1902–1910. [PMC free article] [PubMed] [Google Scholar]
- 15.Lu C, Hanif AM, Singh P, Chang K, Coyner AS, Brown JM, Ostmo S, Chan RVP, Rubin D, Campbell JP, Kalpathy-Cramer J. Federated learning for multi-center collaboration in ophthalmology: improving classification performance in retinopathy of prematurity. Ophthalmology Science (In review). [DOI] [PMC free article] [PubMed] [Google Scholar]
- 16.Brown JM, Campbell JP, Beers A, et al. Automated Diagnosis of Plus Disease in Retinopathy of Prematurity Using Deep Convolutional Neural Networks. JAMA Ophthalmol. 2018;136:803–810. [DOI] [PMC free article] [PubMed] [Google Scholar]
- 17.Project MONAI — MONAI 0.7.0 Documentation. https://docs.monai.io/en/latest/; Accessed 11.10.21.
- 18.Redd TK, Campbell JP, Brown JM, et al. Evaluation of a deep learning image assessment system for detecting severe retinopathy of prematurity. Br J Ophthalmol. 2019;103:580–584. [DOI] [PMC free article] [PubMed] [Google Scholar]
- 19.Campbell JP, Kim SJ, Brown JM, et al. Evaluation of a Deep Learning-Derived Quantitative Retinopathy of Prematurity Severity Scale. Ophthalmology. 2021;128:1070–1076. [DOI] [PMC free article] [PubMed] [Google Scholar]
- 20.Hartnett ME, Lane RH. Effects of oxygen on the development and severity of retinopathy of prematurity. J AAPOS. 2013;17:229–234. [DOI] [PMC free article] [PubMed] [Google Scholar]
- 21.Moleta C, Campbell JP, Kalpathy-Cramer J, et al. Plus Disease in Retinopathy of Prematurity: Diagnostic Trends in 2016 Versus 2007. Am J Ophthalmol. 2017;176:70–76. [DOI] [PMC free article] [PubMed] [Google Scholar]