

Summary
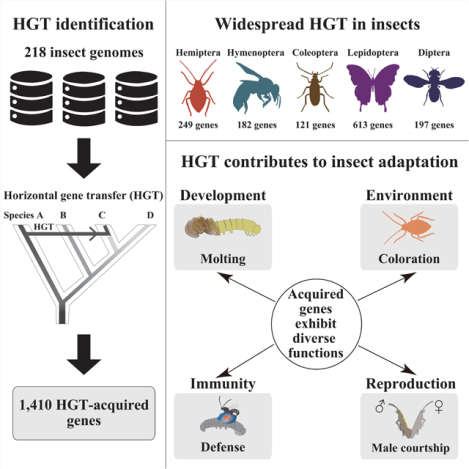
Horizontal gene transfer (HGT) is an important evolutionary force shaping prokaryotic and eukaryotic genomes. HGT-acquired genes have been sporadically reported in insects, a lineage containing >50% of animals. We systematically examined HGT in 218 high-quality genomes of diverse insects and found that they acquired 1,410 genes exhibiting diverse, including many not previously reported, functions via 741 distinct transfers from non-metazoan donors. Lepidopterans had the highest average number of HGT-acquired genes. HGT-acquired genes containing introns exhibited substantially higher expression levels than genes lacking introns, suggesting that intron gains were likely involved in HGT adaptation. Lastly, we used the CRISPR-Cas9 system to edit the prevalent unreported gene LOC105383139, which was transferred into the last common ancestor of moths and butterflies. In diamondback moths, males lacking LOC105383139 courted females significantly less. We conclude that HGT has been a major contributor to insect adaptation.
Keywords: HGT, comparative genomics, symbionts, intron gain, adaptive evolution, male courtship behavior, biodiversity
Graphical Abstract
In brief
A comprehensive resource of horizontal gene transfer (HGT) events in 218 insects acquired from non-metazoan sources provides insight into the adaptation of HGTs in insect genomes with a discovery of a functional role of the gene LOC105383139 in male courtship behavior in lepidopterans.
Introduction
Insects originated in the Early Ordovician (~479 million years ago) (Misof et al., 2014) and contain over 50% of all described living animals on Earth (Stork, 2018). This ancient lineage exhibits remarkable diversity including, but not limited to, development, behavior, social organization, and ecology (Smith et al., 2008; Stork, 2018). Some studies have argued that the symbionts of host insects are important contributors to insect diversification (e.g., Archibald, 2015; Blondel et al., 2020; Bublitz et al., 2019; Degnan, 2014; Eleftherianos et al., 2013; Engel and Moran, 2013; Hotopp et al., 2007; Husnik et al., 2013; Paniagua Voirol et al., 2018; Perreau and Moran, 2022). For example, at least 20% of insect species harbor Wolbachia bacterial endosymbionts, whose genes have been found to be horizontally transmitted into host insect genomes (Boto, 2014). Drosophila ananassae, for instance, has acquired nearly the entire genome of Wolbachia pipientis via horizontal gene transfer (HGT) (Hotopp et al., 2007).
In addition to pieces of symbiont genomes introduced into insects via HGT, some studies have reported the transfer of a single or few genes from fungi, bacteria, plants, and viruses (e.g., Boto, 2014; Husnik and McCutcheon, 2018; Irwin et al., 2022; Perreau and Moran, 2022). The functions of these transferred genes appear ecologically important; for example, carotenoid biosynthesis genes transferred from fungi to aphids contribute to aphid body coloration (Moran and Jarvik, 2010), genes that neutralize phenolic glucosides acquired by whiteflies from plants contribute to whitefly detoxification capabilities (Xia et al., 2021), and a parasitoid killing factor gene transferred from a virus to lepidopterans contributes to lepidopteran defense (Gasmi et al., 2021).
Given the ecological importance of the few known examples of insect HGT and the enormous magnitude of insect diversity, we undertook a systematic investigation of HGT-acquired genes in insect genomes, including their functions and contributions to insect adaptation. Using a robust and conservative phylogeny-based approach, we systematically identified and characterized horizontally acquired genes in the high-quality genomes of 218 insects, representing 11 / 19 species-rich orders (i.e., orders with >1,000 described species) (Stork, 2018). Then, we asked three questions: (i) What is the distribution of horizontally acquired genes across major insect groups? (ii) What factors contribute to the adaptation of HGTs in insect genomes? (iii) What are the biological functions of HGTs in insects?
Results
Numerous horizontal gene transfers into insects
To systematically identify putative HGT-acquired genes in insects, we downloaded 218 publicly available genomes from GenBank and Lepbase (Challis et al., 2016) (see METHODS). The genomes of these 218 insects represent 11 of 19 species-rich orders (i.e., orders with >1,000 described species) (Stork, 2018) (Table S1), including Ephemeroptera (2), Orthoptera (1), Blattodea (4), Thysanoptera (2), Hemiptera (19), Phthiraptera (1), Hymenoptera (68), Coleoptera (19), Lepidoptera (39), Siphonaptera (1), and Diptera (62). We used a robust and conservative phylogeny-based approach to examine the protein sequence of each of 2,806,851 genes present in the contigs with length of ≥ 100 kb from 218 insect genomes for evidence of HGT (e.g., Shen et al., 2018; Wisecaver et al., 2016) (Figure S1). We found a total of 1,410 genes in 192 insect genomes that were likely acquired via 741 distinct events from non-metazoan sources (Figures 1 and S2 and Table S2), including 1,115 (79.0%) genes from Bacteria, 194 (13.8%) genes from Fungi, 43 (3.0%) genes from plants, 36 (2.6%) genes from viruses, and 22 (1.6%) genes from other lineages.
Figure 1. Distribution of the 1,410 putative HGT-acquired genes on the maximum likelihood phylogeny of 218 insects.
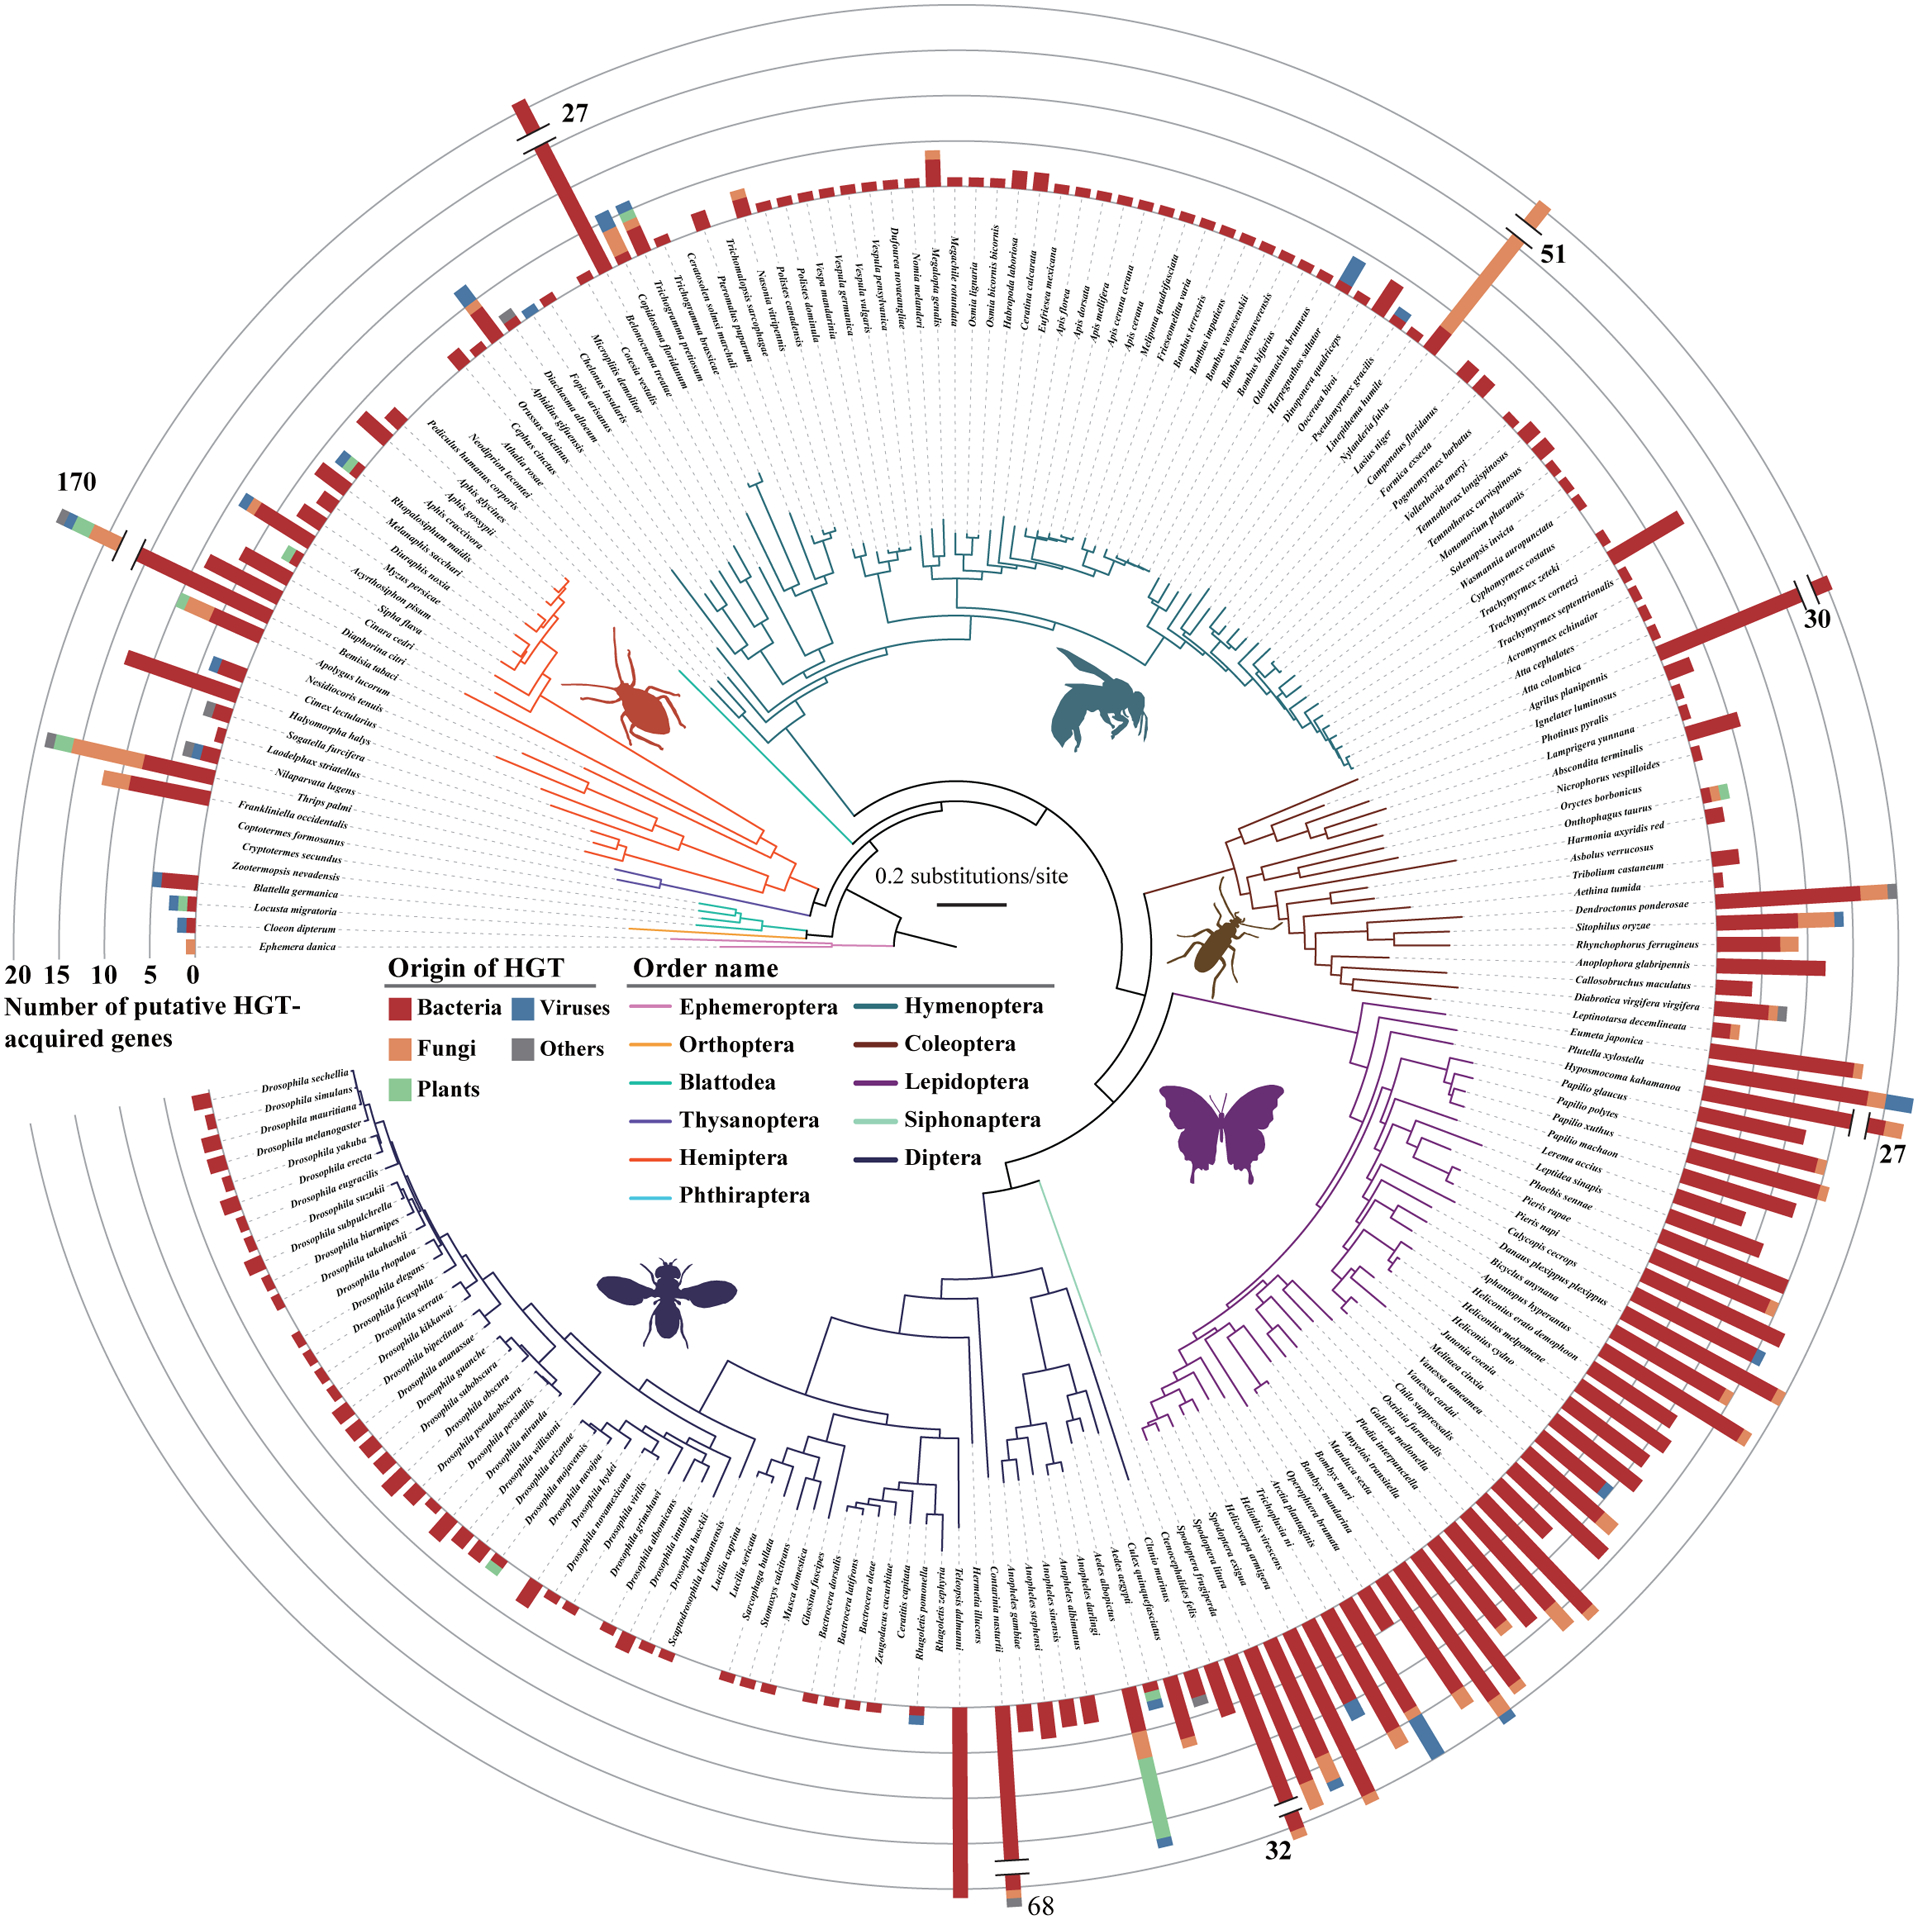
We sampled 218 insects representing 11 / 19 species-rich orders (i.e., orders with >1,000 described species) (Stork, 2018). The phylogeny was a concatenated ML tree inferred from analysis of 1,367 single-copy BUSCO genes. These 1,410 putative HGT-acquired genes were likely acquired through 741 distinct HGT events, of which 588 were species-specific and the other 153 were present in two or more species. The stacked bars indicate the number of HGT-acquired genes from the different HGT donor resources (red: Bacteria, orange: Fungi, green: Plants, blue: Viruses, gray: Others). Images representing taxa were taken from PhyloPic (http://phylopic.org). See also Figures S1 and S2 and Tables S1 and S2.
To gauge the reliability of the inference of these 1,410 HGT-acquired genes, we first used Conterminator v1.c74b5 (Steinegger and Salzberg, 2020) to detect contamination and found that none of 1,410 HGT-acquired genes was identified as a potential contaminant. Second, we examined the recovery rate of 54 randomly selected genes from 16 insects representing 8 / 11 orders, using PCR and Sanger sequencing (see METHODS). Our results show that the rate of PCR success varied between 33.3% and 100% across 16 tested insects, with an average value of 83.3% (45 / 54 genes) (Figure 2A). Third, we compared our list of 1,410 HGT-acquired genes with a list of 193 previously published genes and found that 164 / 193 (85%) HGT-acquired genes in previous studies were also found in our study. Fourth, we examined the distribution of sequence lengths of the 928 genomic contigs that contain the 1,410 HGT-acquired genes alongside the distribution of sequence lengths of the 89,481 genomic contigs that do not contain HGT-acquired genes. We found that contigs containing the HGT-acquired genes were typically longer than contigs lacking them (Figure 2B). Fifth, we examined the distribution of proportions of 1,410 HGT-acquired genes that reside in the 928 contigs and found that none of the 928 contigs contained HGT-acquired genes in frequencies greater than 5% (Figure 2C). Finally, we examined the protein sequence similarity between the HGT-acquired genes in the insect recipients and their closest homologs in non-metazoan donors for all 1,410 HGT-acquired genes and found that similarity values ranged between 12% and 89%, with an average value of 39% (Figure 2D). Collectively, these results suggest that the list of 1,410 HGT-acquired genes present in the contigs with length of ≥ 100 kb is reliable.
Figure 2. Robustness of HGT inference.
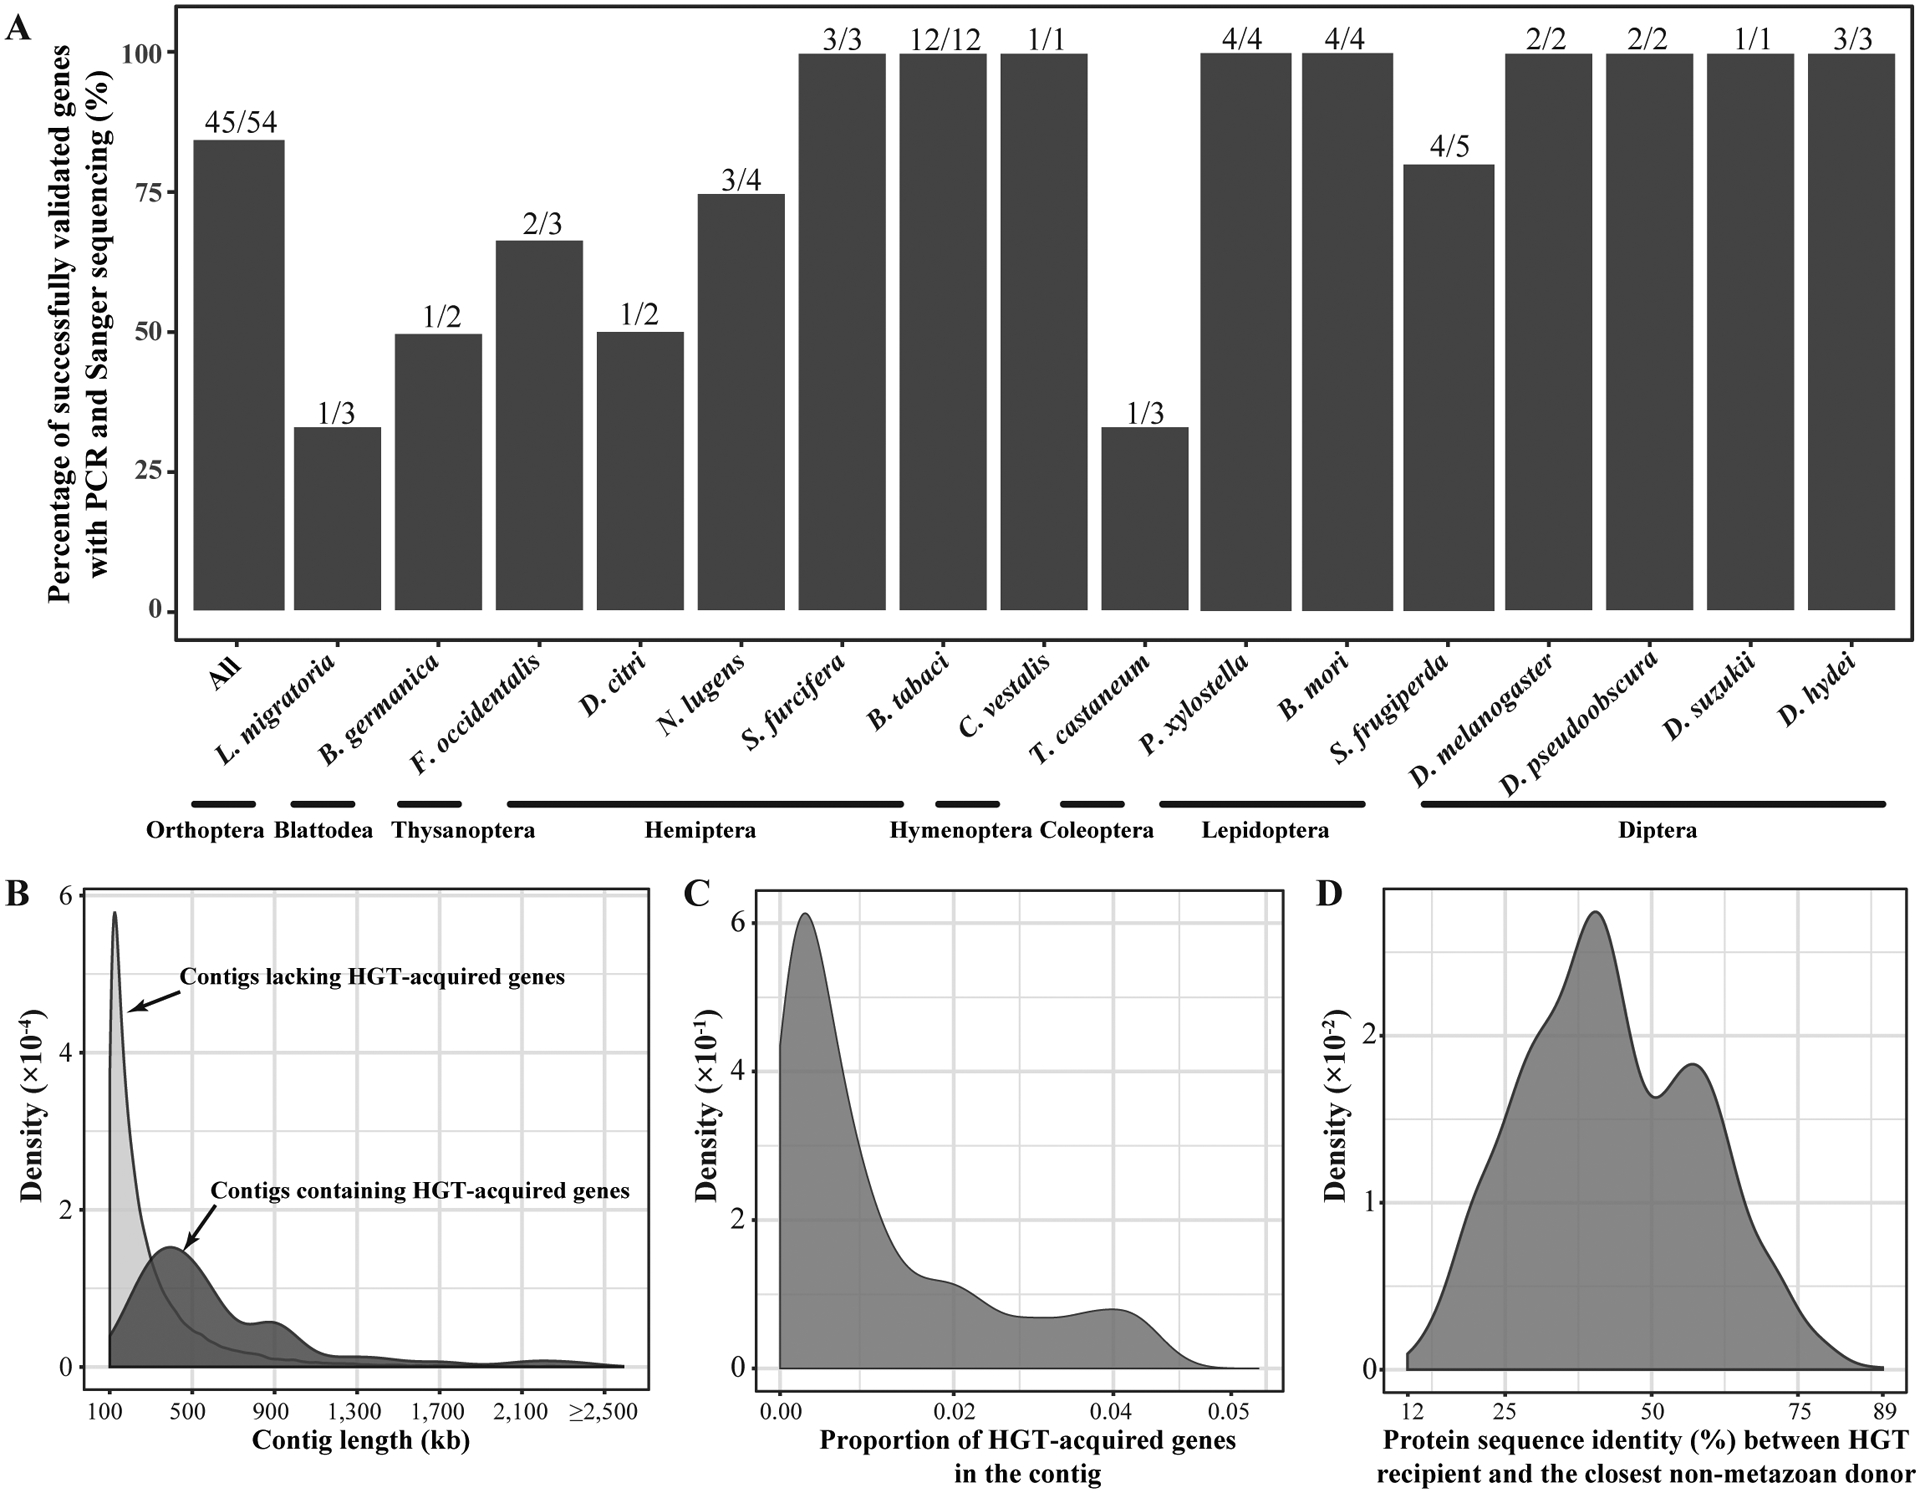
A) Validation of HGT-acquired genes using PCR and Sanger sequencing experiments. Since it is challenging to validate all 1,410 HGT-acquired genes in 218 insects due to limitation of insect genomic DNA, we examined 54 HGT-acquired genes in 16 insect species representing 8 of 11 orders. Note that the uneven sampling of insects for this analysis might not fully reflect the accuracy of HGT inference across orders. For each of 54 HGT-acquired genes, two separate PCR reactions followed by Sanger sequencing of the amplicons were used to validate the presence of the HGT-acquired gene in the insect genome (see details in Methods). B) Distributions of sequence lengths of genomic contigs with and without HGT-acquired genes. The darker distribution is that of the sequence lengths of the 928 contigs that contain the 1,410 HGT-acquired genes, and the lighter distribution is that of the sequence lengths of the 89,481 contigs that do not contain HGT-acquired genes. C) Distribution of proportions of HGT-acquired genes in each of the 928 contigs that harbor the 1,410 inferred HGT-acquired genes. D) Distribution of the protein sequence similarity between the sequence in the insect recipient genome and its closest hit in a non-metazoan donor genome for all 1,410 HGT-acquired genes.
When evaluating the 1,410 HGT-acquired genes by the number of genomes included from each order, we found that the order Lepidoptera acquired by far the highest average number of HGT-acquired genes (16 genes per species), followed by the orders Hemiptera (13 genes per species), Coleoptera (6 genes per species), Hymenoptera (3 genes per species), and Diptera (2 genes per species) (Table S2). From the 741 distinct HGT events, 588 were species-specific, whereas the remaining 153 involved two or more species (Figure S2). Of the 153 distinct HGT events that involved two or more species, 63, 20, 15, 12, and 8 were found in the five largest orders Lepidoptera, Diptera, Hymenoptera, Coleoptera, and Hemiptera, respectively (Figure S2). When examining genome size, gene content, species divergence time, and genome completeness, we found that the number of HGT-acquired genes exhibited low levels of correlations with genome size, gene content, species divergence time, and genome completeness.
By examining putative donor organisms for 1,410 HGT-acquired genes using a combination of BLAST and phylogenetics, we found that the 1,410 HGT-acquired genes were likely acquired from 670 putative donor species (Bacteria: 533 / 670 (80%), Fungi: 74 / 670 (11%); plants: 25 / 670 (4%), viruses: 29 / 670 (4%), others: 9 / 670 (1%)) (Figure 3A). Overall, in addition to the common endosymbiotic bacterial genus Wolbachia (3%), the bacterial genera Serratia (3%), Bacillus (2%), Pseudomonas (2%), and Paenibacillus (2%) were also prevalent donor organisms (Figure 3A). In addition, some HGT donors were order-specific. For example, the fungal genera Exophiala and Encephalitozoon were Hemiptera-specific and Hymenoptera-specific donors, respectively; The bacterial genera Streptomyces, Listeria, and Erwinia were Coleoptera-specific, Lepidoptera-specific, and Diptera-specific donors, respectively.
Figure 3. Symbionts of host insects were likely to be involved in the transitions of foreign genes into insect genomes.
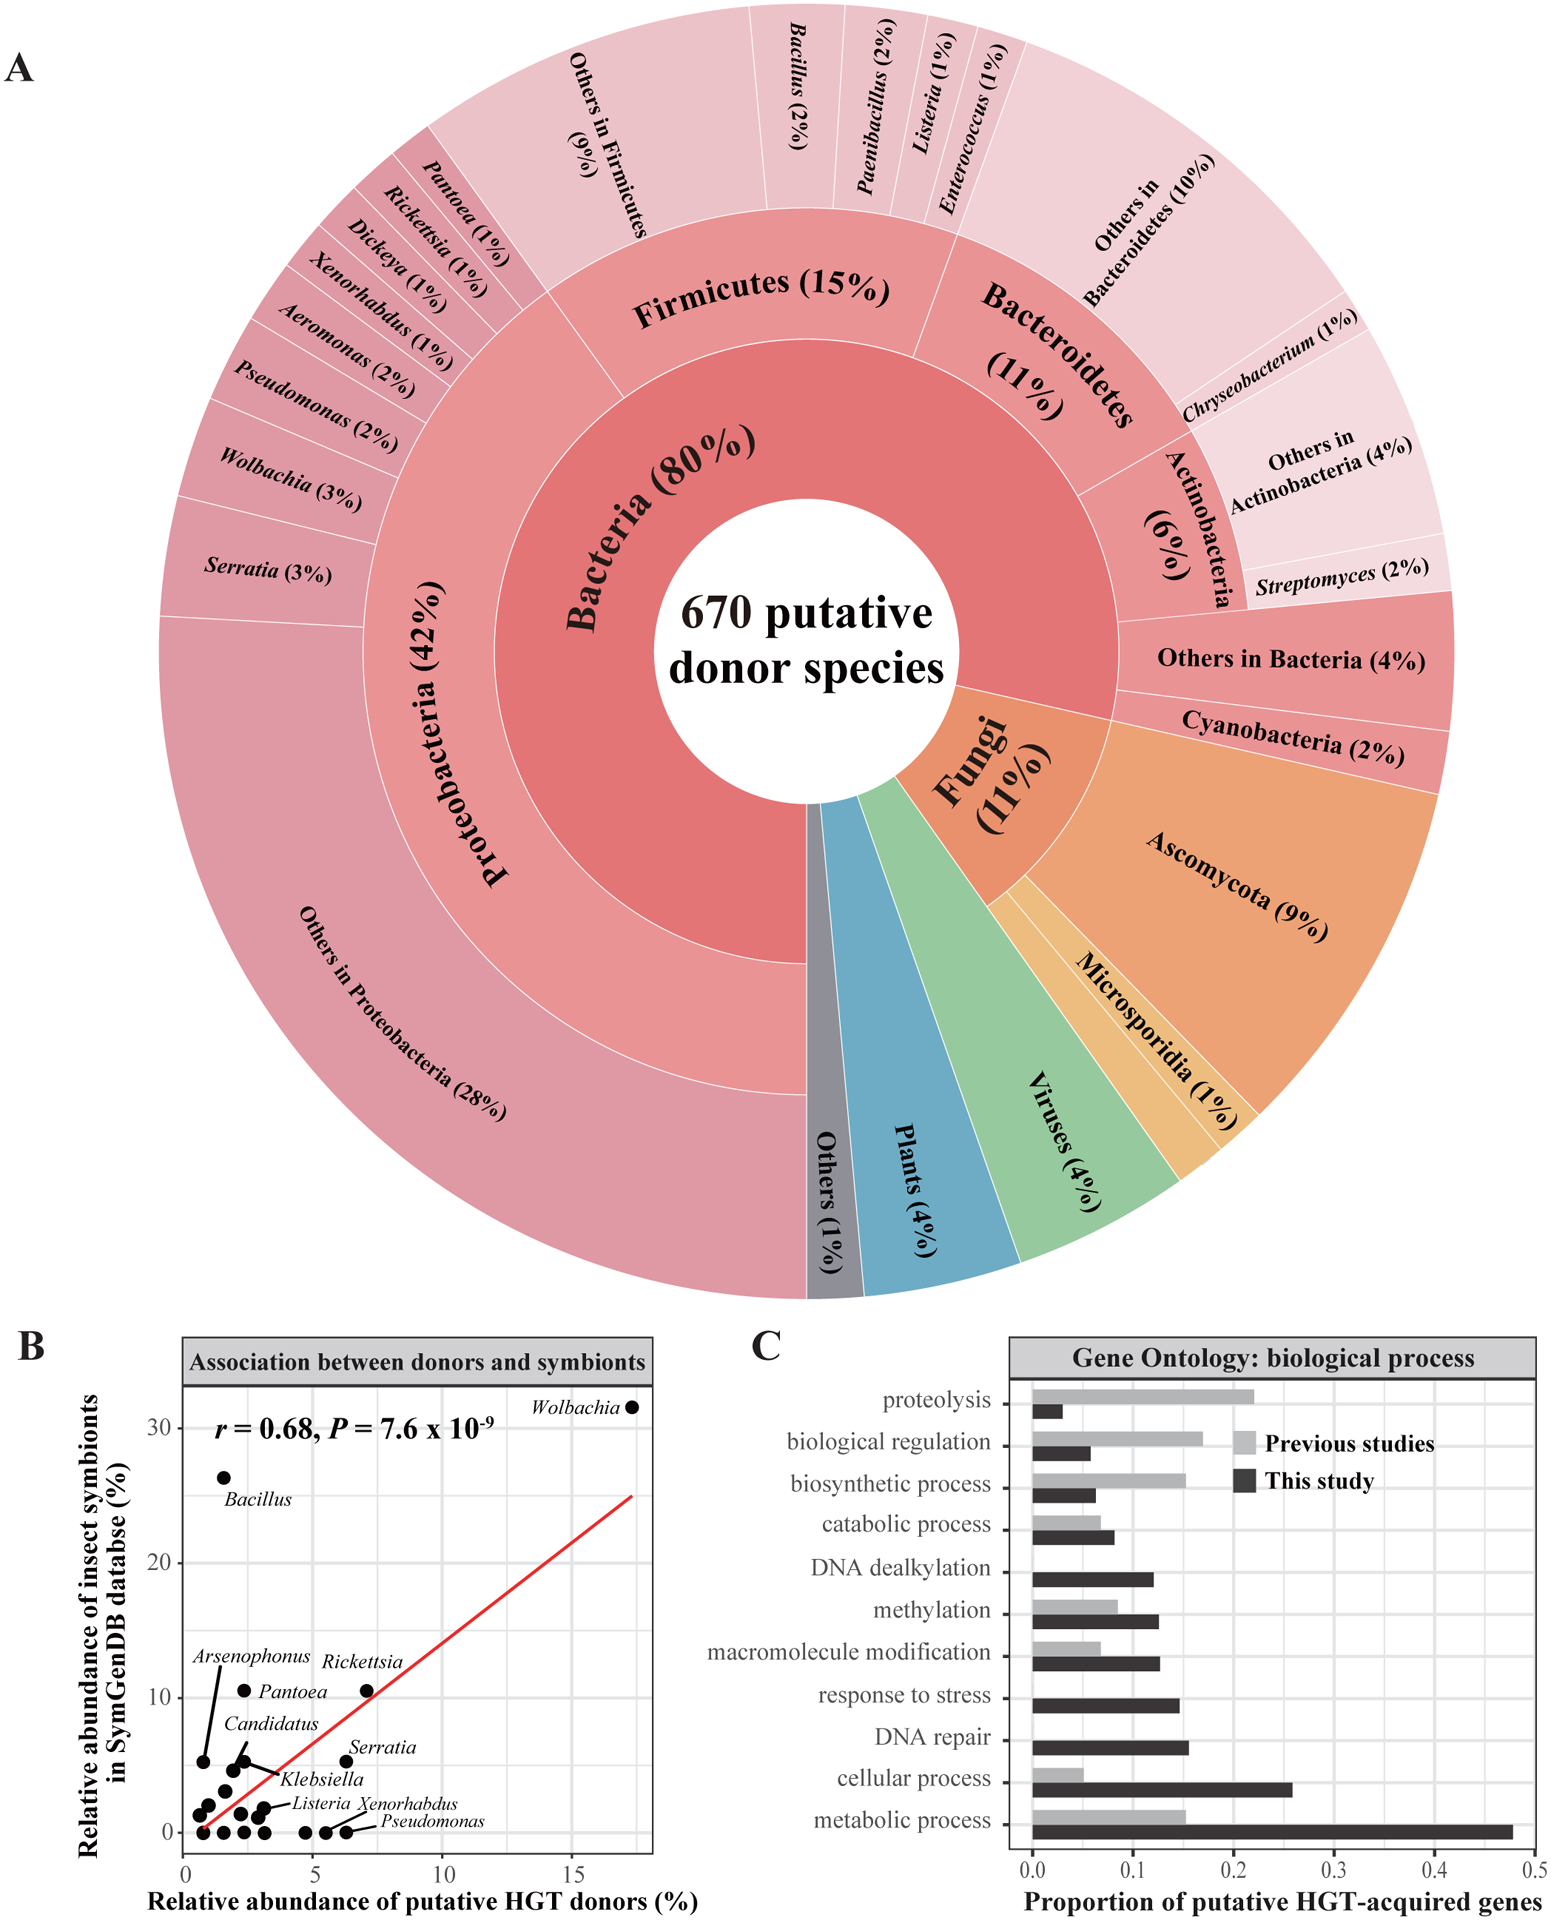
These 1,410 foreign genes were likely horizontally acquired through 741 distinct HGT events from 670 putative HGT donor species. A) The distribution of 670 putative donor species. B) The association in abundance between HGT donor species and known insect symbionts. We calculated the relative abundance of each HGT donor genus as well as the relative abundance of each known symbiont genus in 20 insects (from 7 / 11 orders) in SymGenDB. Pearson’s correlation coefficient was used to test whether these two variables are significantly correlated. C) Gene ontology (GO) term analysis of 1,410 HGT-acquired genes in our study and of 193 HGT-acquired genes reported in previous studies in terms of biological processes.
Since some studies have argued that the genes in symbionts of the host insects have been horizontally transmitted into the host insect genomes (e.g., Archibald, 2015; Blondel et al., 2020; Perreau and Moran, 2022), we investigated the association between putative HGT donor organisms and known insect symbionts. Specifically, we calculated the relative abundance of each HGT donor genus as well as the relative abundance of each known symbiont genus in 20 insects (from 7 / 11 orders) in SymGenDB (Reyes-Prieto et al., 2015). We found that the correlation in relative abundance between HGT donor genera and known insect symbiont genera was significant (r = 0.68, P-value = 7.6 × 10⁻⁹) (Figure 3B). This strong correlation still held when we examined the association between all putative HGT donor species and all insect symbiont species, without considering one-to-one corresponding relationships between HGT recipient insects and host insects of the symbionts. These results raise the possibility that symbionts of host insects – especially symbionts in the Rickettsia and Wolbachia lineages – might be involved in transitions of foreign genes into insect genomes.
Gene ontology (GO) analysis of the 1,410 HGT-acquired genes shows that most were associated with metabolism- and cellular-related terms (Figure 3C). In addition to previously reported functions (e.g., detoxification, body coloration, defense) (Gasmi et al., 2021; Moran and Jarvik, 2010; Xia et al., 2021), we found diverse functions including but not limited to immunity, courtship behavior, metabolism, nutrition, adaptation to extreme environments, growth, and development. We found similar functional distributions of the GO categories (BP: biological process, CC: cellular component, MF: molecular function) in the five largest orders in our study.
Origin of introns in HGT-acquired genes and adaptation of HGT in insects
From the 1,410 HGT-acquired genes, 849 contain 1,534 introns ≥ 100 bp in length, while the remaining 561 lack introns (Figure 4A). Comparisons of introns between the genes of and their HGT insect recipients showed that all 1,534 introns present in the 849 genes were gained after these genes were inserted into insect genomes. Specifically, from 1,410 HGT-acquired genes: 519 did not contain any introns in HGT donor organisms and recipient insects (i.e., no intron gain or loss); 42 contained 53 introns in HGT donor organisms but did not retain them in recipient insects (i.e., intron loss); 849 lost 245 introns (loss is inferred based on the observation that 245 introns are present in the corresponding genes in HGT donor organisms), but gained 1,534 introns in recipient insects after gene transfers (i.e., intron gain) (Figure 4A).
Figure 4. Repeat-rich intron gains from native insect genomes were likely involved in the adaptation of HGTs in insects.
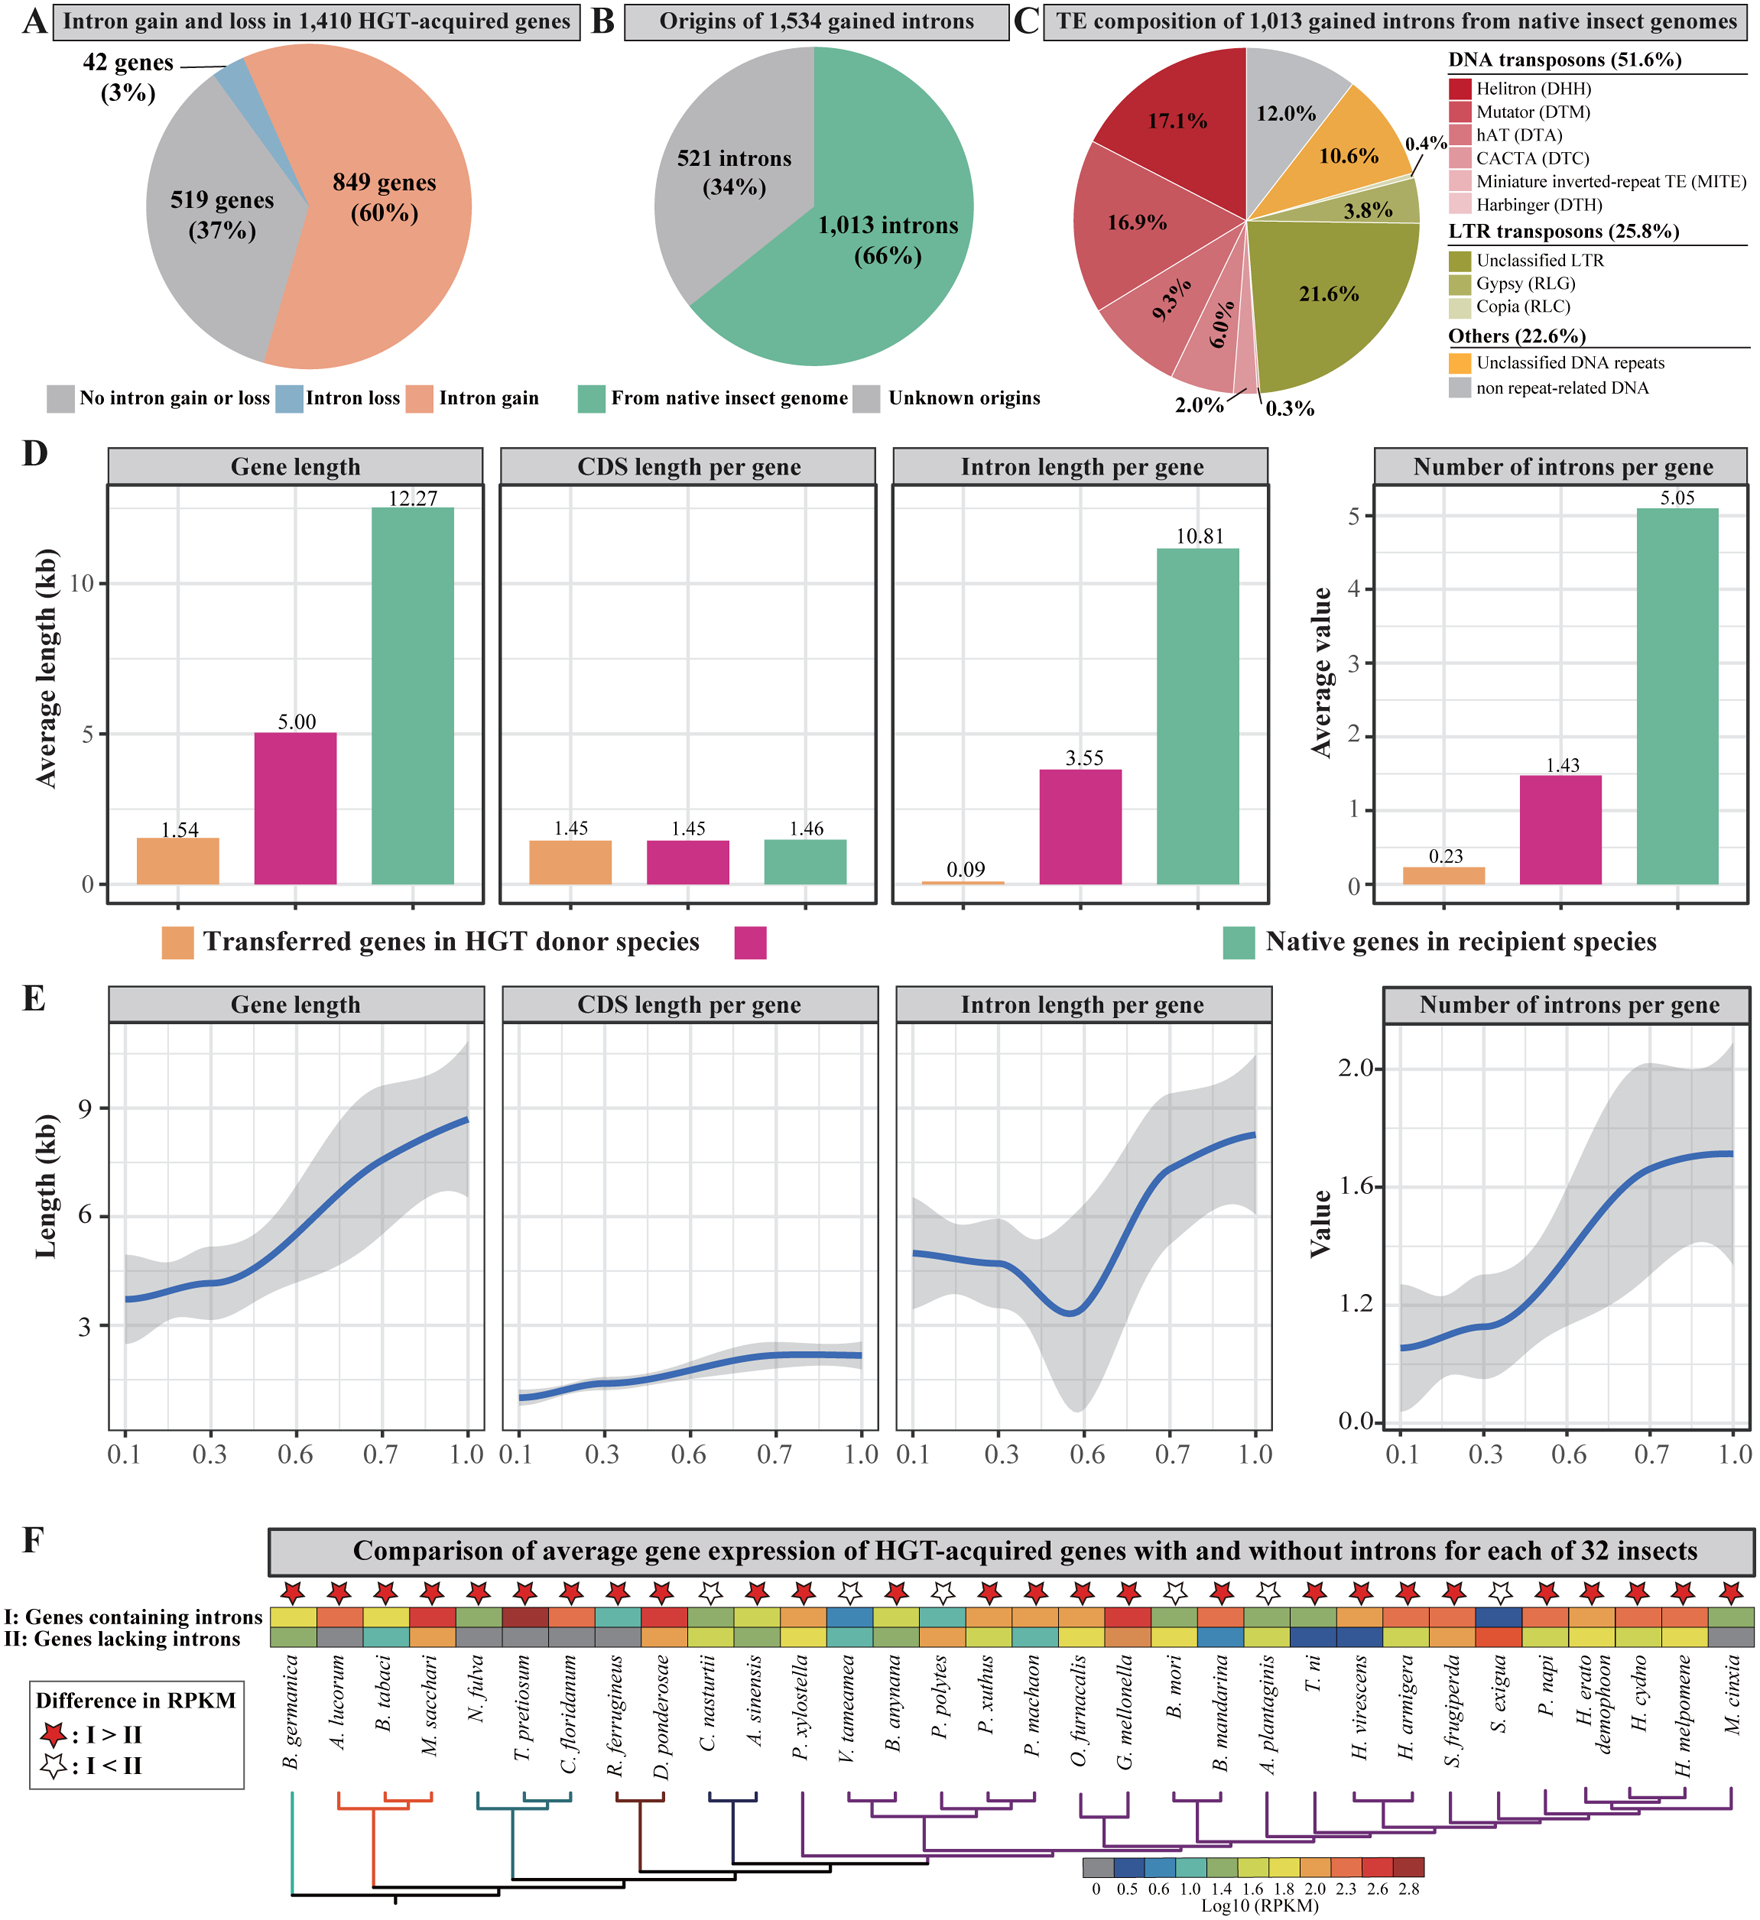
A) After the integration of the 1,410 HGT-acquired genes into insect genomes, 849 gained 1,534 introns ≥ 100 bp in length (orange), 42 lost 53 introns (blue), and 519 had no intron gain or loss (gray). B) The origins of 1,534 gained introns. 1,013 introns are highly similar to sequences present in native insect genomes (green), while the sequences of the remaining 521 introns do not show similarity to the native insect genomes and were likely acquired from other organisms (gray). C) The transposable element (TE) compositions of 1,013 introns gained from native insect genomes. D) Comparisons of characteristics between transferred genes in HGT donor species (orange), foreign genes in recipient species (red), and native genes in recipient species (green). The left three boxes correspond to gene length, CDS length, and intron length, respectively. The right box corresponds to number of introns per gene. E) Characterizing changes in gene structures (gene length, CDS length, intron length, and number of introns) for the HGT-acquired genes in the context of relative divergence times. For these analyses, we examined the 822 / 1,410 HGT-acquired genes that were inferred to have been acquired in the common ancestor of two or more of the 218 species included in our study. The relative divergence times were inferred by the RelTime in MEGA7 (Kumar et al., 2016) using the ML tree in Figure 1. F) Comparison of average expression level between HGT-acquired genes containing introns (I: first row) and HGT-acquired genes lacking introns (II: second row) for each of 32 insects representing 6 of 11 orders in our study. Note that we compared HGT-acquired genes with and without introns only within each transcriptomic dataset (e.g., only using transcriptome data from the same stage and the same tissue for a given species). We used 90 publicly available transcriptome datasets to calculate the expression levels of HGT-acquired genes containing introns and HGT-acquired genes lacking introns within each transcriptomic dataset. The information of developmental stage and tissue for the transcriptome data for each species is given in Table S3. The phylogeny of 32 insects was taken from the full phylogeny of 218 insects in Figure 1. For a given species, a red star indicates that the average expression level of HGT-acquired genes containing introns is higher than that of HGT-acquired genes lacking introns, while a white star indicates that the average expression levels of HGT-acquired genes containing introns is lower than that of HGT-acquired genes lacking introns. See also Table S3.
Since the identifications of HGT-acquired genes were based on the protein sequences, the origins of these 1,534 gained introns in 849 HGT-acquired genes were unknown. To address this question, we carried out BLASTN searches of DNA sequences of introns against a custom database consisting of Nucleotide (nt) database at the NCBI as of 20 April 2022, and 218 insect genomes, with an e-value cutoff of 1e-5 and the option “-task blastn-short”. We found that 1,013 / 1,534 (66%) introns had blast hits, with an average identity of 86%, while 521 / 1,534 (34%) had no blast hits (Figure 4B). Further analyses of best hits for the 1,013 introns showed that all best hits came from their native insect genomes. Characterizing the features of these 1,013 gained introns from native insect genomes, we found that 891 / 1,013 (88%) introns are repeat-rich DNA sequences, including DNA transposons (51.6%), LTR transposons (25.8%), and unclassified repeats (10.6%) (Figure 4C).
By characterizing the gene structures of 1,410 HGT-acquired genes in the putative donor and recipient genomes as well as of all native insect genes, we found that the length of HGT-acquired genes in insects was significantly longer than that of their counterparts in HGT donor species, but significantly shorter than that of native genes in insects (on average, length of acquired genes in recipient genomes: 5.00 kb, length of transferred genes in HGT donor genomes: 1.54 kb, length of native genes in recipient genomes: 12.27 kb) (Figure 4D). The 1,410 HGT-acquired genes in the putative donor and recipient genomes had similar CDS lengths compared to all native insect genes (on average, length of CDS in foreign genes in recipient genomes: 1.45 kb, length of CDS in transferred genes in HGT donor genomes: 1.45 kb, length of CDS in native genes in recipient genomes: 1.46 kb) (Figure 4D). In contrast, the length of introns in the 1,410 HGT-acquired genes in the recipient genomes was substantially higher than that in the putative donor genomes but was significantly shorter than that of introns in native genes (on average, length of introns in foreign genes in recipient genomes: 3.55 kb, length of introns in transferred genes in HGT donor genomes: 0.09 kb, length of introns in native genes in recipient genomes: 10.81 kb) (Figure 4D). This trend can be explained by intron gain events (on average, number of introns in foreign genes in recipient insects: 1.43, number of introns in transferred genes in HGT donor species: 0.23, number of introns in native genes in percipient insects: 5.05) (Figure 4D).
To further explore whether intron gains were involved in the adaptation of HGT-acquired genes to insect genomes, we conducted two separate analyses: First, we examined the changes of gene structures of HGT-acquired genes over evolutionary time (Figure 4E). Since inferring the time of evolutionary divergence of species-specific HGT-acquired genes is infeasible, we focused on the 822 / 1,410 HGT-acquired genes that were present in two or more insect species. We found that gene length, intron length, and number of introns apparently increased over evolutionary time, while CDS length did not significantly change over evolutionary time (Figure 4E). Second, we compared expression levels of HGT-acquired genes containing introns and HGT-acquired genes lacking introns for transcriptome datasets from each of 32 insects representing 6 / 11 orders using 90 publicly available transcriptome data (Table S3). Note that we compared HGT-acquired genes with and without introns only within each transcriptomic dataset (e.g., only using transcriptome data from the same stage and the same tissue for a given species). Of the 32 insect datasets, 26 (81.3%) had on average ~ 11-fold higher gene expression levels of HGT-acquired genes containing introns compared to HGT-acquired genes lacking introns, while only six (18.7%) had on average ~ 4-fold lower gene expression levels of HGT-acquired genes containing introns compared to HGT-acquired genes lacking introns (Figure 4F). Collectively, our results show that repeat-rich intron gains from native insect genomes, which enabled these foreign genes to increase their lengths toward the average length of native genes, were likely involved in adaptation of HGTs in insect genomes.
The last common ancestor of moths and butterflies horizontally acquired a foreign gene that enhances male courtship behavior from a donor in the bacterial genus Listeria
We evaluated the genetic function of the prevalent HGT-acquired gene LOC105383139 in our list, which was acquired by the last common ancestor of moths and butterflies from a donor in the bacterial genus Listeria (Figure 5A). This gene belongs to the zinc-binding alcohol dehydrogenase family predicted by the Pfam database (Mistry et al., 2021) and the Alphafold2 (Jumper et al., 2021), but little is known about its function in either the donor organism or the recipient insects. The gene family phylogeny of LOC105383139, which includes sequences of the gene from nearly all examined moths and butterflies, except for the moth Chilo suppressalis and the butterfly Leptidea sinapis, shows that 12 species contain multiple-copy homologs (e.g., Papilio machaon), while 25 species contain only a single-copy homolog (e.g., Plutella xylostella). After searching all 37 publicly available lepidopteran genomes, we found only six moth and two butterfly genomes that reported sex chromosomes. In all eight genomes, we found that the gene LOC105383139 resides in the autosomes rather than the sex chromosomes. To evaluate the gene’s function, we used the CRISPR-Cas9 system to create homozygous mutants (MT-139) at generation 2 (G2) with two sgRNAs in diamondback moth Plutella xylostella, a serious agricultural pest of crucifer vegetables (Figure 5B).
Figure 5. The prevalent HGT-acquired gene LOC105383139 enhances male courtship behavior in lepidopterans.
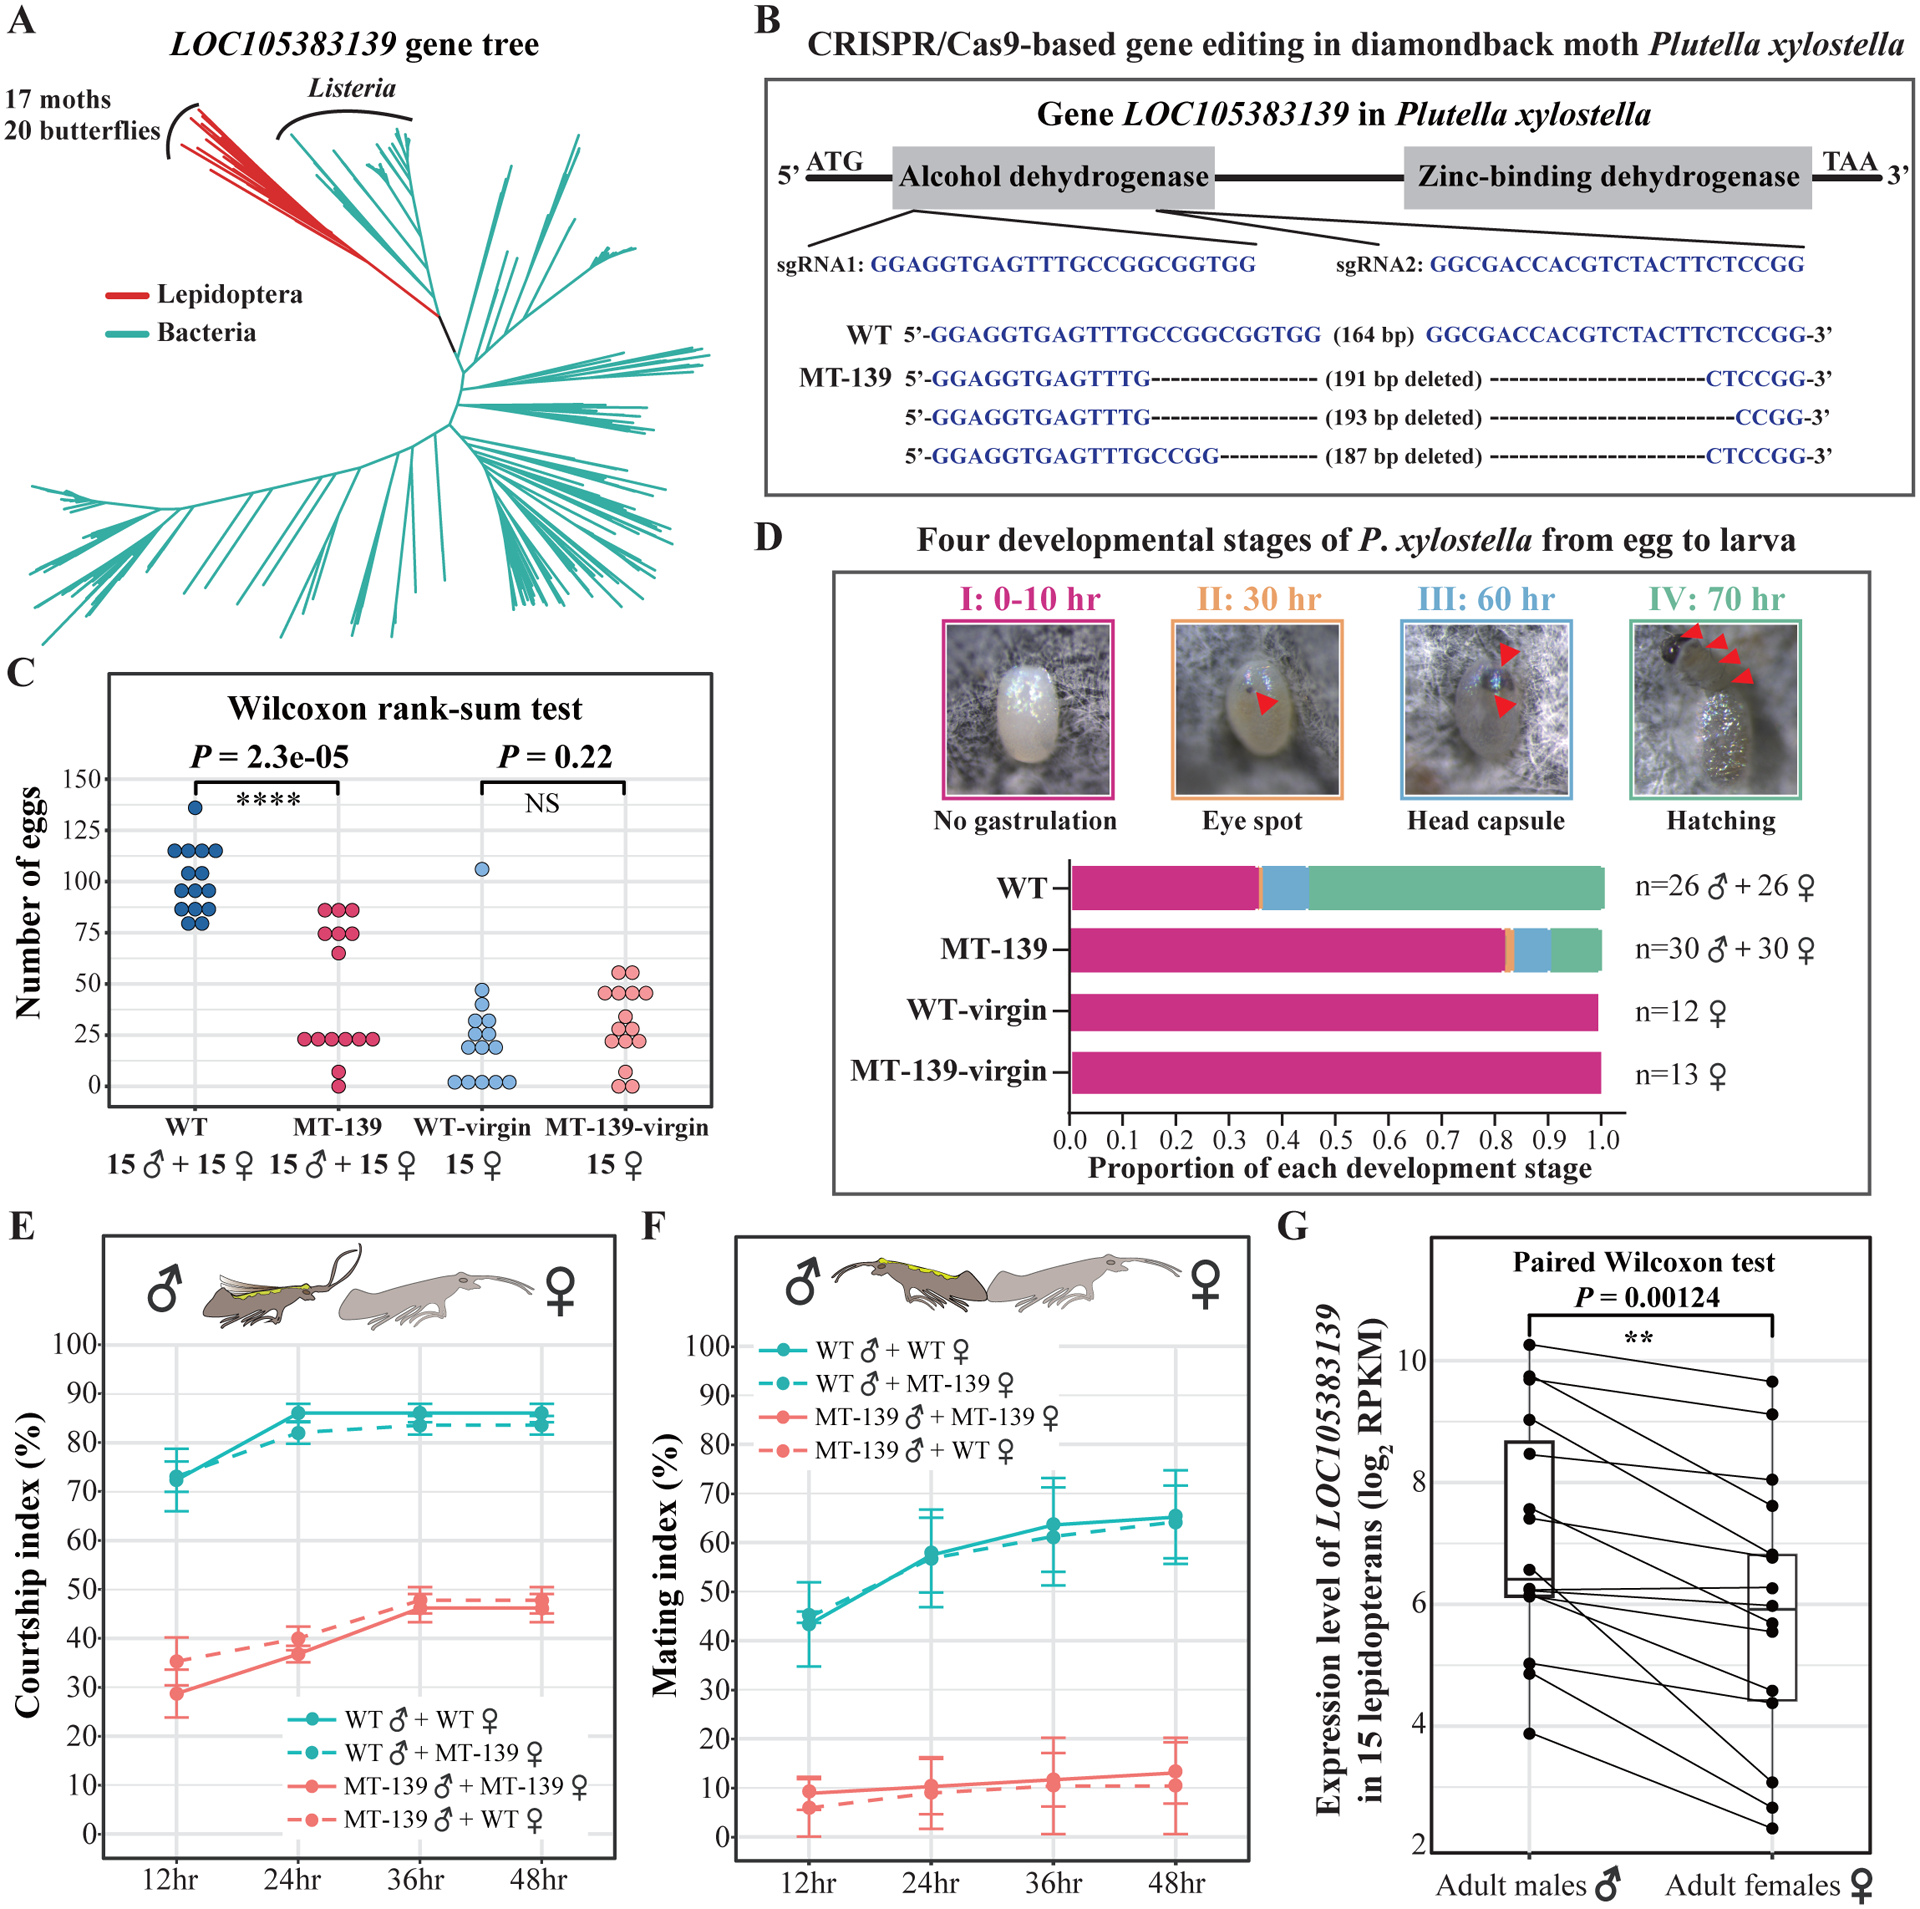
The prevalent HGT-acquired gene LOC105383139, which belongs to the large protein family of zinc-binding alcohol dehydrogenases, is present in nearly all moths and butterflies in our study, except for the moth Chilo suppressalis and the butterfly Leptidea sinapis. A) A simplified gene family phylogeny of the gene LOC105383139. Red branches indicate moths and butterflies, while green branches indicate Bacteria. B) A simplified schematic diagram of the generation of the homozygous mutant line (MT-139) using the CRISPR-case9 systems with two sgRNAs to edit single-copy gene LOC105383139 in Plutella xylostella. Three representative mutant lines are given in the below box. C) Comparison of numbers of eggs produced by wild-type males + wild-type females (MT, n=15 pairs), knockout males + knockout females (WT-139, n=15 pairs), wild-type virgin females (WT-virgin, n=15 females), and knockout virgin (WT-139-virgin, n=15 females) in 48 hours. D) Characterizing four developmental stages of P. xylostella from egg to hatching within 70 hours. Red arrows in the upper box indicate changes through four developmental stages. Stacked bars in the below box indicate the proportions of each of four stages for four different treatments. Note that all eggs produced by 4 / 26 (15.4%) pairs of wild-type moths (WT) and by 20 / 30 (66.7%) pairs of knockout moths (MT-139) were completely stuck in the stage I (no gastrulation). E) Percentage of successfully courted pairs of adult females and adult males during 48 hours. Courtship index is the percentage of successfully courted pairs, in which the male moves toward the female with flapping wings and tipping the abdomen, in a given time period. F) Percentage of successfully mated pairs of adult females and adult males during 48 hours. Mating index is the percentage of successfully mated pairs in which the male copulates with the female for approximately one hour. We used four treatments to conduct behavioral assays: wild-type males (WT♂) + wild-type females (WT♀), wild-type males (WT♂) + knockout females (MT-139♀), knockout males (MT-139 ♂) + knockout females (MT-139♀), and knockout males (MT-139♂) + wild-type females (WT♀). Each treatment had three replicates using 24 pairs of 1-day-old male and female adult moths. G) Comparison of gene expression of the gene LOC105383139 in 15 pairs (males ♂ and females♀) of adult lepidopterans. See also Figures S3–S5, Table S4, and Video S1.
During rearing diamondback moths, we initially found that knockout (MT-139) moths have ~ 5–6- fold lower number of offspring, but have no significant differences in five developmental phenotypes, including body size, feeding, movement, testis size, and sperm activity (Figure S3), compared with wild-type moths (WT). To identify underlying causes of lower number of offspring in knockout moths, we first measured the number of eggs produced by emerging knockout and wild-type moths in 48 hours. We found that number of eggs produced by 15 pairs of knockout males + knockout females (MT-139) was significantly lower than that of eggs produced by 15 pairs of wild-type males + wild-type females (WT) (on average, MT-139: 46 eggs, WT: 101 eggs) (Figure 5C). However, the number of eggs produced by 15 knockout virgin females was similar to the number of eggs produced by 15 wild-type virgin females (on average, MT-139-virgin: 28 eggs, WT-virgin: 25 eggs) (Figure 5C). Next, we examined four developmental stages from eggs to hatching during 70 hours. We found that the rate of successfully hatched eggs (stage IV in Figure 5D) in knockout moths was substantially lower than that of successfully hatched eggs in wild-type moths (MT-139: rate of hatched eggs = 9.5%; WT: rate of hatched eggs = 56%). Among these unsuccessfully hatched eggs in knockout moths, over 80% of eggs were stuck in the stage I (no gastrulation) for 70 hours (Figure 5D), while in wild-type moths only 35% of eggs were stuck in the stage I for 70 hours. Strikingly, of 30 examined pairs of knockout moths (MT-139), 20 (66.7%) were found to have all their eggs stuck in stage I (no gastrulation). However, in wild-type moths there were only 4 / 26 (15.4%) pairs of wild-type moths (WT) whose eggs were stuck in the stage I. We also examined the developmental stages of unfertilized eggs produced by knockout virgin females (MT-139-virgin) and wild-type virgin females (WT-virgin). We found that all unfertilized eggs were completely stuck in stage I from knockout virgin females (MT-139-virgin) and wild-type virgin females (WT-virgin). These results suggest that a higher proportion of eggs that were stuck in the stage I (no gastrulation) from knockout (MT-139) moths, were likely due to a higher rate of unfertilized eggs in knockout moths (Figure 5D).
Through further observations, we found that knockout (MT-139) moths had apparently lower mating rates than wild-type moths (WT). To precisely quantify mating behavior, we evaluated courtship index and mating index for wild-type (WT) and knockout (MT-139) moths that were one day old after emergence for 48 consecutive hours, respectively. Courtship index is the percentage of successfully courted pairs, in which the male moves toward the female with flapping wings and tipping the abdomen, in a given time period (Xu et al., 2020). Mating index is the percentage of successfully mated pairs in which the male copulates with the female for approximately one hour (Song et al., 2014). We used four treatments for behavioral experiments: wild-type males (WT♂) + wild-type females (WT♀), wild-type males (WT♂) + knockout females (MT-139♀), knockout males (MT-139♂) + knockout females (MT-139♀), and knockout males (MT-139♂) + wild-type females (WT♀) (each treatment had three replicates using 24 pairs of 1-day-old male and female adult moths) (Figure 5E and F). Strikingly, we found that knockout males (MT-139♂) had significantly lower percentage of courting attempts toward knockout (MT-139♀) and wild-type (WT♀) females than wild-type males (WT♂) (on average percentage of courted pairs, MT-139♂+ MT-139♀: 46%; MT-139♂+ WT♀: 48%; WT♂+ WT♀: 86%; WT♂+ MT-139♀: 84%) (Figure 5E). Moreover, knockout males (MT-139♂) had significantly lower percentage of mating with knockout (MT-139♀) and wild-type (WT♀) females than wild-type males (WT ♂) (on average percentage of mating pairs, MT-139♂+ MT-139♀: 13%; MT-139♂+ WT ♀: 10%; WT♂+ WT♀: 65%; WT♂+ MT-139♀: 64%) (Figure 5F, Table S4, and Video S1).
We also examined the role of the gene LOC105383139 in two closely related butterflies (Heliconius melpomene and Heliconius cydno) with publicly available courtship data and transcriptome data (eye and brain) in courtship situations (Merrill et al., 2019; Rossi et al., 2020) (Figure S4). We found that H. melpomene males, which courted females significantly more than H. cydno males (on average, number of courting episodes toward females in five trials, H. melpomene: 18; H. cydno: 6) (Figure S4A), had a 6.5-fold higher expression level of the gene LOC105383139 compared with H. cydno males (on average, the expression level of the gene LOC105383139 in five male adults, H. melpomene: 130 RPKM; H. cydno: 20 RPKM) (Figure S4B). Further analyses of the publicly available transcriptome data of 15 pairs of adult male and female lepidopterans revealed that males had significantly higher expression levels of the gene LOC105383139 than females as well (Figure 5G). Collectively, these results suggest that one of the functions of the gene LOC105383139 acquired by the last common ancestor of moths and butterflies via HGT is the enhancement of male courtship behavior.
The question then arises, what genes interact with the male courtship-associated foreign gene LOC105383139? We first quantified the gene’s expression levels at 13 different developmental stages from egg to adult in diamondback moths (see METHODS). Consistent with the results of 15 pairs of publicly available lepidopteran transcriptome data (Figure 5G), the qRT-PCR results showed that adult males had the highest expression levels when compared to different developmental stages in male and female moths. In addition, we also examined the expression levels of the foreign gene LOC105383139 in five tissues (antennae, head, thorax, abdomen, and reproductive system) in male moths. Interestingly, we found that the foreign gene was highly expressed in the abdomen and the reproductive system, while was lowly expressed in antennae, head, and thorax. Next, we generated transcriptome data of the whole bodies for 1-day-old wild-type male adult (WT male), wild-type female adult (WT female), knockout male adult (MT-139 male), and knockout female adult (MT-139 female). We found that 462 genes were significantly under-expressed and 359 were significantly over-expressed in the MT-139 male vs WT male analysis.
The GO term enrichment analysis reveals that in the MT-139 male vs WT male analysis, the terms courtship behavior, reproductive process, metabolic process, biological regulation, and response to stimulus were significantly enriched in the 462 under-expressed genes, while the terms developmental process, localization, metabolic process, and immune system process were significantly enriched in the 359 over-expressed genes (Figure S5A). Examination of biological process of the 462 under-expressed genes in the MT-139 male vs WT male analysis identified nine genes (FBgn0028572: quick-to-court, FBgn0003068: period, FBgn0000535: ether a go-go, FBgn0263111: cacophony, FBgn0020277: lush, FBgn0011279: Odorant-binding protein 69a, FBgn0283510: Peptidyl-α-hydroxyglycine-α-amidating lyase 1, FBgn0004573: 5-hydroxytryptamine receptor 7, and FBgn0005626: Tyrosine 3-monooxygenase in Drosophila melanogaster), which could potentially be involved in courtship behavior (GO term: 0007619). In contrast, courtship-associated genes were not found from the set of the 359 over-expressed genes (Figure S5A). These results suggest that these nine courtship-associated genes, and possibly other differentially expressed genes, that interact with the foreign gene LOC105383139 might be involved in male courtship behavior, but their roles in diamondback moths deserve further experimental investigations. We also performed analysis of differential gene expression and GO term enrichment for MT-139 female vs WT female, and identified 348 genes that were significantly under-expressed and 375 that were significantly over-expressed. However, these differentially under- / over-expressed genes were mostly involved in metabolic process, developmental process, cellular process, biological regulation, locomotion, response to stimulus, and signaling, but none of them were associated with female mating behaviors, including mate choice (mate recognition and acceptance) and oviposition (Figure S5B).
Discussion
In this study, taking advantage of the high-quality genomes of 218 insects representing 11 of 19 species-rich orders (i.e., orders with >1,000 described species) (Stork, 2018), we systematically inferred that 1,410 genes were transmitted via 741 distinct HGT events into insects from non-metazoan (mostly bacterial) sources.
What is the distribution of HGT-acquired genes across insects?
Many previous studies have shown the occurrence of HGT in insects, but their taxon sampling strategies focused on either a few insects of interest or on a specific order of insects (e.g., Crisp et al., 2015; Daimon et al., 2005; Dhaygude et al., 2019; Irwin et al., 2022; Di Lelio et al., 2019; McKenna et al., 2019; Moran and Jarvik, 2010; Parker and Brisson, 2019; Sun et al., 2013; Woolfit et al., 2009; Xia et al., 2021; Zhu et al., 2011). To date, McKenna et al. (McKenna et al., 2019) carried out a comprehensive investigation of HGTs in the order Coleoptera (beetles), in which they used 154 transcriptomes or genomes to specifically study the 10 plant cell wall-degrading enzymes (PCWDEs) that were acquired from bacteria and fungi via HGT.
Although these previous efforts are significant in establishing the occurrence and ecological importance of HGT in insects, the use of sparse and sporadic sampling of insect genomes has hampered better understanding of the distribution of HGT-acquired genes across the insect lineage, the largest and most diverse clade containing >50% of all described animals. Our systematic identification of 1,410 HGTs shows that the order Lepidoptera acquired by far the highest average number of HGT-acquired genes (16 genes per species), followed by the orders Hemiptera (13 genes per species), Coleoptera (6 genes per species), Hymenoptera (3 genes per species), and Diptera (2 genes per species) (Figure 1). In addition, examination of putative HGT donor organisms and known symbionts of host insects revealed that genes in insect symbionts were likely to be horizontally transferred into the host insects (Figure 3A and B), which is consistent with previous findings (Archibald, 2015; Blondel et al., 2020; Bublitz et al., 2019; Degnan, 2014; Eleftherianos et al., 2013; Engel and Moran, 2013; Hotopp et al., 2007; Husnik et al., 2013; Paniagua Voirol et al., 2018; Perreau and Moran, 2022).
What factors contribute to adaptation of foreign genes in insects?
In general, many studies agree that HGT-acquired genes were involved in adaptation to recipient genomes, but views vary on factors that contribute to the adaptation of these foreign genes in insect genomes (e.g., Arnold et al., 2022; Husnik and McCutcheon, 2018). For example, codon usage is an important factor that determines the fate of transferred genes due to the need for compatibility with the transfer RNA (tRNA) pool in the host (Husnik and McCutcheon, 2018). Selection is also considered as the dominant force for the adaptation of HGTs in bacteria, but there is still much debate whether most transfers are beneficial to, neutral or even deleterious to the recipients (Arnold et al., 2022). In addition, a recent study argued that introns did not give rise to significant difference in gene length between foreign genes and native genes and did not play an important role in adaptations of foreign genes to recipient phytoplankton genomes (Fan et al., 2020). In our study, we found that 849 / 1,410 HGT-acquired genes contain repeat-rich introns, which were likely acquired from the native insect genomes after the initial gene transfers (Figure 4A–C). Moreover, comparison of gene structures between HGT-acquired genes in the context of divergence tines shows that intron gain events occurred over evolutionary time, which enabled these foreign genes to increase their lengths toward the average length of native genes (Figure 4D and E). More importantly, HGT-acquired genes containing introns exhibited substantially higher expression levels than genes lacking introns (Figure 4F), which is consistent with previous studies in diverse organisms (green microalgae, plants, and insects) showing that intron gains can enhance gene expression levels (Baier et al., 2018; Husnik et al., 2013; Rose et al., 2011). Overall, our results suggest that the repeat-rich introns acquired from native insect genomes were likely involved in adaptation of HGTs to recipient genomes.
What are the biological functions of foreign genes in insects?
Many previous studies have reported instances of HGT-acquired genes contributing to important traits in insects, although only some of them constructed the mutants to verify function due to the challenge in genome editing for non-model insects (Dai et al., 2021; Gasmi et al., 2021; Di Lelio et al., 2019; Meng et al., 2009; Moran and Jarvik, 2010; Parker and Brisson, 2019; Xia et al., 2021). Among these previously reported HGTs, three are well studied and have shown that transferred genes can have ecologically diverse functions, including in body coloration (Moran and Jarvik, 2010), detoxification (Xia et al., 2021), and defense (Gasmi et al., 2021). In our study, the set of 1,410 HGT-acquired genes not only included the majority (~85%) of previously reported cases (including the three examples cited in the previous sentence), but also provided additional diverse functions, including but not limited to metabolism, courtship behavior, nutrition, adaptation to extreme environment, growth, and development. In the list of 1,410 HGT-acquired genes, the prevalent gene LOC105383139, which was horizontally introduced into nearly all moths and butterflies from a donor in the bacterial genus Listeria, was validated by the CRISPR-Cas9 system and a series of behavioral experiments in the diamondback moth Plutella xylostella. Surprisingly, we found that male diamondback moths lacking the gene LOC105383139 courted female ones significantly less, showing reduced level of mating behavior. The master genes fruitless and doublesex were well studied in courtship behavior in fruit fly and silkworm (Anderson, 2016; Greenspan and Ferveur, 2000; Pan and Baker, 2014; Xu et al., 2020; Yamamoto and Koganezawa, 2013), but none of previous studies reported that a foreign gene can be also associated with courtship behavior.
In summary, our results provide a resource of HGT-acquired genes in insects. This resource will enable users to study the functions of these foreign genes not only in our examined species but also in other insects. Moreover, the tempo and mode of evolution of these HGT-acquired genes insects also provide guidelines for insect biological science, insect pest control, and insect biodiversity.
Limitations of the study
Our study suggests that HGT is widespread in insect genomes and has likely contributed to insect adaptation. There are a few limitations to our study. First, the disproportional genome sampling across different insect orders could potentially influence the precision of our estimates of the number of HGT-acquired genes and HGT donor sources (e.g., symbionts) between orders. Second, although we deemed that intron gains from insect native genomes were likely involved in adaptation of HGTs in insect genomes, we cannot exclude alternative explanations of how foreign genes evolved in insect genomes, such as selective constraint under rapid adaptation to environmental change (Woods et al., 2020). Third, the disruption of the gene LOC105383139 in diamondback moths significantly reduces males’ courting of females, but its functional role in other lepidopteran species has not yet been validated with genome editing technology. As more insect genomes are sequenced and genome editing techniques enable genetic manipulation experiments in lepidopterans (e.g., butterflies) at higher levels of efficiency, these limitations could be experimentally tested.
STAR ★ METHODS
RESOURCE AVAILABILITY
Lead contact
Further information and requests for resources and reagents should be directed to and will be fulfilled by the lead contact: Xing-Xing Shen (xingxingshen@zju.edu.cn).
Materials availability
This study did not generate any new unique reagents or materials to report. All reagents or materials used are commercially available.
Data and code availability
All gene alignments, gene trees, additional figures and tables, and summary statistics, are publicly available on the figshare repository (http://dx.doi.org/10.6084/m9.figshare.18094172). Raw RNA sequencing data has been deposited in GenBank under Bioproject ID: PRJNA801500 and are publicly available as of the date of publication.
All original code is publicly available on Github (https://github.com/xingxingshen/HGTfinder).
Any additional information required to reanalyze the data reported in this work paper is available from the Lead Contact upon request.
EXPERIMENTAL MODEL AND SUBJECT DETAILS
Plutella xylostella rearing
Plutella xylostella that were originally collected in 2015 from the cabbage field in Hangzhou (30°30’N, 120°09’E), Zhejiang Provence, China, were reared at 25 ± 1°C and 65 ± 5% relative humidity under a 16-hour light and 8-hour dark photoperiod. Larvae were fed with cabbage, while adults were supplied with 10% honey solution. Both one day old male and female adults after emergence were used in this study.
METHOD DETAILS
Taxon sampling
To collect the greatest possible set of genome representatives of the class Insecta as of 17 November 2020, we used “insects” as search term in NCBI’s Genome Browser (https://www.ncbi.nlm.nih.gov/genome/browse#!/eukaryotes/insects) to obtain the basic information of species name, assembly accession number, assembly release date, assembly level (e.g., contig, scaffold, etc.), and GenBank FTP access number. For species with multiple genomes sequenced, we only included the genome that has publicly available annotation, the highest assembly level, and the latest release date. In addition, we also included high-quality genomes of all 12 butterflies in Lepbase (http://lepbase.org/) (Challis et al., 2016). Collectively, we included 218 insects representing 11 of 19 species-rich orders (i.e., orders with >1,000 described species) (Stork, 2018), including Ephemeroptera (2), Orthoptera (1), Blattodea (4), Thysanoptera (2), Hemiptera (19), Phthiraptera (1), Hymenoptera (68), Coleoptera (19), Lepidoptera (39), Siphonaptera (1), and Diptera (62). Analysis of genome assembly completeness reveals that 212 of 218 (~97%) genomes have ≥ 90% of the 1,367 preselected genes that are single-copy in at least 90% of the 75 reference insect genomes in OrthoDB v10 (Kriventseva et al., 2019; Manni et al., 2021; Waterhouse et al., 2013). Detailed information is given in Table S1.
Identification of HGTs into insects
To detect insect genes that may have been horizontally acquired from non-metazoan organisms, we employed a robust and conservative phylogeny-based approach (Figure S1) (Gonçalves et al., 2018; Shen et al., 2018; Wisecaver et al., 2016). Our approach incorporated the information from each gene’s Alien Index (AI) score, which compared the similarity of the gene between specified ingroup and outgroup taxa (e.g., insects and bacteria, respectively), the distribution of outgroup taxa in the list of each gene’s top 1,000 blast hits against the Refseq database (last accessed January 10, 2021), as well as each gene’s placement in a maximum likelihood phylogenic tree with its 1,000 most similar homologs. To avoid spurious results due to the presence of small genomic fragments of contaminant organisms in our genome assemblies, we limited our analyses to those genes that resided in genomic contigs or scaffolds that were ≥ 100 kb, which was adopted from our previous study (Shen et al., 2018). This filter resulted in the analysis of 2,806,851 of 3,185,017 (88.1%) protein-coding genes in 218 insect genomes.
For each gene’s protein sequence, we evaluated whether it had been horizontally acquired using a two-step workflow following the pipeline provided by Shen et al., (Shen et al., 2018) (Figure S1). Briefly, in step 1 we first carried out a BLASTP in DIAMOND v 2.0.9 (Buchfink et al., 2021) search against a custom database (Refseq+) consisting of the reference protein sequences (Refseq) (last accessed January 10, 2021) and all insect protein sequences, with an e-value cutoff of 10−10. We next used HGTfinder v1 (Shen et al., 2018) to: (a) assign taxonomic information to each BLAST hit from the NCBI Taxonomy database, and then (b) parse the BLAST hits, based on their taxonomic information, into three different lineages (RECIPIENT: insects; GROUP: other metazoans; OUTGROUP: non-metazoan) so as to obtain three values: bbhO (BLAST bitscore of the best hit in OUTGROUP lineage), bbhG (bitscore of the best hit in GROUP lineage but not in RECIPIENT lineage), and maxB (bitscore of the query to itself). Using this information, we next calculated: (a) the Alien Index: , and (b) the percentage of species from OUTGROUP lineage (outg_pct) in the list of the top 1,000 hits that have different taxonomic species names. From the 2,806,851 genes analyzed, 28,822 genes passed the cutoffs AI value > 0 and outg_pct ≥ 80%. In step 2, we retrieved the 1,000 most similar homologs from the Refseq+ database (see above), aligned them by the MAFFT, version 7.299 (Katoh and Standley, 2013), with “--auto” option, and trimmed ambiguously aligned regions using trimAl v1.4 (Capella-Gutierrez et al., 2009) with “-automated1” option. We then used the resulting alignment to infer the ML tree using IQ-TREE 1.6.12 (Nguyen et al., 2015) with its best-fitting model of amino acid evolution and 1000 ultrafast bootstrapping replicates (Minh et al., 2013). Lastly, we rooted each ML tree at the midpoint using the ape and phangorn R packages (Ihaka and Gentleman, 1996; Paradis et al., 2004; Schliep, 2011) and visualized it using the command version of iTOL v4 (Letunic and Bork, 2019). After manually inspecting all 28,822 ML trees, we identified 1,410 putative HGT-acquired genes. We compared the number of HGT-acquired genes between 165 genomes annotated by NCBI pipeline and 53 genomes annotated by the authors of the original studies and found that the number of HGT-acquired genes did not differ significantly between the two types of genome annotations (Wilcoxon rank-sum test; P-value = 0.16).
Validation of HGT-acquired genes
To evaluate the reliability of 1,410 putative HGT-acquired genes, we carried out three separate analyses: PCR assays, comparison of our putative HGT-acquired genes with previously published genes, and gene expression assays of HGT-acquired genes.
PCR assays:
We randomly sampled 54 genes acquired by 16 different insects, representing 8 / 11 orders in this study. For each gene, we first used two separate PCR reactions to amplify upstream and downstream regions that flanked the foreign gene. Each PCR target size was ~ 1,500 bp. We used agarose gel electrophoretic analysis to judge whether PCR products were expected or not. If the PCR product matched our expected size, we then sequenced the PCR product using Sanger sequence technology. Here, we considered that the HGT-acquired gene was successfully validated if its upstream and downstream regions were successfully amplified and their Sanger sequences were nearly identical (identity of ≥ 98%) to DNA sequences in our contigs or scaffolds.
Comparison of our putative HGT-acquired genes with previously published genes:
To collect the greatest possible set of previously published HGT-acquired genes as of 20 June 2021, we used “insect and HGT” and “insect and horizontal gene transfer” as search terms in NCBI’s PubMed Browser (https://pubmed.ncbi.nlm.nih.gov/). As a results, 68 studies were found. For each study, we manually checked whether the insects mentioned in the published study were also included in the list of our 218 insects. This filter resulted in the analysis of 193 HGT-acquired genes from 14 previously published studies.
Gene expressions of HGT-acquired genes:
To retrieve the transcriptome data for 218 insects, we used each species name as search term in NCBI’s Sequence Read Archive (SRA) Browser (https://www.ncbi.nlm.nih.gov/sra) to get RNA-seq SRA accession numbers. As a result, 90 transcriptome datasets for 32 insects representing 6 / 11 orders were downloaded. The detailed information of stage and tissue for the transcriptome data for each species is given in Table S3. For each of 699 genes acquired by 32 insects via HGT, we calculated its gene expression by the reads per kilobase of exon model per million mapped reads (RPKM) using featureCounts v1.6.0 (Liao et al., 2014). We found that at least 478 / 699 (68%) HGT-acquired genes had expression values ≥ 5 RPKM. Average expression of each of 32 insects varies between 11 and 4,082 RPKM. Compared to the average expression level of native genes (608 RPKM), the average expression level of HGT-acquired genes was moderately lower (350 RPKM), which is consistent with the observations in phytoplankton genomes (Fan et al., 2020) and fungal genomes (Shen et al., 2018).
Analyses of the origins of introns in HGT-acquired genes
Origins of introns:
From 1,410 HGT-acquired genes, 849 gained 1,534 introns ≥ 100 bp in length. To identify the origin of each of 1,534 introns, we first carried out a BLASTN search against a custom database consisting of the Nucleotide (nt) database at the NCBI as of 20 April 2022 and 218 insect genomes (note that DNA sequences of HGT-acquired genes were masked in insect genomes to avoid self-hits), with an e-value cutoff of 1e-5 and the option “-task blastn-short”. We next parsed all hits for each intron and determined the putative origin of the intron.
Feature of introns:
To characterize the features of DNA sequences in introns, we first used the Extensive de novo TE Annotator (EDTA v1.9.4) to annotate the whole genome for each of 218 insects with the default settings (Ou et al., 2019). Next, we retrieved the features of introns according to their positions in genome.
Generation of the gene LOC105383139 mutants using CRISPR/Cas9 system
CRISPR/Cas9 genome editing:
Two single guide RNAs (sgRNAs) were designed to the P. xylostella gene LOC105383139 via the CRISPdirect online tool (http://crispr.dbcls.jp) based on the N20NGG rule. After searching against the P. xylostella genome, we selected two sgRNAs with the lowest probability of off-target effects: sgRNA1: 5’-GGAGGTGAGTTTGCCGGCGGTGG-3’ and sgRNA2: 5’-GGCGACCACGTCTACTTCTCCGG-3’. Note that 3’ end TGG for sgRNA1 and 3’ end CGG for sgRNA2 are the protospacer adjacent motif (PAM) sequences. DNA templates used for in vitro sgRNA synthesis were amplified with forward primers (Px139-sg1-F: 5’ TAATACGACTCACTATAGGAGGTGAGTTTGCCGGCGGGTTTTAGAGCTAGAAATAGCAAGTTAAAATAAGGCTAGTCC-3’; Px139-sg2-F: 5’-TAATACGACTCACTATAGGCGACCACGTCTACTTCTCGTTTTAGAGCTAGAAATAGCAAGTTAAAATAAGGCTAGTCC-3’) and the common reverse primer (sgRNA-R: 5’-AAAAGCACCGACTCGGTGCCACTTTTTCAAGTTGATAACGGACTAGCCTTATTTTAACTTGCTATTTCTAGCTCTAAAA-3’), respectively. PCR products were purified using TaKaRa MiniBEST Agarose Gel DNA Extraction Kit (TaKaRa) and then transcribed using T7 High Yield RNA Transcription Kit (Vazyme) according to the manufacturer’s protocol. For preparing injection solution, a mixture of sgRNA1 (500 ng/μl), sgRNA2 (500 ng/μl) and Cas9 protein (500 ng/μl, GenCrispr NLS-cas9-NLS nuclease, GenScript) was incubated at 37 °C for 10 min to form a stable sgRNAs/Cas9 complex. Given concentrations are at final volume of the injection solution.
Fresh eggs collected within 1 h post oviposition were injected with the sgRNAs/Cas9 solution using a FemtoJet 4i and an InjectMan 4 microinjection system (Eppendorf). The injected eggs were immediately returned to normal rearing conditions and were allowed to develop to adult as the initial generation (G0). Then, a serial crossing scheme was designed to establish a stable homozygous mutant strain of LOC105383139 gene. Briefly, the virgin G0 adults were mated with virgin wild-type (WT) adults in single pairs to produce the G1 progeny. After that, the genomic DNA was extracted from G0 individuals using the FastPure Cell/Tissue DNA Isolation Mini Kit (Vazyme). PCR was performed to amplify the region containing the sgRNA target sites with the genomic DNA from a plucked leg in adult moth, and the generated PCR products were sequenced to examine the mutation. After genotyping, we focused on G1 progeny derived from mutated G0. Retained G1 siblings were crossed in single pairs to generate G2 progeny. Then, single-pair crosses between G2 siblings were performed and kept only G3 progeny from homozygous mutant G2 parents by PCR-based genotyping to establish the LOC105383139 knockout strain (MT-139).
Evaluation of reproductive success
Number of eggs:
For the egg-laying assay, four different treatments of P. xylostella were set up: 15 pairs of emerged WT female and male adults (WT mated group), 15 pairs of emerged MT-139 female and male adults (MT-139 mated group), 15 emerged WT female adults (WT virgin group), and 15 emerged MT-139 female adults (MT-139 virgin group). Each pair or single female was separately kept in a plastic box. 24 hours later, the P. xylostella females were moved to a new box with a parafilm sheet containing the cabbage leaf extract for egg laying. The P. xylostella females were allowed to lay eggs for 48 hours, and the number of eggs was recorded individually. 10% honey solution was provided for nutrition.
Development of eggs:
To investigate the development of the eggs laid by the above different groups of P. xylostella females, the percent of eggs terminated at four stages were carefully monitored. The four stages are: 0–10 h (Stage I, no gastrulation), 30 h (Stage II, eye spot is visible), 60 h (Stage III, head capsule is visible), and 70 h (Stage IV, hatching). The morphological characteristics of the developing P. xylostella eggs were photographed by digital microscope SZX2-ILLT (OLYMPUS).
Behavioral experiments
We conducted four treatments: wild-type males (WT♂) + wild-type females (WT♀), wild-type males (WT♂) + knockout females (MT-139♀), knockout males (MT-139♂) + knockout females (MT-139♀), and knockout males (MT-139♂) + wild-type females (WT ♀). Each treatment had three replicates using 24 pairs of male and female moths. We sampled adults that were one day old after emergence because by this stage males are mature and frequently court females. For each individual pair no-choice assay, one 1-day-old male adult and one 1-day-old female adult were loaded into round chambers (diameter: 1.6 cm; height: 1.6 cm). The behavioral assays were performed at 25 ± 1 °C and 65 ± 5% relative humidity under the full spectrum LED light (400 lux); the assays started at 10am of 4 January 2022 and were recorded by digital video camera (FDR-AX700, SONY) for 48 consecutive hours of constant light. For a given time period, courtship index is the percentage of successfully courted pairs, in which the male moves toward the female with flapping wings and tipping the abdomen (Xu et al., 2020). Mating index is the percentage of successfully mated pairs in which the male copulates with the female for approximately one hour (Song et al., 2014).
Quantitative real-time PCR
P. xylostella from different stages of development were sampled, including egg, L1 (day 1–2 larvae), L2 (day 3 larvae), L3 (day 4 larvae), L4E (day 5 larvae), L4L-M (day 7 male larvae), L4L-F (day 7 female larvae), PE-M (day 1–2 male pupae; early pupal stage), PE-F (day 1–2 female pupae; early pupal stage), PL-M (day 4–5 male pupae; late pupal stage), PL-F (day 4–5 female pupae; late pupal stage), A-M (day 1–2 male adults) and A-F (day 1–2 female adults). In addition to 13 different stages, we also sampled five different tissues (antennae, head, thorax, abdomen, and reproductive system) in 1-day-old male adults. Total RNA was extracted using the FastPure Cell/Tissue Total RNA Isolation Kit (Vazyme) and then reverse transcribed into cDNA using HiScript III RT SuperMix for qPCR (Vazyme) according to the manufacturer’s protocol. qRT-PCR was performed in the AriaMx real-time PCR system (Agilent Technologies) with the ChamQ SYBR qPCR Master Mix Kit (Vazyme). Reactions were carried out for 30s at 95°C, followed by 45 cycles of three-step PCR for 10s at 95 °C, 20 s at 55°C, and 20s at 72°C. The RNA levels of the target gene LOC105383139 were normalized to that of tubulin mRNA, and the relative concentration was determined using the 2 −ΔΔCt method.
Transcriptome data
RNA sequencing:
P. xylostella total RNA was isolated from the whole body from 1-day-old MT-139 male adult, MT-139 female adult, WT male adult, and WT female adult using FastPure Cell/Tissue Total RNA Isolation Kit (Vazyme), and the residual DNA was removed according to the manufacturer’s protocol. Each treatment had three replicates using 10 moths. For RNA-seq data, library construction and sequencing were performed on an Illumina HiSeq2000 (pair ends).
Transcriptome analysis:
Raw RNA-seq reads were removed of low-quality reads and adapter sequences using Trimmomatic v0.39 (Bolger et al., 2014) with default parameters. Clean reads were mapped to the reference P. xylostella genome using STAR v2.7.6a (Dobin et al., 2013). The reads numbers mapped to each gene was counted by featureCounts v1.6.0 (Liao et al., 2014) and the resulting transcript count tables were subjected using R packages edgeR v3.360 (Robinson et al., 2010) and limma v3.50.0 (Ritchie et al., 2015) for differential expression analysis. Transcripts with an adjusted P value of ≤ 0.05 and log2 fold change of ≥1 or ≤ −1 were determined as differentially expressed genes. Gene Ontology (GO) enrichment analysis of differentially under- or over-expressed genes was conducted using Metascape v3.5 (https://metascape.org/) (Zhou et al., 2019) in knockout male vs wild-type male and knockout female vs wild-type female, respectively.
The role of the gene LOC105383139 in butterflies
To investigate the role of the gene LOC105383139 in butterflies, two closely related Heliconius butterflies (H. melpomene and H. cydno) were examined (Merrill et al., 2019; Rossi et al., 2020). First, we counted the number of male courting episodes toward females in five trials (each trial lasted 15 minutes) for H. melpomene and H. cydno, respectively. The publicly available courtship data were retrieved from Merrill et al. (Merrill et al., 2019). Second, we calculated the expression level of the homolog of the gene LOC105383139 in H. melpomene and H. cydno males using the publicly available transcriptomic data (Rossi et al., 2020), which were mapped to the H. melpomene and H. cydno genomes in Lepbase (http://lepbase.org/) (Challis et al., 2016), respectively. These publicly available transcriptomic data were generated in 2019 from the tissues (eye and brain) from 10-day-old male adults. By this stage males are mature and frequently court females.
QUANTIFICATION AND STATISTICAL ANALYSIS
Analysis of assessment of genome assemblies
We used the Benchmarking Universal Single-Copy Orthologs (BUSCO), version 5.2.2 (Manni et al., 2021) to assess the quality of each of the 218 insect genome assemblies. Each assembly’s completeness was assessed based on the presence / absence of a set of 1,367 predefined orthologs that are single-copy in at least 90% of the 75 reference insect genomes in OrthoDB v10 (Kriventseva et al., 2019; Waterhouse et al., 2013). Further details of these analyses are provided in STAR Methods.
Analysis of developmental and behavioral phenotypes
We used the Wilcoxon rank-sum test in R v. 3.6.3 (R core team 2021) to test whether the sets of values in two groups (knockout vs wild-type) are significantly different (NS, P > 0.05; *, P < 0.05; **, P < 0.01; ***, P < 0.001). Data are shown as the mean ± SD. Further details of number of samples and replicates are provided in STAR Methods.
Supplementary Material
Figure S1. The workflow used for the identification of genes found in insects that were likely acquired by horizontal gene transfer (HGT) from non-metazoan species, Related to Figure 1. A detailed description of the analyses performed in each step of the workflow is provided in the “Identification of HGTs into insects” section of the Methods. RECIPIENT: insects, GROUP: other metazoans, OUTGROUP: non-metazoan species.
Figure S2. Distribution of 741 HGT events on the insect phylogeny, Related to Figure 1. Examination of the phylogenetic trees of the 1,410 HGT-acquired genes showed that they stem from 741 distinct transfer events. 588 of these transfer events appear to be species-specific, whereas the remaining 153 are inferred to have occurred in the common ancestor of two or more species included in our study. Bars next to species names denote numbers of species-specific HGT events. Numbers near internodes denote numbers of HGT events that led to HGT-acquired genes found in two or more species. The RelTime algorithm employed in the command line version of MEGA7 was used to infer the relative divergence times. Note that detained numbers of HGT events given a range of the relative divergence times are given in the inset in the middle of the timetree.
Figure S3. Comparisons of developmental phenotypes between wild-type (WT) and knockout (MT-139) Plutella xylostella diamondback moths, Related to Figure 5. A) Body size (length and width), feeding (measured by the concentration of brilliant blue in extracts from abdomens of five moths after feeding with the mixture of brilliant blue and honey water), and movement (measured by percentage of 10 moths climbing over half a bottle [height: 20cm; diameter 2cm] in five minutes) were examined in wild-type (WT) and knockout (MT-139) male and female adults. B) Testis size (testis area) in wild-type (WT) and knockout (MT-139) male adults. C) Percentage of alive sperms in wild-type (WT) and knockout (MT-139) sperm bundles. GFP (SYBR 14 dye) and RFP (propidium iodide) were used to transfect sperms (LIVE/DEAD Sperm Viability Kit). Red arrows indicate examples of sperms that were alive or dead. Number of replicates for examining body size is 15; Number of replicates for examining feeding and movement is 6; Number of replicates for examining testis size and sperm activity is 3. All diamondback moths that were used to examine the developmental phenotypes were one day old after emergence. Each bar denotes mean value with standard deviation. The Wilcoxon rank-sum test was used to test whether the sets of values in two groups are significantly different (NS, P > 0.05). Our results show wild-type (WT) and knockout (MT-139) diamondback moths had no significant differences in any of the developmental phenotypes examined.
Figure S4. The horizontally acquired gene LOC105383139 might be involved in male courtship behavior in butterflies, Related to Figure 5. A) Two closely related Heliconius male butterflies (H. melpomene and H. cydno) were used to examine the number of courting episodes toward females in five trials (each trial lasted 15 minutes), respectively. The publicly available courtship data were retrieved from Merrill et al. (Merrill et al., 2019). B) The expression level of the horizontally acquired gene LOC105383139 in H. melpomene and H. cydno males during courting. The publicly available transcriptome datasets were generated in 2019 from the combined tissues (eye and brain) from 10-day-old male adults, because by this stage males are mature and frequently court females (Rossi et al., 2020). These data suggest that H. melpomene males had significantly higher number of courting episodes toward females than H. cydno males as well as higher expression levels of the gene LOC105383139 than H. cydno males. These results are consistent with our hypothesis that the foreign gene LOC105383139 might be involved in male courtship behavior in lepidopterans.
Figure S5. GO term enrichment analysis of genes differentially expressed in knockout (MT-139) male (A) and female (B) relative to wild-type (WT) male and female, Related to Figure 5. Statistically overrepresented GO categories in under-expressed and over-expressed gene sets in MT-139 vs WT are shown in left panel and right panel, respectively. −Log10(P) is the P-value in −log base 10. Bar graph of enriched terms across input gene lists, colored by P-values. The transcriptome data were generated from the whole bodies of ten 1day-old wild-type male adults (WT male), ten 1-day-old wild-type female adults (WT female), ten 1-day-old knockout male adults (MT-139 male), and ten 1-day-old knockout female adults (MT-139 female), respectively.
Table S1. The list of genome information for 218 insects used in our study, Related to Figure 1.
Table S2. The list of 1,410 HGT-acquired genes identified in our study, Related to Figure 1.
Table S3. Gene expression of 699 HGT-acquired genes in 32 insects along with stage and tissue information for each transcriptome dataset, Related to Figure 4.
Table S4. The statistics of courtship index and mating index between males and females, Related to Figure 5.
Video S1. Behavioral experiments between wild-type and knockout diamondback moths, Related to Figure 5.
KEY RESOURCES TABLE
| REAGENT or RESOURCE | SOURCE | IDENTIFIER |
|---|---|---|
| Chemicals, Peptides, and Recombinant Proteins | ||
| TaKaRa MiniBEST Agarose Gel DNA Extraction Kit Ver.4.0 | TaKaRa | Cat# 9762 |
| T7 High Yield RNA Transcription Kit | Vazyme | Cat# TR101-01 |
| GenCrispr NLS-cas9-NLS nuclease | GenScript | Cat# Z03469 |
| FastPure Cell/Tissue DNA Isolation Mini Kit | Vazyme | Cat# DC102 |
| FastPure Cell/Tissue Total RNA Isolation Kit | Vazyme | Cat# RC101-01 |
| HiScript III RT SuperMix for qPCR | Vazyme | Cat# R323-01 |
| ChamQ SYBR qPCR Master Mix Kit | Vazyme | Cat# Q311-02 |
| Brilliant blue | Tokyo Chemical Industry | Cat# F0147 |
| LIVE/DEAD Sperm Viability Kit | Invitrogen | Cat# L-7011 |
| Bovine serum albumin | Sigma | Cat# V900933-100G |
| 1M Hepes Solution | BBI Life Sciences | Cat# E607018-0100 |
| Deposited Data | ||
| Data matrices | This study | Figshare data repository: 10.6084/m9.figshare.18094172 |
| Phylogenetic trees | This study | Figshare data repository: 10.6084/m9.figshare.18094172 |
| Alignments and ML trees for horizontally acquired genes | This study | Figshare data repository: 10.6084/m9.figshare.18094172 |
| Experimental Models: Organisms/Strains | ||
| 218 sampled insect species | This study | See Table S1 |
| Software and Algorithms | ||
| HGTfinder v1.0 | Shen et al., 2018 | https://github.com/xingxingshen/HGTfinder/ |
| MAFFT v7.299 | Katoh and Standley, 2013 | https://mafft.cbrc.jp/alignment/software/ |
| DIAMOND v 2.0.9 | Buchfink et al., 2021 | https://github.com/bbuchfink/diamond/ |
| trimAl v1.4 | Capella-Gutierrez et al., 2009 | http://trimal.cgenomics.org/ |
| IQ-TREE v1.6.12 | Nguyen et al., 2015 | ttp://www.iqtree.org/ |
| iTOL v4 | Letunic and Bork, 2019 | https://itol.embl.de/ |
| BUSCO v5.2.2 | Manni et al., 2021 | https://busco.ezlab.org/ |
| MEGAv7 | Kumar et al., 2016 | https://www.megasoftware.net/ |
| Conterminator v1.c74b5 | Steinegger and Salzberg 2020 | https://github.com/martin-steinegger/conterminator |
| OrthoDB V10 | Kriventseva et al., 2019 | www.orthodb.org |
| featureCounts v1.6.0 | Liao et al., 2014 | https://rnnh.github.io/bioinfo-notebook/ |
| EDTA v1.9.4 | Ou et al., 2019 | https://github.com/oushujun/EDTA/ |
| Trimmomatic v0.39 | Bolger et al., 2014 | http://www.usadellab.org/cms/?page=trimmomatic |
| R package edgeR v3.360 | Robinson et al., 2010 | http://bioconductor.org/packages/release/bioc/html/edgeR.html |
| R package limma v3.50.0 | Ritchie et al., 2015 | https://bioconductor.org/packages/release/bioc/html/limma.html |
| R package ggplot2 | Wickham, 2009 | https://cran.r-project.org/web/packages/ggplot2/index.html |
| Metascape v3.5 | Zhou et al., 2019 | https://metascape.org/ |
Highlights.
Genome-scale screening of horizontal gene transfer (HGT) in 218 insect genomes
Intron gains from native insect genomes were likely involved in HGT adaptation
Lepidopterans acquired, on average, the highest number of HGT-acquired genes
HGT-acquired gene enhances male courtship behavior in lepidopterans
Acknowledgments
We thank Zeng-Rong Zhu, Weiguo Fang, Huabing Wang, and Xiaowei Wang for constructive feedback; Wei Zhang, Shuai Zhan, Yunpeng Zhao, and Junjie Wu for insightful discussion on the revision. We also thank Zhizhi Wang, Baoli Qiu, Shuai Zhan, Su Wang, Chonghua Ren, and Tingting Zhang for kindly providing insect genomic DNA for PCR validations. X.X.S. was supported by the National Natural Science Foundation of China (32071665) and the National Important Talents Program. J.H. was supported by the National Natural Science Foundation of China (32172467 and 31772522). Y.C. was supported by the National Natural Science Foundation of China (31922074) and the Fundamental Research Funds for the Central Universities (2021FZZX001-31). R.P. was supported by the Leading Innovative and Entrepreneur Team Introduction Program of Zhejiang (Grant no. 2019R01002). X.X.C. was supported by the Key International Joint Research Program of National Natural Science Foundation of China (No. 31920103005). Research in A.R.’s lab was supported by grants from the National Science Foundation (DEB-2110404), the National Institutes of Health/National Institute of Allergy and Infectious Diseases (R56 AI146096 and R01 AI153356), and the Burroughs Wellcome Fund.
Footnotes
Publisher's Disclaimer: This is a PDF file of an unedited manuscript that has been accepted for publication. As a service to our customers we are providing this early version of the manuscript. The manuscript will undergo copyediting, typesetting, and review of the resulting proof before it is published in its final form. Please note that during the production process errors may be discovered which could affect the content, and all legal disclaimers that apply to the journal pertain.
Declaration of Interests
A.R., is a scientific consultant for LifeMine Therapeutics, Inc. The authors declare that they have no other competing interests.
References
- Anderson DJ (2016). Circuit modules linking internal states and social behaviour in flies and mice. Nat. Rev. Neurosci 17, 692–704. [DOI] [PubMed] [Google Scholar]
- Archibald JM (2015). Endosymbiosis and Eukaryotic Cell Evolution. Curr. Biol 25, R911–R921. [DOI] [PubMed] [Google Scholar]
- Arnold BJ, Huang I-T, and Hanage WP (2022). Horizontal gene transfer and adaptive evolution in bacteria. Nat. Rev. Microbiol 20, 206–218. [DOI] [PubMed] [Google Scholar]
- Baier T, Wichmann J, Kruse O, and Lauersen KJ (2018). Intron-containing algal transgenes mediate efficient recombinant gene expression in the green microalga Chlamydomonas reinhardtii. Nucleic Acids Res 46, 6909–6919. [DOI] [PMC free article] [PubMed] [Google Scholar]
- Blondel L, Jones TE, and Extavour CG (2020). Bacterial contribution to genesis of the novel germ line determinant oskar. Elife 9. [DOI] [PMC free article] [PubMed] [Google Scholar]
- Bolger AM, Lohse M, and Usadel B (2014). Trimmomatic: a flexible trimmer for Illumina sequence data. Bioinformatics 30, 2114–2120. [DOI] [PMC free article] [PubMed] [Google Scholar]
- Boto L (2014). Horizontal gene transfer in the acquisition of novel traits by metazoans. Proc. R. Soc. B Biol. Sci 281, 20132450. [DOI] [PMC free article] [PubMed] [Google Scholar]
- Bublitz DC, Chadwick GL, Magyar JS, Sandoz KM, Brooks DM, Mesnage S, Ladinsky MS, Garber AI, Bjorkman PJ, Orphan VJ, et al. (2019). Peptidoglycan Production by an Insect-Bacterial Mosaic. Cell 179, 703–712.e7. [DOI] [PMC free article] [PubMed] [Google Scholar]
- Buchfink B, Reuter K, and Drost H-G (2021). Sensitive protein alignments at tree-of-life scale using DIAMOND. Nat. Methods 18, 366–368. [DOI] [PMC free article] [PubMed] [Google Scholar]
- Capella-Gutierrez S, Silla-Martinez JM, and Gabaldon T (2009). trimAl: a tool for automated alignment trimming in large-scale phylogenetic analyses. Bioinformatics 25, 1972–1973. [DOI] [PMC free article] [PubMed] [Google Scholar]
- Challis RJ, Kumar S, Dasmahapatra KK, Jiggins CD, and Blaxter M (2016). Lepbase: the Lepidopteran genome database. BioRxiv 10.1101/056994. [DOI] [Google Scholar]
- Crisp A, Boschetti C, Perry M, Tunnacliffe A, and Micklem G (2015). Expression of multiple horizontally acquired genes is a hallmark of both vertebrate and invertebrate genomes. Genome Biol 16, 50. [DOI] [PMC free article] [PubMed] [Google Scholar]
- Dai X, Kiuchi T, Zhou Y, Jia S, Xu Y, Katsuma S, Shimada T, and Wang H (2021). Horizontal Gene Transfer and Gene Duplication of β-Fructofuranosidase Confer Lepidopteran Insects Metabolic Benefits. Mol. Biol. Evol 38, 2897–2914. [DOI] [PMC free article] [PubMed] [Google Scholar]
- Daimon T, Katsuma S, Iwanaga M, Kang W, and Shimada T (2005). The BmChi-h gene, a bacterial-type chitinase gene of Bombyx mori, encodes a functional exochitinase that plays a role in the chitin degradation during the molting process. Insect Biochem. Mol. Biol 35, 1112–1123. [DOI] [PubMed] [Google Scholar]
- Degnan SM (2014). Think laterally: horizontal gene transfer from symbiotic microbes may extend the phenotype of marine sessile hosts. Front. Microbiol 5. [DOI] [PMC free article] [PubMed] [Google Scholar]
- Dhaygude K, Nair A, Johansson H, Wurm Y, and Sundström L (2019). The first draft genomes of the ant Formica exsecta, and its Wolbachia endosymbiont reveal extensive gene transfer from endosymbiont to host. BMC Genomics 20, 301. [DOI] [PMC free article] [PubMed] [Google Scholar]
- Dobin A, Davis CA, Schlesinger F, Drenkow J, Zaleski C, Jha S, Batut P, Chaisson M, and Gingeras TR (2013). STAR: ultrafast universal RNA-seq aligner. Bioinformatics 29, 15–21. [DOI] [PMC free article] [PubMed] [Google Scholar]
- Eleftherianos I, Atri J, Accetta J, and Castillo JC (2013). Endosymbiotic bacteria in insects: guardians of the immune system? Front. Physiol 4. [DOI] [PMC free article] [PubMed] [Google Scholar]
- Engel P, and Moran NA (2013). The gut microbiota of insects – diversity in structure and function. FEMS Microbiol. Rev 37, 699–735. [DOI] [PubMed] [Google Scholar]
- Fan X, Qiu H, Han W, Wang Y, Xu D, Zhang X, Bhattacharya D, and Ye N (2020). Phytoplankton pangenome reveals extensive prokaryotic horizontal gene transfer of diverse functions. Sci. Adv 6. [DOI] [PMC free article] [PubMed] [Google Scholar]
- Gasmi L, Sieminska E, Okuno S, Ohta R, Coutu C, Vatanparast M, Harris S, Baldwin D, Hegedus DD, Theilmann DA, et al. (2021). Horizontally transmitted parasitoid killing factor shapes insect defense to parasitoids. Science (80−.) 373, 535–541. [DOI] [PubMed] [Google Scholar]
- Gonçalves C, Wisecaver JH, Kominek J, Oom MS, Leandro MJ, Shen X-X, Opulente DA, Zhou X, Peris D, Kurtzman CP, et al. (2018). Evidence for loss and reacquisition of alcoholic fermentation in a fructophilic yeast lineage. Elife 7, e33034. [DOI] [PMC free article] [PubMed] [Google Scholar]
- Greenspan RJ, and Ferveur J-F (2000). COURTSHIP IN DROSOPHILA. Annu. Rev. Genet 34, 205–232. [DOI] [PubMed] [Google Scholar]
- Hotopp JCD, Clark ME, Oliveira DCSG, Foster JM, Fischer P, Torres MCM, Giebel JD, Kumar N, Ishmael N, Wang S, et al. (2007). Widespread Lateral Gene Transfer from Intracellular Bacteria to Multicellular Eukaryotes. Science (80−.) 317, 1753–1756. [DOI] [PubMed] [Google Scholar]
- Husnik F, and McCutcheon JP (2018). Functional horizontal gene transfer from bacteria to eukaryotes. Nat. Rev. Microbiol 16, 67–79. [DOI] [PubMed] [Google Scholar]
- Husnik F, Nikoh N, Koga R, Ross L, Duncan RP, Fujie M, Tanaka M, Satoh N, Bachtrog D, Wilson ACC, et al. (2013). Horizontal Gene Transfer from Diverse Bacteria to an Insect Genome Enables a Tripartite Nested Mealybug Symbiosis. Cell 153, 1567–1578. [DOI] [PubMed] [Google Scholar]
- Ihaka R, and Gentleman R (1996). R: a language for data analysis and graphics. J. Comput. Graph. Stat 5, 299–314. [Google Scholar]
- Irwin NAT, Pittis AA, Richards TA, and Keeling PJ (2022). Systematic evaluation of horizontal gene transfer between eukaryotes and viruses. Nat. Microbiol 7, 327–336. [DOI] [PubMed] [Google Scholar]
- Jumper J, Evans R, Pritzel A, Green T, Figurnov M, Ronneberger O, Tunyasuvunakool K, Bates R, Žídek A, Potapenko A, et al. (2021). Highly accurate protein structure prediction with AlphaFold. Nature 596, 583–589. [DOI] [PMC free article] [PubMed] [Google Scholar]
- Katoh K, and Standley DM (2013). MAFFT multiple sequence alignment software version 7: Improvements in performance and usability. Mol. Biol. Evol 30, 772–780. [DOI] [PMC free article] [PubMed] [Google Scholar]
- Kriventseva EV, Kuznetsov D, Tegenfeldt F, Manni M, Dias R, Simão FA, and Zdobnov EM (2019). OrthoDB v10: sampling the diversity of animal, plant, fungal, protist, bacterial and viral genomes for evolutionary and functional annotations of orthologs. Nucleic Acids Res 47, D807–D811. [DOI] [PMC free article] [PubMed] [Google Scholar]
- Kumar S, Stecher G, and Tamura K (2016). MEGA7: Molecular Evolutionary Genetics Analysis Version 7.0 for Bigger Datasets. Mol. Biol. Evol 33, 1870–1874. [DOI] [PMC free article] [PubMed] [Google Scholar]
- Di Lelio I, Illiano A, Astarita F, Gianfranceschi L, Horner D, Varricchio P, Amoresano A, Pucci P, Pennacchio F, and Caccia S (2019). Evolution of an insect immune barrier through horizontal gene transfer mediated by a parasitic wasp. PLOS Genet 15, e1007998. [DOI] [PMC free article] [PubMed] [Google Scholar]
- Letunic I, and Bork P (2019). Interactive Tree Of Life (iTOL) v4: recent updates and new developments. Nucleic Acids Res 47, W256–W259. [DOI] [PMC free article] [PubMed] [Google Scholar]
- Liao Y, Smyth GK, and Shi W (2014). featureCounts: an efficient general purpose program for assigning sequence reads to genomic features. Bioinformatics 30, 923–930. [DOI] [PubMed] [Google Scholar]
- Manni M, Berkeley MR, Seppey M, Simão FA, and Zdobnov EM (2021). BUSCO Update: Novel and Streamlined Workflows along with Broader and Deeper Phylogenetic Coverage for Scoring of Eukaryotic, Prokaryotic, and Viral Genomes. Mol. Biol. Evol 38, 4647–4654. [DOI] [PMC free article] [PubMed] [Google Scholar]
- McKenna DD, Shin S, Ahrens D, Balke M, Beza-Beza C, Clarke DJ, Donath A, Escalona HE, Friedrich F, Letsch H, et al. (2019). The evolution and genomic basis of beetle diversity. Proc. Natl. Acad. Sci 116, 24729–24737. [DOI] [PMC free article] [PubMed] [Google Scholar]
- Meng Y, Katsuma S, Mita K, and Shimada T (2009). Abnormal red body coloration of the silkworm, Bombyx mori, is caused by a mutation in a novel kynureninase. Genes to Cells 14, 129–140. [DOI] [PubMed] [Google Scholar]
- Merrill RM, Rastas P, Martin SH, Melo MC, Barker S, Davey J, McMillan WO, and Jiggins CD (2019). Genetic dissection of assortative mating behavior. PLOS Biol 17, e2005902. [DOI] [PMC free article] [PubMed] [Google Scholar]
- Minh BQ, Nguyen MAT, and von Haeseler A (2013). Ultrafast Approximation for Phylogenetic Bootstrap. Mol. Biol. Evol 30, 1188–1195. [DOI] [PMC free article] [PubMed] [Google Scholar]
- Misof B, Liu S, Meusemann K, Peters RS, Donath A, Mayer C, Frandsen PB, Ware J, Flouri T, Beutel RG, et al. (2014). Phylogenomics resolves the timing and pattern of insect evolution. Science (80−.) 346, 763–767. [DOI] [PubMed] [Google Scholar]
- Mistry J, Chuguransky S, Williams L, Qureshi M, Salazar GA, Sonnhammer ELL, Tosatto SCE, Paladin L, Raj S, Richardson LJ, et al. (2021). Pfam: The protein families database in 2021. Nucleic Acids Res 49, D412–D419. [DOI] [PMC free article] [PubMed] [Google Scholar]
- Moran NA, and Jarvik T (2010). Lateral Transfer of Genes from Fungi Underlies Carotenoid Production in Aphids. Science (80−.) 328, 624–627. [DOI] [PubMed] [Google Scholar]
- Nguyen L-T, Schmidt HA, von Haeseler A, and Minh BQ (2015). IQ-TREE: A Fast and Effective Stochastic Algorithm for Estimating Maximum-Likelihood Phylogenies. Mol. Biol. Evol 32, 268–274. [DOI] [PMC free article] [PubMed] [Google Scholar]
- Ou S, Su W, Liao Y, Chougule K, Agda JRA, Hellinga AJ, Lugo CSB, Elliott TA, Ware D, Peterson T, et al. (2019). Benchmarking transposable element annotation methods for creation of a streamlined, comprehensive pipeline. Genome Biol 20, 275. [DOI] [PMC free article] [PubMed] [Google Scholar]
- Pan Y, and Baker BS (2014). Genetic Identification and Separation of Innate and Experience-Dependent Courtship Behaviors in Drosophila. Cell 156, 236–248. [DOI] [PMC free article] [PubMed] [Google Scholar]
- Paniagua Voirol LR, Frago E, Kaltenpoth M, Hilker M, and Fatouros NE (2018). Bacterial Symbionts in Lepidoptera: Their Diversity, Transmission, and Impact on the Host. Front. Microbiol 9. [DOI] [PMC free article] [PubMed] [Google Scholar]
- Paradis E, Claude J, and Strimmer K (2004). APE: Analyses of Phylogenetics and Evolution in R language. Bioinformatics 20, 289–290. [DOI] [PubMed] [Google Scholar]
- Parker BJ, and Brisson JA (2019). A Laterally Transferred Viral Gene Modifies Aphid Wing Plasticity. Curr. Biol 29, 2098–2103.e5. [DOI] [PMC free article] [PubMed] [Google Scholar]
- Perreau J, and Moran NA (2022). Genetic innovations in animal–microbe symbioses. Nat. Rev. Genet 23, 23–39. [DOI] [PMC free article] [PubMed] [Google Scholar]
- Reyes-Prieto M, Vargas-Chávez C, Latorre A, and Moya A (2015). SymbioGenomesDB: a database for the integration and access to knowledge on host–symbiont relationships. Database 2015, bav109. [DOI] [PMC free article] [PubMed] [Google Scholar]
- Ritchie ME, Phipson B, Wu D, Hu Y, Law CW, Shi W, and Smyth GK (2015). limma powers differential expression analyses for RNA-sequencing and microarray studies. Nucleic Acids Res 43, e47–e47. [DOI] [PMC free article] [PubMed] [Google Scholar]
- Robinson MD, McCarthy DJ, and Smyth GK (2010). edgeR: a Bioconductor package for differential expression analysis of digital gene expression data. Bioinformatics 26, 139–140. [DOI] [PMC free article] [PubMed] [Google Scholar]
- Rose AB, Emami S, Bradnam K, and Korf I (2011). Evidence for a DNA-Based Mechanism of Intron-Mediated Enhancement. Front. Plant Sci 2. [DOI] [PMC free article] [PubMed] [Google Scholar]
- Rossi M, Hausmann AE, Thurman TJ, Montgomery SH, Papa R, Jiggins CD, McMillan WO, and Merrill RM (2020). Visual mate preference evolution during butterfly speciation is linked to neural processing genes. Nat. Commun 11, 4763. [DOI] [PMC free article] [PubMed] [Google Scholar]
- Schliep KP (2011). phangorn: phylogenetic analysis in R. Bioinformatics 27, 592–593. [DOI] [PMC free article] [PubMed] [Google Scholar]
- Shen X-X, Opulente DA, Kominek J, Zhou X, Steenwyk JL, Buh KV, Haase MAB, Wisecaver JH, Wang M, Doering DT, et al. (2018). Tempo and Mode of Genome Evolution in the Budding Yeast Subphylum. Cell 175, 1533–1545.e20. [DOI] [PMC free article] [PubMed] [Google Scholar]
- Smith CR, Toth AL, Suarez AV, and Robinson GE (2008). Genetic and genomic analyses of the division of labour in insect societies. Nat. Rev. Genet 9, 735–748. [DOI] [PubMed] [Google Scholar]
- Song W, Liu L, Li P, Sun H, and Qin Y (2014). Analysis of the Mating and Reproductive Traits of Plutella xylostella (Lepidoptera: Plutellidae). J. Insect Sci 14. [DOI] [PMC free article] [PubMed] [Google Scholar]
- Steinegger M, and Salzberg SL (2020). Terminating contamination: Large-scale search identifies more than 2,000,000 contaminated entries in GenBank. Genome Biol 21, 1–8. [DOI] [PMC free article] [PubMed] [Google Scholar]
- Stork NE (2018). How Many Species of Insects and Other Terrestrial Arthropods Are There on Earth? Annu. Rev. Entomol 63, 31–45. [DOI] [PubMed] [Google Scholar]
- Sun BF, Xiao JH, He SM, Liu L, Murphy RW, and Huang DW (2013). Multiple ancient horizontal gene transfers and duplications in lepidopteran species. Insect Mol. Biol 22, 72–87. [DOI] [PubMed] [Google Scholar]
- Waterhouse RM, Tegenfeldt F, Li J, Zdobnov EM, and Kriventseva EV (2013). OrthoDB: a hierarchical catalog of animal, fungal and bacterial orthologs. Nucleic Acids Res 41, D358–D365. [DOI] [PMC free article] [PubMed] [Google Scholar]
- Wisecaver JH, Alexander WG, King SB, Hittinger CT, and Rokas A (2016). Dynamic Evolution of Nitric Oxide Detoxifying Flavohemoglobins, a Family of Single-Protein Metabolic Modules in Bacteria and Eukaryotes. Mol. Biol. Evol 33, 1979–1987. [DOI] [PubMed] [Google Scholar]
- Woods LC, Gorrell RJ, Taylor F, Connallon T, Kwok T, and McDonald MJ (2020). Horizontal gene transfer potentiates adaptation by reducing selective constraints on the spread of genetic variation. Proc. Natl. Acad. Sci 117, 26868–26875. [DOI] [PMC free article] [PubMed] [Google Scholar]
- Woolfit M, Iturbe-Ormaetxe I, McGraw EA, and O’Neill SL (2009). An Ancient Horizontal Gene Transfer between Mosquito and the Endosymbiotic Bacterium Wolbachia pipientis. Mol. Biol. Evol 26, 367–374. [DOI] [PubMed] [Google Scholar]
- Xia J, Guo Z, Yang Z, Han H, Wang S, Xu H, Yang X, Yang F, Wu Q, Xie W, et al. (2021). Whitefly hijacks a plant detoxification gene that neutralizes plant toxins. Cell 184, 1693–1705.e17. [DOI] [PubMed] [Google Scholar]
- Xu J, Liu W, Yang D, Chen S, Chen K, Liu Z, Yang X, Meng J, Zhu G, Dong S, et al. (2020). Regulation of olfactory-based sex behaviors in the silkworm by genes in the sex-determination cascade. PLOS Genet 16, e1008622. [DOI] [PMC free article] [PubMed] [Google Scholar]
- Yamamoto D, and Koganezawa M (2013). Genes and circuits of courtship behaviour in Drosophila males. Nat. Rev. Neurosci 14, 681–692. [DOI] [PubMed] [Google Scholar]
- Zhou Y, Zhou B, Pache L, Chang M, Khodabakhshi AH, Tanaseichuk O, Benner C, and Chanda SK (2019). Metascape provides a biologist-oriented resource for the analysis of systems-level datasets. Nat. Commun 10, 1523. [DOI] [PMC free article] [PubMed] [Google Scholar]
- Zhu B, Lou M-M, Xie G-L, Zhang G-Q, Zhou X-P, Li B, and Jin G-L (2011). Horizontal gene transfer in silkworm, Bombyx mori. BMC Genomics 12, 248. [DOI] [PMC free article] [PubMed] [Google Scholar]
Associated Data
This section collects any data citations, data availability statements, or supplementary materials included in this article.
Supplementary Materials
Figure S1. The workflow used for the identification of genes found in insects that were likely acquired by horizontal gene transfer (HGT) from non-metazoan species, Related to Figure 1. A detailed description of the analyses performed in each step of the workflow is provided in the “Identification of HGTs into insects” section of the Methods. RECIPIENT: insects, GROUP: other metazoans, OUTGROUP: non-metazoan species.
Figure S2. Distribution of 741 HGT events on the insect phylogeny, Related to Figure 1. Examination of the phylogenetic trees of the 1,410 HGT-acquired genes showed that they stem from 741 distinct transfer events. 588 of these transfer events appear to be species-specific, whereas the remaining 153 are inferred to have occurred in the common ancestor of two or more species included in our study. Bars next to species names denote numbers of species-specific HGT events. Numbers near internodes denote numbers of HGT events that led to HGT-acquired genes found in two or more species. The RelTime algorithm employed in the command line version of MEGA7 was used to infer the relative divergence times. Note that detained numbers of HGT events given a range of the relative divergence times are given in the inset in the middle of the timetree.
Figure S3. Comparisons of developmental phenotypes between wild-type (WT) and knockout (MT-139) Plutella xylostella diamondback moths, Related to Figure 5. A) Body size (length and width), feeding (measured by the concentration of brilliant blue in extracts from abdomens of five moths after feeding with the mixture of brilliant blue and honey water), and movement (measured by percentage of 10 moths climbing over half a bottle [height: 20cm; diameter 2cm] in five minutes) were examined in wild-type (WT) and knockout (MT-139) male and female adults. B) Testis size (testis area) in wild-type (WT) and knockout (MT-139) male adults. C) Percentage of alive sperms in wild-type (WT) and knockout (MT-139) sperm bundles. GFP (SYBR 14 dye) and RFP (propidium iodide) were used to transfect sperms (LIVE/DEAD Sperm Viability Kit). Red arrows indicate examples of sperms that were alive or dead. Number of replicates for examining body size is 15; Number of replicates for examining feeding and movement is 6; Number of replicates for examining testis size and sperm activity is 3. All diamondback moths that were used to examine the developmental phenotypes were one day old after emergence. Each bar denotes mean value with standard deviation. The Wilcoxon rank-sum test was used to test whether the sets of values in two groups are significantly different (NS, P > 0.05). Our results show wild-type (WT) and knockout (MT-139) diamondback moths had no significant differences in any of the developmental phenotypes examined.
Figure S4. The horizontally acquired gene LOC105383139 might be involved in male courtship behavior in butterflies, Related to Figure 5. A) Two closely related Heliconius male butterflies (H. melpomene and H. cydno) were used to examine the number of courting episodes toward females in five trials (each trial lasted 15 minutes), respectively. The publicly available courtship data were retrieved from Merrill et al. (Merrill et al., 2019). B) The expression level of the horizontally acquired gene LOC105383139 in H. melpomene and H. cydno males during courting. The publicly available transcriptome datasets were generated in 2019 from the combined tissues (eye and brain) from 10-day-old male adults, because by this stage males are mature and frequently court females (Rossi et al., 2020). These data suggest that H. melpomene males had significantly higher number of courting episodes toward females than H. cydno males as well as higher expression levels of the gene LOC105383139 than H. cydno males. These results are consistent with our hypothesis that the foreign gene LOC105383139 might be involved in male courtship behavior in lepidopterans.
Figure S5. GO term enrichment analysis of genes differentially expressed in knockout (MT-139) male (A) and female (B) relative to wild-type (WT) male and female, Related to Figure 5. Statistically overrepresented GO categories in under-expressed and over-expressed gene sets in MT-139 vs WT are shown in left panel and right panel, respectively. −Log10(P) is the P-value in −log base 10. Bar graph of enriched terms across input gene lists, colored by P-values. The transcriptome data were generated from the whole bodies of ten 1day-old wild-type male adults (WT male), ten 1-day-old wild-type female adults (WT female), ten 1-day-old knockout male adults (MT-139 male), and ten 1-day-old knockout female adults (MT-139 female), respectively.
Table S1. The list of genome information for 218 insects used in our study, Related to Figure 1.
Table S2. The list of 1,410 HGT-acquired genes identified in our study, Related to Figure 1.
Table S3. Gene expression of 699 HGT-acquired genes in 32 insects along with stage and tissue information for each transcriptome dataset, Related to Figure 4.
Table S4. The statistics of courtship index and mating index between males and females, Related to Figure 5.
Video S1. Behavioral experiments between wild-type and knockout diamondback moths, Related to Figure 5.
Data Availability Statement
All gene alignments, gene trees, additional figures and tables, and summary statistics, are publicly available on the figshare repository (http://dx.doi.org/10.6084/m9.figshare.18094172). Raw RNA sequencing data has been deposited in GenBank under Bioproject ID: PRJNA801500 and are publicly available as of the date of publication.
All original code is publicly available on Github (https://github.com/xingxingshen/HGTfinder).
Any additional information required to reanalyze the data reported in this work paper is available from the Lead Contact upon request.