
FIGURE 2.
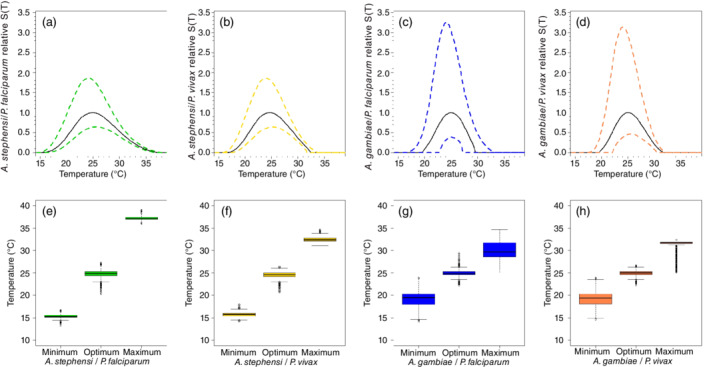
Top row: relative transmission suitability divided by the maximum value of the posterior median for (a) A. stephensi/Plasmodium falciparum, (b) A. stephensi/Plasmodium vivax, (c) A. gambiae/P. falciparum, and (d) A. gambiae/P. vivax. Bottom row: median, interquartile range, minimum, and maximum numbers from the posterior for the minimum temperature, optimum temperature, and maximum temperature for the of (e) A. stephensi/P. falciparum, (f) A. stephensi/P. vivax, (g) A. gambiae/P. falciparum, and (h) A. gambiae/P. vivax