Abstract
Brain tissue of Alzheimer’s disease patients invariably contains deposits of insoluble, fibrillar aggregates of peptide fragments of the amyloid precursor protein (APP), typically 40 or 42 residues in length and referred to as Aβ40 and Aβ42. However, it remains unclear whether these fibrils or oligomers constitute the toxic species. Depending on sample conditions, oligomers can form in a few seconds or less. These oligomers are invisible to solution NMR spectroscopy, but they can be rapidly (< 1 s) resolubilized and converted to their NMR-visible monomeric constituents by raising the hydrostatic pressure to a few kbar. Hence, utilizing pressure-jump NMR, the oligomeric state can be studied at residue-specific resolution by monitoring its signals in the monomeric state. Oligomeric states of Aβ40 exhibit a high degree of order, reflected by slow longitudinal 15N relaxation (T1 >5 s) for residues 18–21 and 31–34, whereas the N-terminal 10 residues relax much faster (T1 ≤1.5 s), indicative of extensive internal motions. Transverse relaxation rates rapidly increase to ca. 1000 s−1 after the oligomerization is initiated.
Graphical Abstract
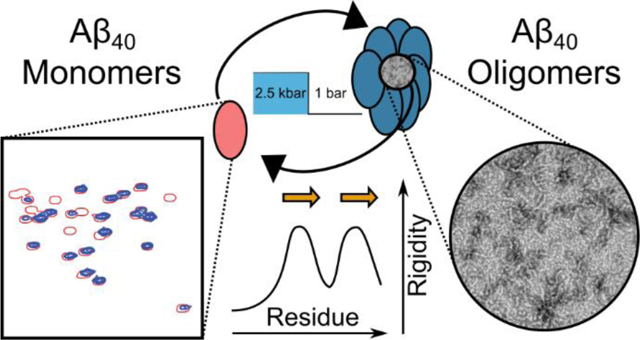
Amyloid diseases are characterized by the presence of protease-resistant aggregates of peptides or proteins. These disorders occur spontaneously, mostly later in life, and are associated with a wide range of ailments, ranging from Alzheimer’s and Parkinson’s disease to type 2 diabetes and amyloidosis.1 It remains a matter of debate whether the mature fibrils or smaller oligomeric aggregates are the dominant toxic species in vivo. Alternatively, oligomers in dynamic equilibrium with mature fibrils have been implicated as the cause of neuronal dysfunction.2 Atomic resolution models of many types of mature fibrils have been derived from solid state NMR data3–6 and, more recently, cryo-electron microscopy.7–8 These structures are characterized by the presence of canonical cross−β structure, but exhibit a wide diversity of arrangements,3, 6, 9 which in some cases has been correlated with disease phenotype.10–11
Despite their strong link to cellular pathology,2, 12–14 considerably less structural information is available about the oligomeric species. Small clusters of monomers have a high surface-to-volume ratio and therefore a high interfacial energy with water, making them inherently unstable. However, once present, nucleation theory predicts their rapid further growth, provided that the concentration of monomers is sufficiently high.15 Detailed structural characterization of such a fleeting species therefore presents a fundamental experimental challenge. Here, we introduce technology that rapidly switches Aβ40 between its monomeric and oligomeric states, permitting the repeated observation of oligomer formation and growth while providing structural details on this enigmatic process.
Hydrostatic pressure has long been used to denature natively-folded proteins, a process attributed to the smaller molar volume of the unfolded chain relative to the native protein fold.16–17 Whereas several types of amyloid fibrils similarly can be reverted to their soluble monomeric states by the application of a few kbar of pressure, this tends to be a slow process, requiring hours.18–20 By contrast, we demonstrate that Aβ40 can not only oligomerize very rapidly, but it can also be converted back rapidly to the monomeric, intrinsically-disordered state. Analogous to the study of protein folding, oligomer formation can then be tracked by recording NMR spectra21 while repeatedly jumping between low pressure, which favors the aggregated state, and high pressure, where the oligomer melts and reverts to its monomeric, disordered state.
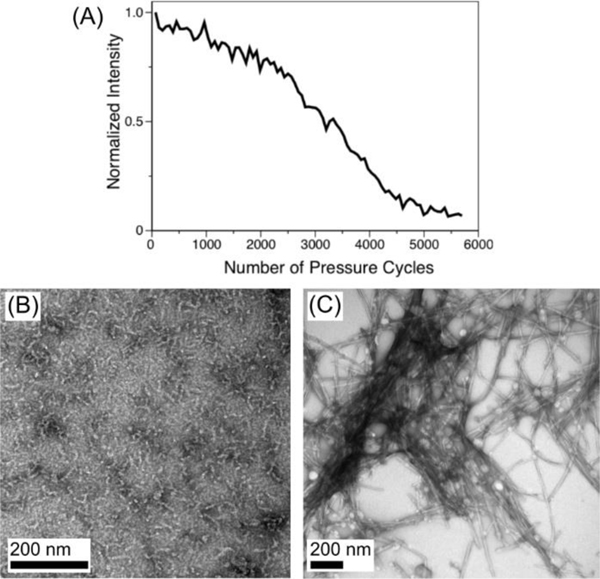
For natively folded proteins, the unfolding/refolding cycle can often be repeated indefinitely; for Aβ40 the process is repeatable only a finite number of times before a pressure-resistant, insoluble, fibrillar species forms and depletes the NMR-visible monomeric species (Figure 1). NMR measurements were carried out at high concentrations of peptide (ca 1.3 mM), at room temperature, at relatively high ionic strength, and pH 6.0 (see SI), conditions that reduce the oligomerization time to seconds at 1 bar.
Figure 1.
Loss of monomeric peptide signal and formation of Aβ1−40 ordered structures during pressure-jump NMR experiments. (A) Decay of Aβ40 HSQC intensity, recorded 9.8 s after jumping to 2.5 kbar, as a function of the number of high-pressure/low-pressure (10 s/ 5 s) cycles. The last time point corresponds to 24 h after the start of the pressure-jump NMR experiment. (B, C) TEM images of negatively stained samples harvested at atmospheric pressure after a single pressure cycle (B) or after 12,000 pressure cycles (C).
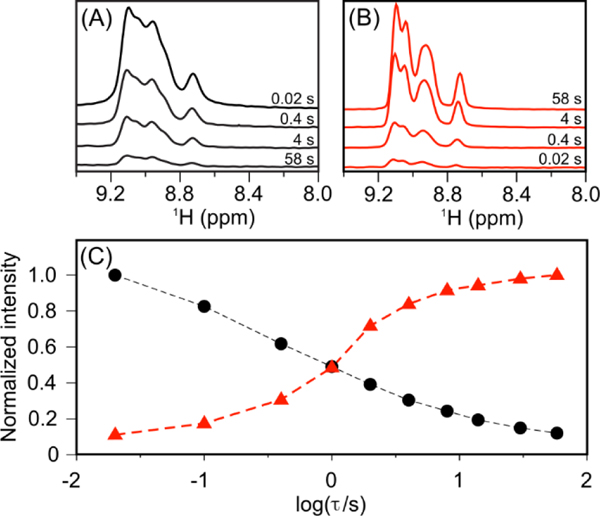
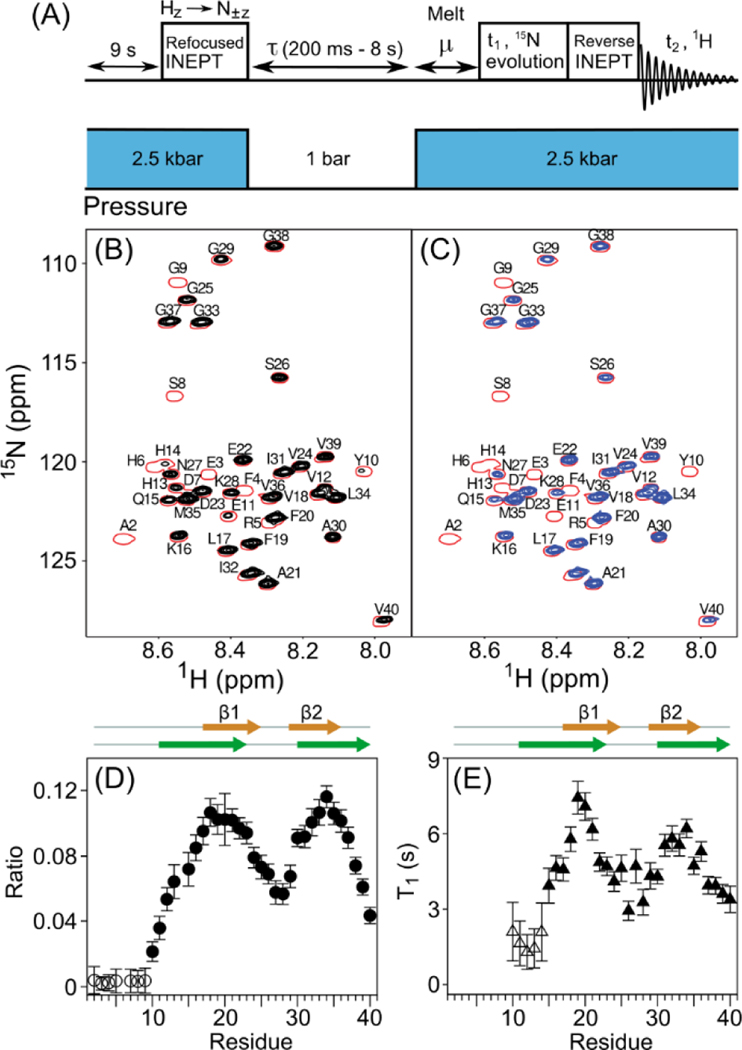
Protein folding studies by pressure-jump NMR are most informative when the times needed for folding and unfolding are much shorter than the longitudinal relaxation time of the protein’s 15N nuclei.21 Resonances of the unfolded protein recorded following a pressure jump then can report on the state of the (partially) folded protein while it develops at low pressure.22 Under our conditions, 1 second at low pressure sufficed for extensive Aβ40 oligomer formation, with a comparable time needed for the aggregate to return to its monomeric form after jumping back to high pressure (Figure 2). The short (~600 ms) 15N T1 relaxation times of the monomeric peptide prevent direct application of the recently developed pressure-jump protein folding experiments due to the inability to separate signals originating from peptides that oligomerized from peptides that remained free in solution at 1 bar. However, whereas 15N T1 values of disordered peptides and small proteins are short, 15N relaxation times in solids or in very large, slowly tumbling protein systems can be many seconds or even minutes.23–24 Therefore, oligomeric states formed following a pressure drop will preserve a substantial fraction of their non-equilibrium 15N nuclear spin polarization long after that of the monomeric Aβ40 peptide has vanished. At the end of the ~5s low pressure interval (Figure 3A), the pressure is jumped back to high, causing the oligomers to redissolve. While some relaxation occurs during this 350-ms “melting period”, the fraction that is retained during the subsequent 15N t1 evolution period will be visible in the two-dimensional 15N-1H correlation map, and can therefore unveil structural properties of the oligomeric state. Effectively, the ca. 5-s low pressure duration between initial 15N polarization and HSQC detection serves as a T1 relaxation filter: residues that become immobilized due to oligomerization during the low-pressure interval retain a substantial fraction of their signal and remain visible to NMR; peptides that remain monomeric are attenuated more than 1000-fold and are therefore invisible.
Figure 2.
Time course of Aβ40 aliphatic proton resonance intensity following a sudden change in pressure. (A) Spectra recorded at the indicated times after a rapid drop in pressure from 2.5 kbar to 1 bar following a 30-s sample equilibration at 2.5 kbar. (B) Spectra recorded after a jump in pressure to 2.5 kbar following 30-s equilibration at 1 bar. (C) Integrated methyl group resonance intensity (1.05–0.7 ppm) as a function of time following the pressure drop (black) or pressure jump (red).
Figure 3.
Observation of Aβ40 1H-15N HSQC signals during a T1-filtered pressure-jump NMR experiment. (A) Schematic timing diagram; see SI for details. Strong, non-equilibrium 15N z magnetization is generated by a refocused INEPT transfer28 just prior to dropping the pressure. After a variable low-pressure delay (0.2–8 s) and a 350-ms “melting” interval, μ, at high pressure, 15N t1 evolution and 1H detection are used to generate conventional 15N-1H HSQC spectra. (B) Overlays of spectra recorded with a 0.2 s low-pressure duration (single red contour), and resonances that remain after a 5.5-s low-pressure interval (black contours). (C) Overlay of the spectra recorded with 0.2-s (red) and 8-s (blue) low-pressure intervals. (D) Intensity ratios observed in (B) vs. Residue number. Open symbols correspond to an upper limit for the non-observed intensity. (E) 15N longitudinal relaxation time (T1) in the oligomeric state, derived from the intensity ratio of resonances observed with 5.5-s and 8-s low pressure durations. β-strand positions are from Hoyer et al.25 (orange) and Paravastu et al.3 (green).
Comparison of Aβ40 15N-1H correlation spectra recorded with either a 200-ms or a 5.5-s low-pressure duration shows the selective loss of signals from residues A2-G9 that did not rapidly gain a substantial degree of order during the low-pressure period (Figure 3B, D), contrasting with high intensities, in particular for L17-D23 and I30-G37. Longitudinal 15N relaxation in the very slowly tumbling, oligomeric species is dominated by internal motions. These T1 values can be derived from spectral intensities obtained with 5.5-s and 8-s low pressure intervals (2-point T1 measurement, Figure 3C). As expected, on average these T1 values correlate with the fractional signal intensity recovered after the T1 filter (Figure 3D,E). However, the rates at which different residues lose mobility during oligomerization varies. For example, the T1 values of C-terminal residues G37-V40 are all in the 3.5–4 s range, whereas the fraction of recovered magnetization is two-fold higher for G37 than for V40. This result indicates that V40 becomes ordered later than G37, i.e, only after the oligomer has increased in size. The highest fraction of recovered magnetization, corresponding to residues that become most ordered at an early stage of the oligomerization process, coincides with the two anti-parallel strands in the X-ray structure of an affibody-trapped Aβ40,25 which has been linked to structural features seen in oligomers and protofibrils.26
Growth of the oligomeric species can be monitored by 15N R2 transverse relaxation measurements. In the macromolecular limit, these rates are dominated by J(0) spectral density terms, which means that R2 values are proportional to S2τc, where S2 is the generalized Lipari-Szabo order parameter for internal motion,27 ranging between 0 (total disorder) and 1 (fully rigid), and τc is the rotational correlation time. Only residues with long T1 15N relaxation times are observed in our measurements, in practice requiring S2 ≥ ~0.7. Therefore, R2 provides a direct measure for τc of the oligomers during their growth phase.
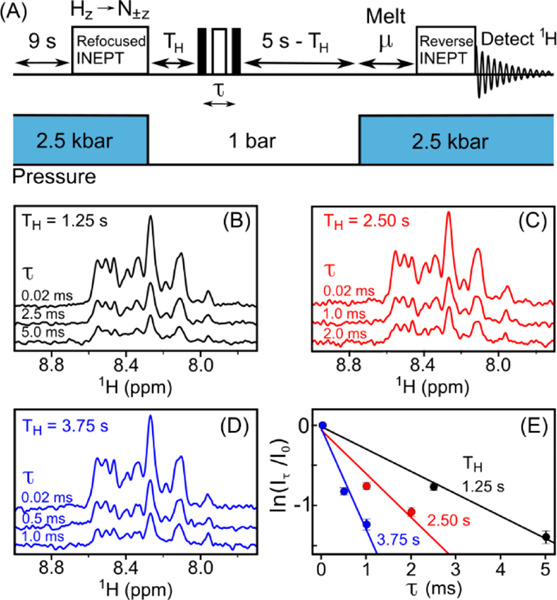
15N R2 values were probed at three time points after the initiation of oligomerization by the pressure drop (1.25 s, 2.5 s, and 3.75 s) by inserting a Hahn-echo R2 block within the 5s low-pressure T1 filter (Figure 4A). Even at the early, 1.25-s time point, transverse relaxation occurs at a rapid rate of ca. 275 s−1, about 50-fold faster than for the monomeric peptide (Figure 4). Although signal-to-noise was insufficient to measure the R2 values in a residue-specific manner (which would require 2D spectra), the decay of the various resonances in the one-dimensional spectra appears quite homogeneous. This makes it unlikely that conformational exchange, which typically shows large residue-by-residue variations, has a strong impact on these R2 rates. Assuming an average S2 ≈ 0.85 value and an assumption of approximately isotropic tumbling, R2 = 275 s−1 yields an estimate for the tumbling time of τc ≈ 200 ns, or a particle size of ca. 350 kDa, which corresponds to a mass of roughly 80 peptides. When doubling the time interval at which the Hahn-echo block is inserted to 2.5 s after the pressure drop, R2 has increased to ca. 600 s−1. A further increase to R2 ≈ 1000 s−1 is seen at T=3.75 s, a value pointing to a size of ca. 1.3 MDa, or about 300 peptides. The transverse decay appears somewhat non-exponential, with the decay slightly faster at short echo times, τ, and slower at longer τ values. This behavior is seen at all three TH values and indicates that aggregate sizes are heterogeneous, with reported values reflecting rough averages under the conditions of our measurement.
Figure 4.
Measurement of transverse 15N relaxation rates of Aβ1−40 oligomers during a pressure-jump NMR experiment. (A) Schematic timing diagram. The scheme differs from Figure 3A by insertion of a Hahn-echo block of duration τ at time TH into the low-pressure interval, and the absence of a t1 evolution period. See SI for details. (B-D) Amide regions of the 1H spectra detected for different Hahn-echo delay durations, τ, inserted at (B) TH=1.25 s, (C) TH=2.5 s, and (D) TH=3.75 s after the drop to low pressure. Each spectrum results from 256 transients, recorded in an interleaved manner, such that, to a very good approximation, sample aging affects all spectra equally. (E) Plots of the intensity decay observed in (B-D) as a function of τ.
Our pressure-jump NMR experiments provide a residue-specific recording of the initiation and growth of Aβ40 oligomers. Aβ aggregates can adopt different structures, which may relate to disease phenotype,10–11 and as demonstrated here, even pressure-resistant amyloids can develop. Morphologically, the Aβ40 oligomers harvested after a single pressure drop on a fresh 250 μM sample (Figure S3), have an appearance that does not show regular amyloid fibril structure and is more reminiscent of the features seen in TEM images of oligomers taken after rapidly neutralizing a sample initially prepared at pH 12.29 Furthermore, these oligomers formed after a single pressure-jump do not dissolve after a five-fold dilution unless the pressure is raised to 2.5 kbar (Figure S4). Given their morphological similarity to the pH-quenched oligomers29 (as assessed via TEM images), the pressure-jump oligomers likely contain anti-parallel β-strand arrangements, thereby creating a high energy barrier towards forming the parallel β-sheet arrangements seen in mature fibrils. The ability of pressure-jump NMR to provide site-specific information on the very earliest processes of aggregation opens fundamental new opportunities to study this critical process. Pressure-jump NMR in conjunction with NOE measurement, paramagnetic labeling, and stroboscopic chemical shift measurements of Aβ40 are currently in progress to gain further structural information.
Supplementary Material
ACKNOWLEDGMENTS
We thank J. Ying, M. Waelti, K. Thurber, J. Lloyd, and A. Aniana for technical support, G. Anfinrud and B. Howder for help in building the pressure-jump equipment, and R. Tycko, G.M. Clore, J. Courtney, D.A. Torchia and W.A. Eaton for helpful discussions. This work was supported by the Intramural Research Program of the NIDDK and by the Intramural Antiviral Target Program of the Office of the Director, NIH.
Footnotes
ASSOCIATED CONTENT
Supporting Information.
Experimental procedures and supporting figures with additional data. The Supporting Information is available free of charge on the ACS Publications website.
The authors declare no competing financial interest.
REFERENCES
- 1.Chiti F; Dobson CM, Protein Misfolding, Amyloid Formation, and Human Disease: A Summary of Progress Over the Last Decade. Annu. Rev. Biochem 2017, 86, 27–68. [DOI] [PubMed] [Google Scholar]
- 2.Haass C; Selkoe DJ, Soluble protein oligomers in neurodegeneration: lessons from the Alzheimer’s amyloid beta-peptide. Nat. Rev. Mol. Cell Biol 2007, 8 (2), 101–112. [DOI] [PubMed] [Google Scholar]
- 3.Paravastu AK; Leapman RD; Yau WM; Tycko R, Molecular structural basis for polymorphism in Alzheimer’s beta-amyloid fibrils. Proc. Natl. Acad. Sci. U. S. A 2008, 105 (47), 18349–18354. [DOI] [PMC free article] [PubMed] [Google Scholar]
- 4.Colvin MT; Silvers R; Ni QZ; Can TV; Sergeyev I; Rosay M; Donovan KJ; Michael B; Wall J; Linse S; Griffin RG, Atomic resolution structure of monomorphic A-beta(42) amyloid fibrils. J. Am. Chem. Soc 2016, 138 (30), 9663–9674. [DOI] [PMC free article] [PubMed] [Google Scholar]
- 5.Tuttle MD; Comellas G; Nieuwkoop AJ; Covell DJ; Berthold DA; Kloepper KD; Courtney JM; Kim JK; Barclay AM; Kendall A; Wan W; Stubbs G; Schwieters CD; Lee VMY; George JM; Rienstra CM, Solid-state NMR structure of a pathogenic fibril of full-length human alpha-synuclein. Nat. Struct. Mol. Biol 2016, 23 (5), 409–415. [DOI] [PMC free article] [PubMed] [Google Scholar]
- 6.Schutz AK; Vagt T; Huber M; Ovchinnikova OY; Cadalbert R; Wall J; Guntert P; Bockmann A; Glockshuber R; Meier BH, Atomic-Resolution Three-Dimensional Structure of Amyloid beta Fibrils Bearing the Osaka Mutation. Angew. Chemie Int. Ed 2015, 54 (1), 331–335. [DOI] [PMC free article] [PubMed] [Google Scholar]
- 7.Schmidt M; Rohou A; Lasker K; Yadav JK; Schiene-Fischer C; Fandrich M; Grigorieff N, Peptide dimer structure in an A beta(1–42) fibril visualized with cryo-EM. Proc. Natl. Acad. Sci. U. S. A 2015, 112 (38), 11858–11863. [DOI] [PMC free article] [PubMed] [Google Scholar]
- 8.Gremer L; Scholzel D; Schenk C; Reinartz E; Labahn J; Ravelli RBG; Tusche M; Lopez-Iglesias C; Hoyer W; Heise H; Willbold D; Schroder GF, Fibril structure of amyloid-beta(1–42) by cryo-electron microscopy. Science 2017, 358 (6359), 116-+. [DOI] [PMC free article] [PubMed] [Google Scholar]
- 9.Iadanza MG; Jackson MP; Hewitt EW; Ranson NA; Radford SE, A new era for understanding amyloid structures and disease. Nat. Rev. Mol. Cell Biol 2018, 19 (12), 755–773. [DOI] [PubMed] [Google Scholar]
- 10.Cohen ML; Kim C; Haldiman T; ElHag M; Mehndiratta P; Pichet T; Lissemore F; Shea M; Cohen Y; Chen W; Blevins J; Appleby BS; Surewicz K; Surewicz WK; Sajatovic M; Tatsuoka C; Zhang SL; Mayo P; Butkiewicz M; Haines JL; Lerner AJ; Safar JG, Rapidly progressive Alzheimer’s disease features distinct structures of amyloid-beta. Brain 2015, 138, 1009–1022. [DOI] [PMC free article] [PubMed] [Google Scholar]
- 11.Qiang W; Yau WM; Lu JX; Collinge J; Tycko R, Structural variation in amyloid-beta fibrils from Alzheimer’s disease clinical subtypes. Nature 2017, 541 (7636), 217–221. [DOI] [PMC free article] [PubMed] [Google Scholar]
- 12.Kayed R; Head E; Thompson JL; McIntire TM; Milton SC; Cotman CW; Glabe CG, Common structure of soluble amyloid oligomers implies common mechanism of pathogenesis. Science 2003, 300 (5618), 486–489. [DOI] [PubMed] [Google Scholar]
- 13.Viola KL; Klein WL, Amyloid beta oligomers in Alzheimer’s disease pathogenesis, treatment, and diagnosis. Acta Neuropathol. 2015, 129 (2), 183–206. [DOI] [PMC free article] [PubMed] [Google Scholar]
- 14.Winner B; Jappelli R; Maji SK; Desplats PA; Boyer L; Aigner S; Hetzer C; Loher T; Vilar M; Campionic S; Tzitzilonis C; Soragni A; Jessberger S; Mira H; Consiglio A; Pham E; Masliah E; Gage FH; Riek R, In vivo demonstration that alpha-synuclein oligomers are toxic. Proc. Natl. Acad. Sci. U. S. A 2011, 108 (10), 4194–4199. [DOI] [PMC free article] [PubMed] [Google Scholar]
- 15.Tornquist M; Michaels TCT; Sanagavarapu K; Yang XT; Meisl G; Cohen SIA; Knowles TPJ; Linse S, Secondary nucleation in amyloid formation. Chem. Commun. (Cambridge, U. K.) 2018, 54 (63), 8667–8684. [DOI] [PubMed] [Google Scholar]
- 16.Silva JL; Weber G, PRESSURE STABILITY OF PROTEINS. Annu. Rev. Phys. Chem 1993, 44, 89–113. [DOI] [PubMed] [Google Scholar]
- 17.Roche J; Caro JA; Norberto DR; Barthe P; Roumestand C; Schlessman JL; Garcia AE; Garcia-Moreno E B; Royer CA, Cavities determine the pressure unfolding of proteins. Proc. Natl. Acad. Sci. U. S. A 2012, 109 (18), 6945–6950. [DOI] [PMC free article] [PubMed] [Google Scholar]
- 18.Silva JL; Foguel D; Royer CA, Pressure provides new insights into protein folding, dynamics and structure. Trends Biochem. Sci 2001, 26 (10), 612–618. [DOI] [PubMed] [Google Scholar]
- 19.Kamatari YO; Yokoyama S; Tachibana H; Akasaka K, Pressure-jump NMR study of dissociation and association of amyloid protofibrils. J. Mol. Biol 2005, 349 (5), 916–921. [DOI] [PubMed] [Google Scholar]
- 20.Cavini IA; Munte CE; Erlach MB; van Groen T; Kadish I; Zhang T; Ziehm T; Nagel-Steger L; Kutzsche J; Kremer W; Willbold D; Kalbitzer HR, Inhibition of amyloid Ab aggregation by high pressures or specific D-enantiomeric peptides. Chem. Commun. (Cambridge, U. K.) 2018, 54 (26), 3294–3297. [DOI] [PubMed] [Google Scholar]
- 21.Charlier C; Alderson TR; Courtney JM; Ying J; Anfinrud P; Bax A, Study of protein folding under native conditions by rapidly switching the hydrostatic pressure inside an NMR sample cell. Proc. Natl. Acad. Sci. USA 2018, 115, 201803642. [DOI] [PMC free article] [PubMed] [Google Scholar]
- 22.Charlier C; Courtney JM; Anfinrud P; Bax A, Interrupted pressure-jump NMR experiments reveal resonances of on-pathway folding intermediate. J. Phys. Chem. B 2018, 122, 11792–11799. [DOI] [PMC free article] [PubMed] [Google Scholar]
- 23.Cole HBR; Torchia DA, An Nmr-Study of the Backbone Dynamics of Staphylococcal Nuclease in the Crystalline State. Chem. Phys 1991, 158 (2–3), 271–281. [Google Scholar]
- 24.Schanda P; Meier BH; Ernst M, Quantitative Analysis of Protein Backbone Dynamics in Microcrystalline Ubiquitin by Solid-State NMR Spectroscopy. J. Am. Chem. Soc 2010, 132 (45), 15957–15967. [DOI] [PubMed] [Google Scholar]
- 25.Hoyer W; Gronwall C; Jonsson A; Stahl S; Hard T, Stabilization of a beta-hairpin in monomeric Alzheimer’s amyloid-beta peptide inhibits amyloid formation. Proc. Natl. Acad. Sci. U. S. A 2008, 105 (13), 5099–5104. [DOI] [PMC free article] [PubMed] [Google Scholar]
- 26.Scheidt HA; Morgado I; Huster D, Solid-state NMR Reveals a Close Structural Relationship between Amyloid-beta Protofibrils and Oligomers. J. Biol. Chem 2012, 287 (27), 22822–22826. [DOI] [PMC free article] [PubMed] [Google Scholar]
- 27.Lipari G; Szabo A, Model-free approach to the interpretation of nuclear magnetic resonance relaxation in macromolecules. 1. Theory and range of validity. J. Am. Chem. Soc 1982, 104, 4546–4559. [Google Scholar]
- 28.Morris GA; Freeman R, Enhancement of nuclear magnetic resonance signals by polarization transfer. J. Am. Chem. Soc 1979, 101 (3), 760–762. [Google Scholar]
- 29.Potapov A; Yau WM; Ghirlando R; Thurber KR; Tycko R, Successive Stages of Amyloid-beta Self-Assembly Characterized by Solid-State Nuclear Magnetic Resonance with Dynamic Nuclear Polarization. J. Am. Chem. Soc 2015, 137 (25), 8294–8307. [DOI] [PMC free article] [PubMed] [Google Scholar]
Associated Data
This section collects any data citations, data availability statements, or supplementary materials included in this article.


